| Param | Original file | Final file |
|---|---|---|
| Filename | modeM0/AS1A07_039T02_9000003212_21696cztM0_level2.evt | modeM0/AS1A07_039T02_9000003212_21696cztM0_level2_quad_clean.evt |
| Size (bytes) | 537,814,080 | 135,846,720 |
| Size | 512.9 MB | 129.6 MB |
| Events in quadrant A | 3,101,420 | 925,114 |
| Events in quadrant B | 3,422,296 | 960,078 |
| Events in quadrant C | 5,476,458 | 903,517 |
| Events in quadrant D | 3,852,795 | 878,236 |
| Mode M0 | |||
|---|---|---|---|
| Quadrant | BADHDUFLAG | Total packets | Discarded packets |
| A | 0 | 13364 | 2 |
| B | 0 | 14254 | 2 |
| C | 0 | 20816 | 2 |
| D | 0 | 15818 | 3 |
| Mode SS | |||
|---|---|---|---|
| Quadrant | BADHDUFLAG | Total packets | Discarded packets |
| A | 0 | 130 | 0 |
| B | 0 | 130 | 0 |
| C | 0 | 130 | 0 |
| D | 0 | 130 | 0 |
| Mode M9 | |||
|---|---|---|---|
| Quadrant | BADHDUFLAG | Total packets | Discarded packets |
| A | 0 | 17 | 0 |
| B | 0 | 18 | 0 |
| C | 0 | 18 | 0 |
| D | 0 | 18 | 0 |
| Quadrant | Total seconds | Saturated seconds | Saturation percentage |
|---|---|---|---|
| A | 6420 | 21 | 0.327103% |
| B | 6420 | 69 | 1.074766% |
| C | 6420 | 219 | 3.411215% |
| D | 6419 | 94 | 1.464403% |
Noise dominated data is calculated using 1-second bins in cleaned event files. If a bin has >2000 counts, and if more than 50% of those come from <1% of pixels, then it is considered to be noise-dominated and hence unusable.
| Quadrant | # 1 sec bins | Bins with >0 counts | Bins with >2000 counts | High rate bins dominated by noise | Noise dominated (total time) | Noise dominated (detector-on time) | Marked lightcurve |
|---|---|---|---|---|---|---|---|
| A | 7710 | 6421 | 0 | 0 | 0.00% | 0.00% |  |
| B | 7710 | 6421 | 20 | 20 | 0.26% | 0.31% | 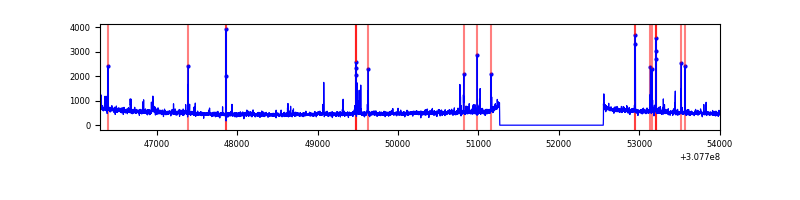 |
| C | 7710 | 6421 | 18 | 18 | 0.23% | 0.28% | 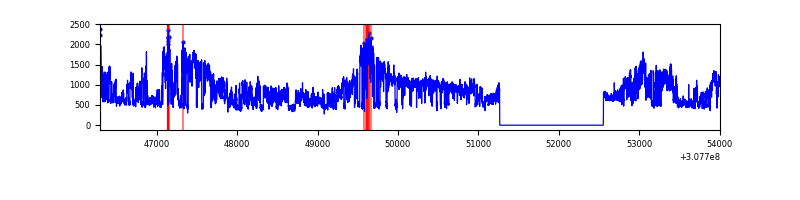 |
| D | 7709 | 6420 | 64 | 64 | 0.83% | 1.00% | 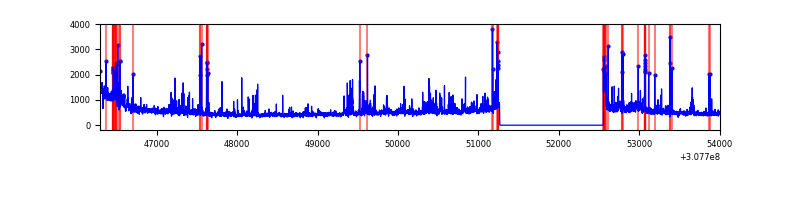 |
Top three noisy pixels from each quadrant. If the there are fewer than three noisy pixels in the level2.evt file, extra rows are filled as -1
| Pixel properties | Quadrant properties | ||||||
|---|---|---|---|---|---|---|---|
| Quadrant | DetID | PixID | Counts | Sigma | Mean | Median | Sigma |
| A | 13 | 254 | 12418 | 72.93 | 802 | 785 | 159.5 |
| A | 0 | 226 | 6976 | 38.81 | 802 | 785 | 159.5 |
| A | 3 | 137 | 6294 | 34.54 | 802 | 785 | 159.5 |
| B | 3 | 64 | 124771 | 830.82 | 815 | 798 | 149.2 |
| B | 0 | 229 | 47885 | 315.56 | 815 | 798 | 149.2 |
| B | 0 | 230 | 22009 | 142.15 | 815 | 798 | 149.2 |
| C | 8 | 208 | 2273611 | 12565.64 | 783 | 788 | 180.9 |
| C | 14 | 238 | 125772 | 690.99 | 783 | 788 | 180.9 |
| C | 10 | 22 | 12430 | 64.36 | 783 | 788 | 180.9 |
| D | 12 | 235 | 293118 | 1586.42 | 778 | 757 | 184.3 |
| D | 1 | 20 | 246279 | 1332.26 | 778 | 757 | 184.3 |
| D | 2 | 136 | 114315 | 616.19 | 778 | 757 | 184.3 |
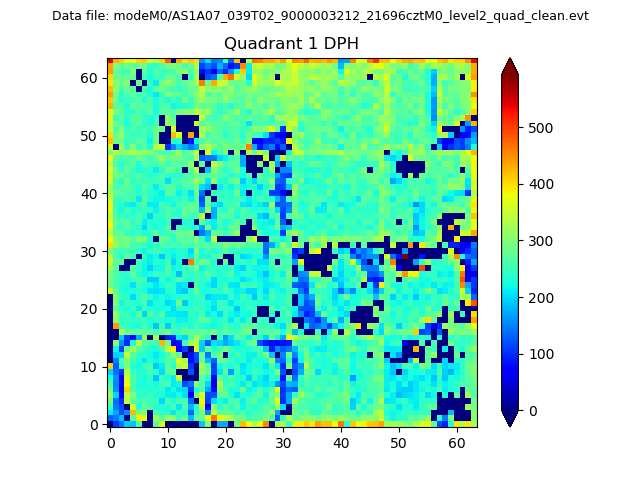
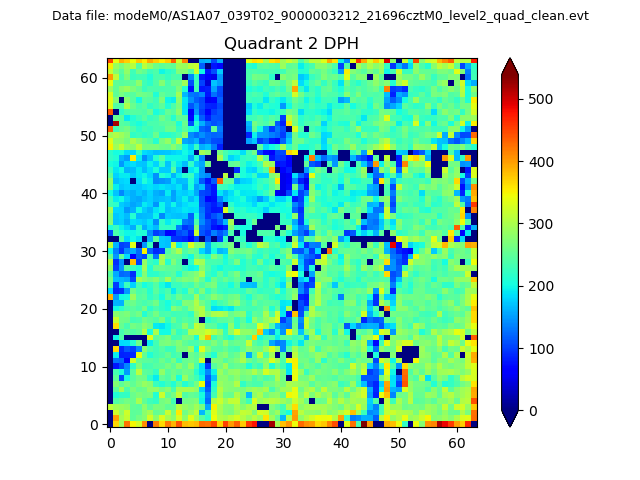
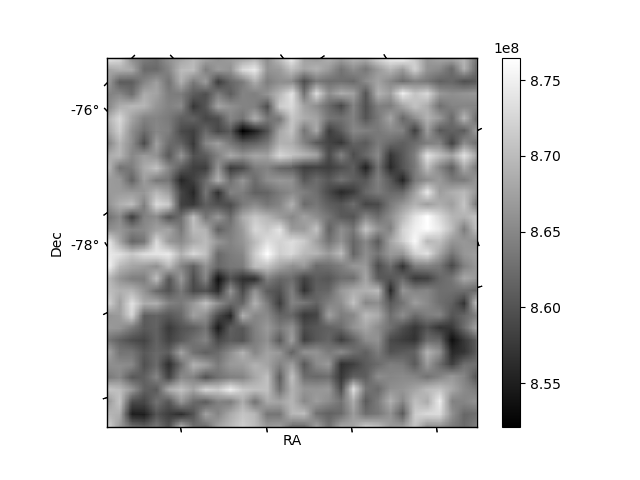
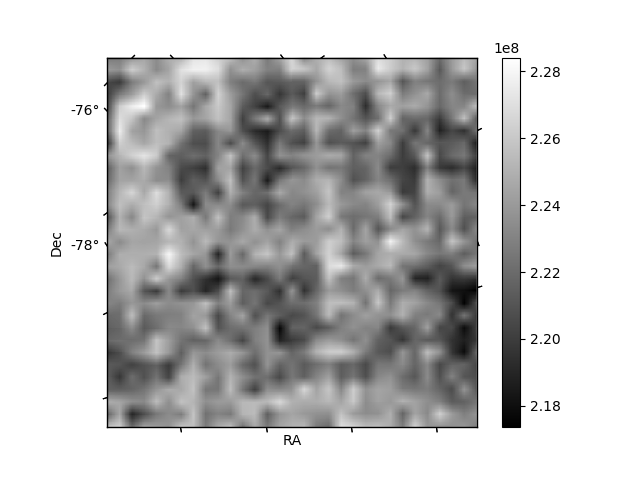
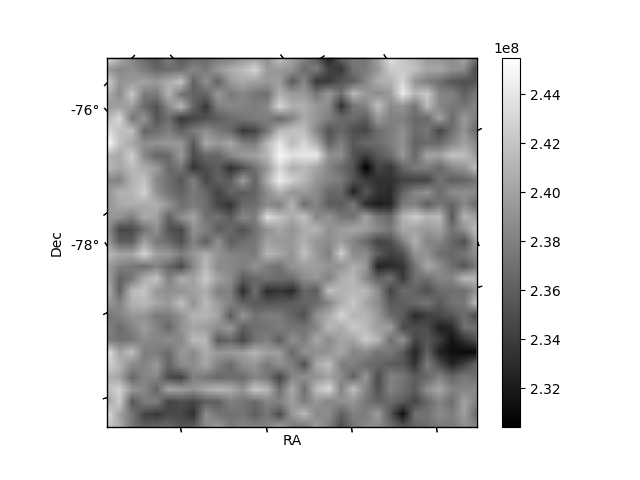
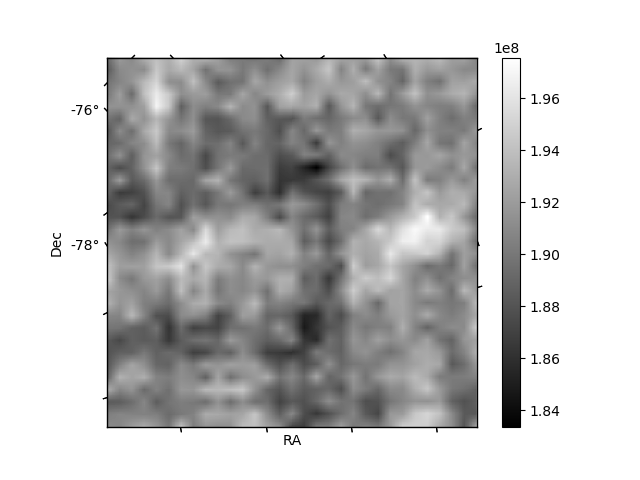
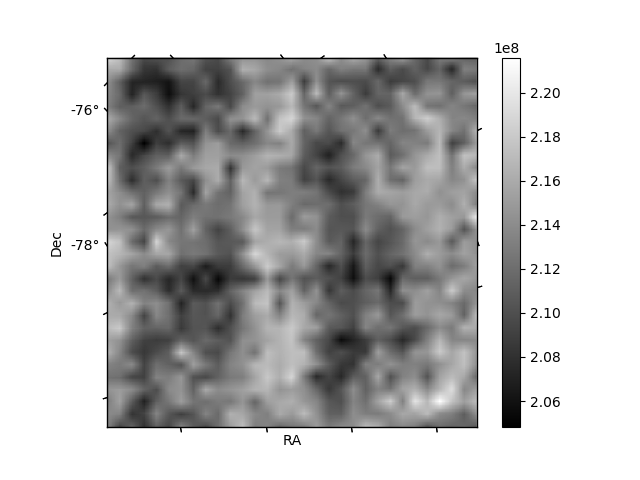
Histogram calculated using DETX and DETY for each event in the final _common_clean file
| Quadrant A | 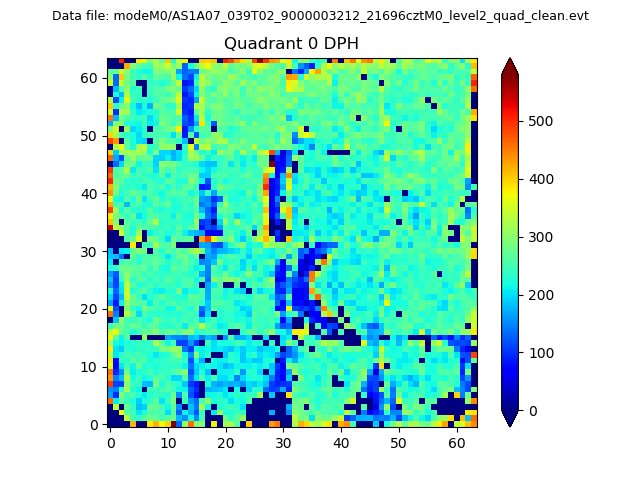 |
 |
Quadrant B |
|---|---|---|---|
| Quadrant D | 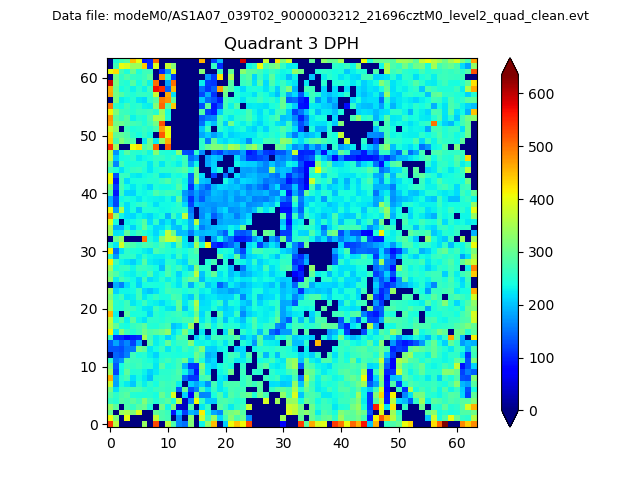 |
 |
Quadrant C |
| Plot type | Count rate plots | Images |
|---|---|---|
| Comparison with Poisson distribution Blue bars denote a histogram of data divided into 1 sec bins. Red curve is a Poisson curve with rate = median count rate of data. |
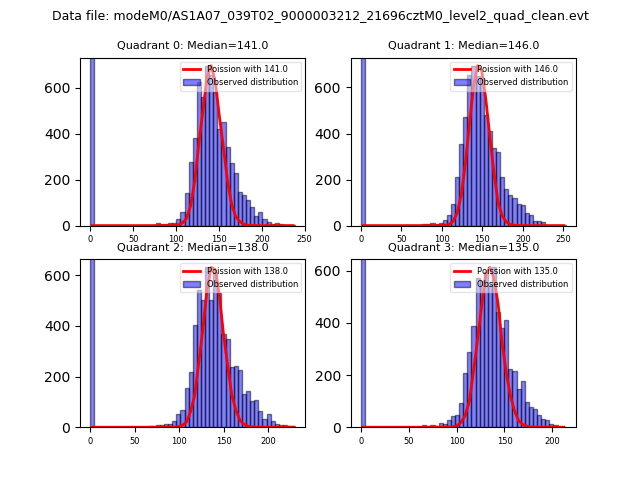 |
 |
| Quadrant-wise count rates Data is divided into 100 sec bins |
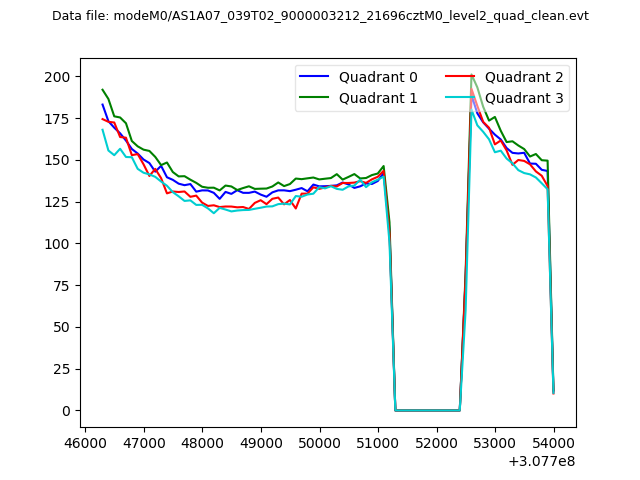 |
|
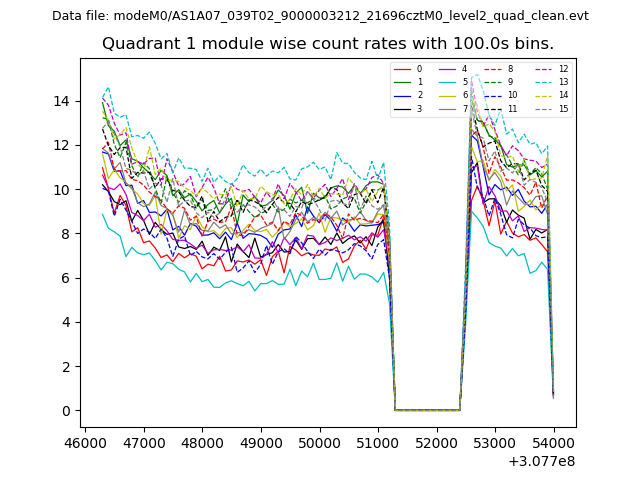
| Module-wise count rates for Quadrant A Data is divided into 100 sec bins |
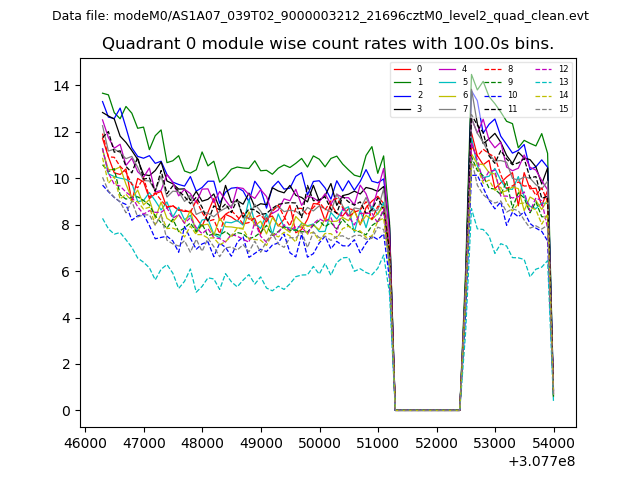 |
 |
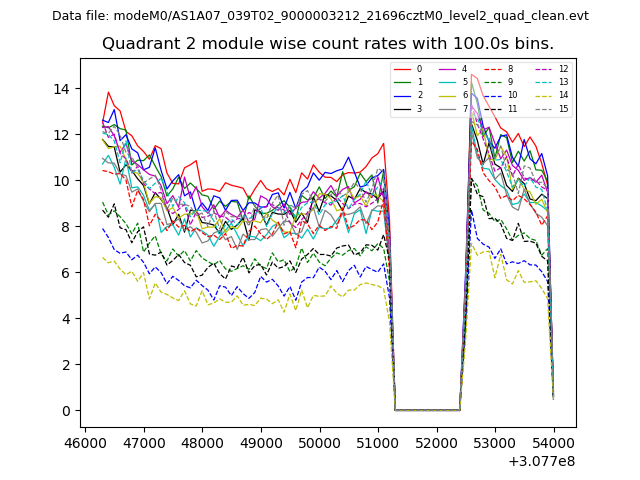
| Module-wise count rates for Quadrant B Data is divided into 100 sec bins |
 |
 |
| Module-wise count rates for Quadrant C Data is divided into 100 sec bins |
 |
 |
| Module-wise count rates for Quadrant D Data is divided into 100 sec bins |
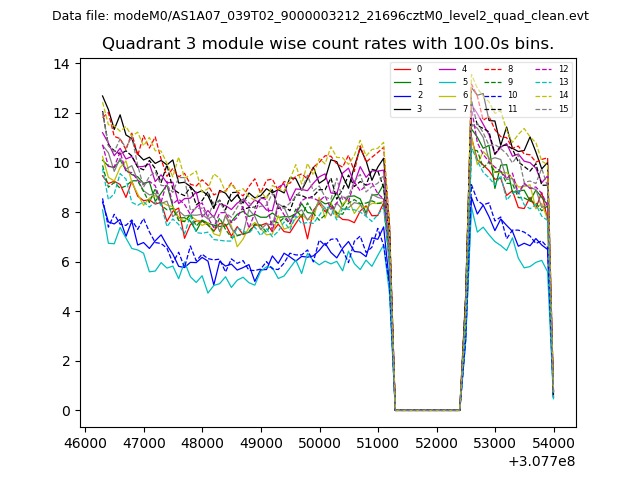 |
 |
| Parameter | Plot |
|---|---|
| CZT HV Monitor | 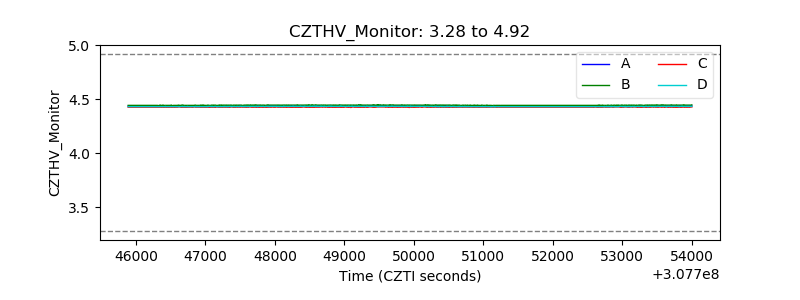 |
| D_VDD | 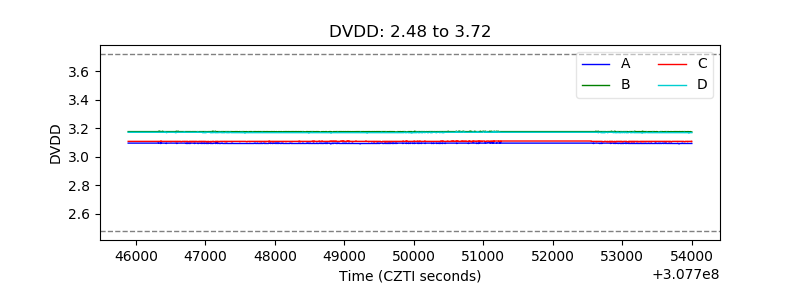 |
| Temperature 1 | 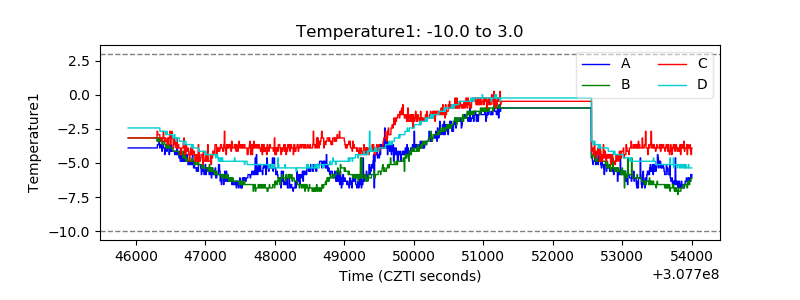 |
| Veto HV Monitor |  |
| Veto LLD | 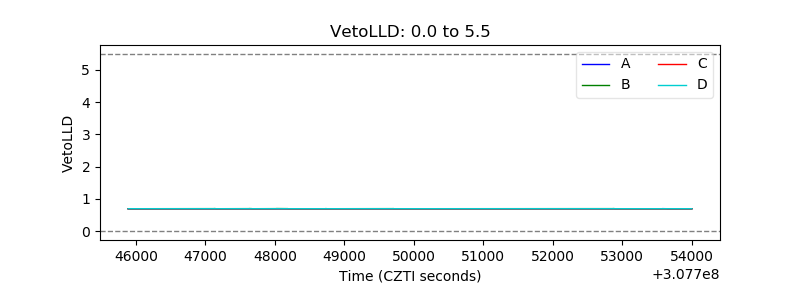 |
| Alpha Counter | 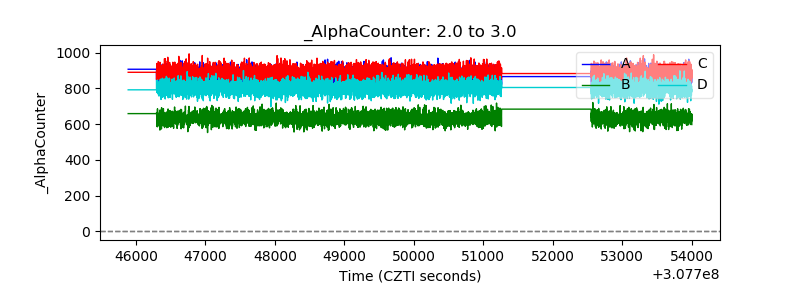 |
| _CPM_Rate | 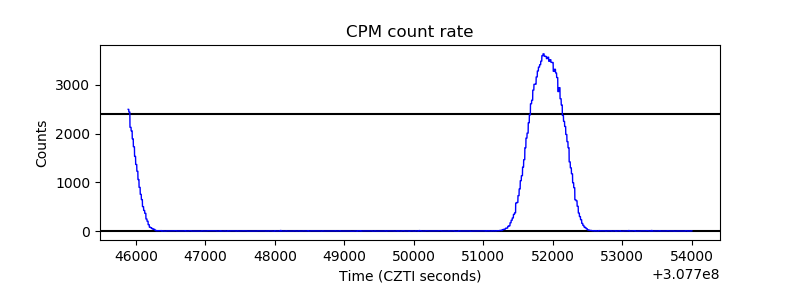 |
| CZT Counter | 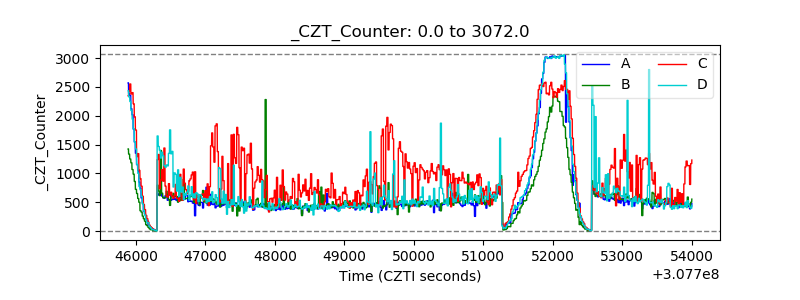 |
| +2.5 Volts monitor |  |
| +5 Volts monitor | 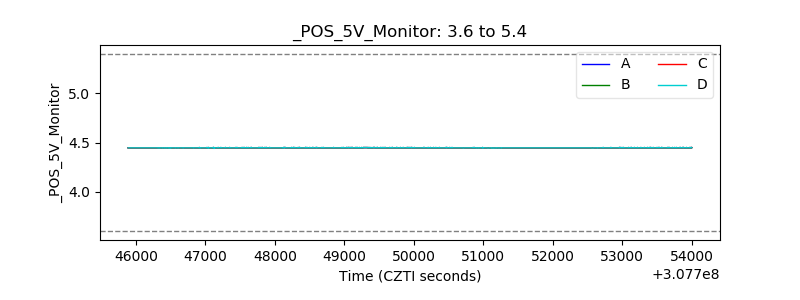 |
| _ROLL_ROT | 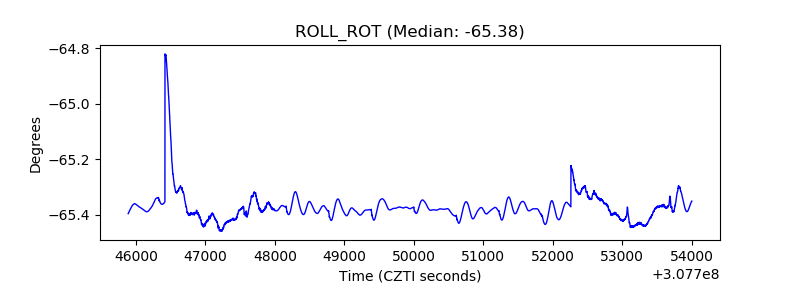 |
| _Roll_DEC | 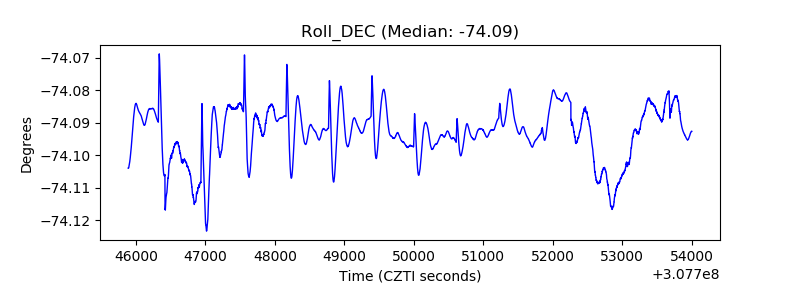 |
| _Roll_RA | 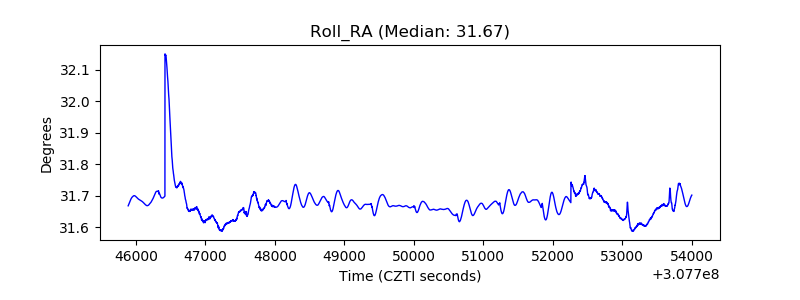 |
| Veto Counter | 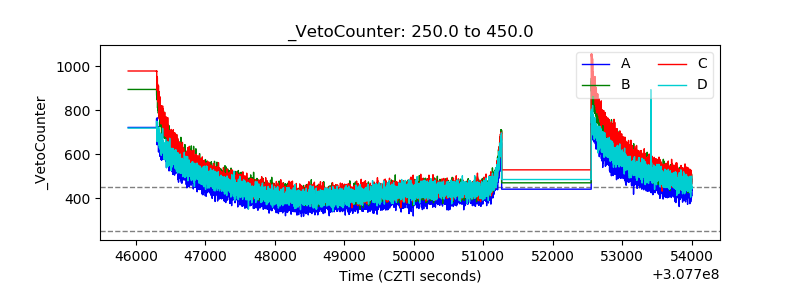 |