| Param | Original file | Final file |
|---|---|---|
| Filename | modeM0/AS1A07_039T02_9000003212_21698cztM0_level2.evt | modeM0/AS1A07_039T02_9000003212_21698cztM0_level2_quad_clean.evt |
| Size (bytes) | 524,903,040 | 135,262,080 |
| Size | 500.6 MB | 129.0 MB |
| Events in quadrant A | 3,111,174 | 915,670 |
| Events in quadrant B | 3,408,318 | 953,911 |
| Events in quadrant C | 5,156,145 | 907,665 |
| Events in quadrant D | 3,792,848 | 878,498 |
| Mode M0 | |||
|---|---|---|---|
| Quadrant | BADHDUFLAG | Total packets | Discarded packets |
| A | 0 | 13120 | 1 |
| B | 0 | 13973 | 1 |
| C | 0 | 19587 | 1 |
| D | 0 | 15497 | 1 |
| Mode SS | |||
|---|---|---|---|
| Quadrant | BADHDUFLAG | Total packets | Discarded packets |
| A | 0 | 128 | 0 |
| B | 0 | 128 | 0 |
| C | 0 | 128 | 0 |
| D | 0 | 128 | 0 |
| Mode M9 | |||
|---|---|---|---|
| Quadrant | BADHDUFLAG | Total packets | Discarded packets |
| A | 0 | 13 | 0 |
| B | 0 | 13 | 0 |
| C | 0 | 13 | 0 |
| D | 0 | 13 | 0 |
| Quadrant | Total seconds | Saturated seconds | Saturation percentage |
|---|---|---|---|
| A | 6322 | 34 | 0.537804% |
| B | 6322 | 91 | 1.439418% |
| C | 6323 | 265 | 4.191049% |
| D | 6323 | 110 | 1.739681% |
Noise dominated data is calculated using 1-second bins in cleaned event files. If a bin has >2000 counts, and if more than 50% of those come from <1% of pixels, then it is considered to be noise-dominated and hence unusable.
| Quadrant | # 1 sec bins | Bins with >0 counts | Bins with >2000 counts | High rate bins dominated by noise | Noise dominated (total time) | Noise dominated (detector-on time) | Marked lightcurve |
|---|---|---|---|---|---|---|---|
| A | 7632 | 6323 | 0 | 0 | 0.00% | 0.00% | 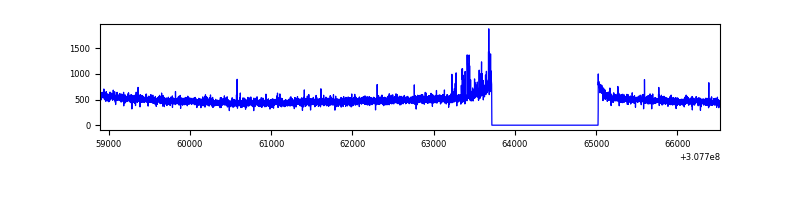 |
| B | 7632 | 6323 | 16 | 16 | 0.21% | 0.25% | 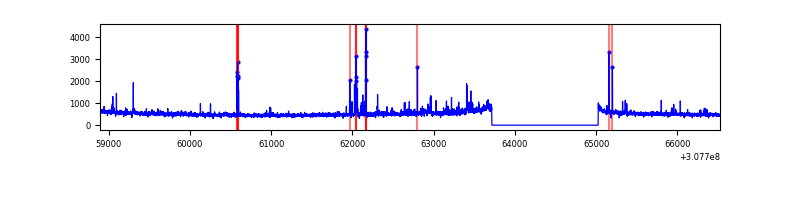 |
| C | 7633 | 6324 | 11 | 11 | 0.14% | 0.17% | 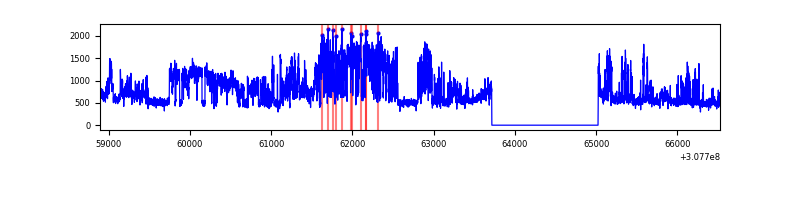 |
| D | 7633 | 6324 | 52 | 52 | 0.68% | 0.82% | 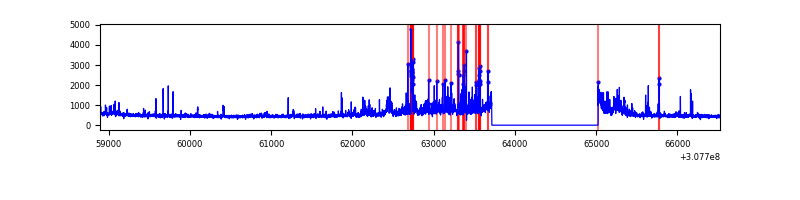 |
Top three noisy pixels from each quadrant. If the there are fewer than three noisy pixels in the level2.evt file, extra rows are filled as -1
| Pixel properties | Quadrant properties | ||||||
|---|---|---|---|---|---|---|---|
| Quadrant | DetID | PixID | Counts | Sigma | Mean | Median | Sigma |
| A | 5 | 16 | 39775 | 246.97 | 794 | 779 | 157.9 |
| A | 13 | 254 | 11851 | 70.12 | 794 | 779 | 157.9 |
| A | 15 | 236 | 8334 | 47.85 | 794 | 779 | 157.9 |
| B | 3 | 64 | 109335 | 735.23 | 808 | 790 | 147.6 |
| B | 0 | 229 | 61202 | 409.2 | 808 | 790 | 147.6 |
| B | 0 | 189 | 33251 | 219.87 | 808 | 790 | 147.6 |
| C | 8 | 208 | 1955697 | 10813.09 | 787 | 794 | 180.8 |
| C | 14 | 238 | 126241 | 693.88 | 787 | 794 | 180.8 |
| C | 13 | 61 | 5493 | 25.99 | 787 | 794 | 180.8 |
| D | 12 | 235 | 434179 | 2323.84 | 782 | 761 | 186.5 |
| D | 14 | 35 | 138627 | 739.19 | 782 | 761 | 186.5 |
| D | 7 | 238 | 125818 | 670.51 | 782 | 761 | 186.5 |
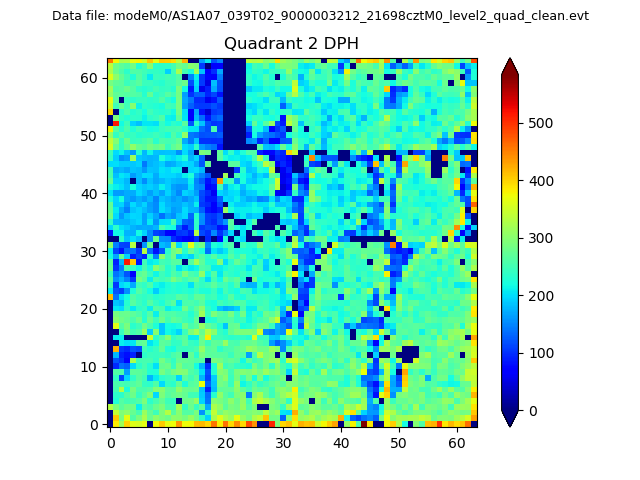
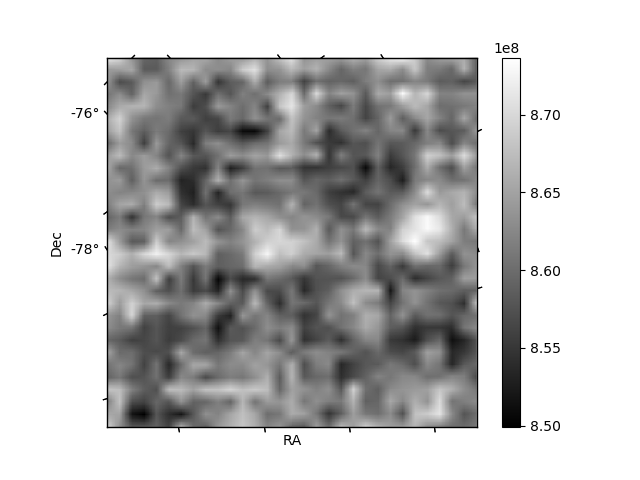
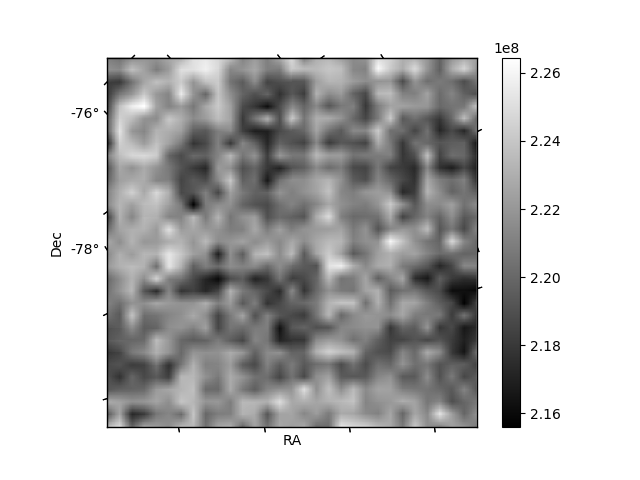
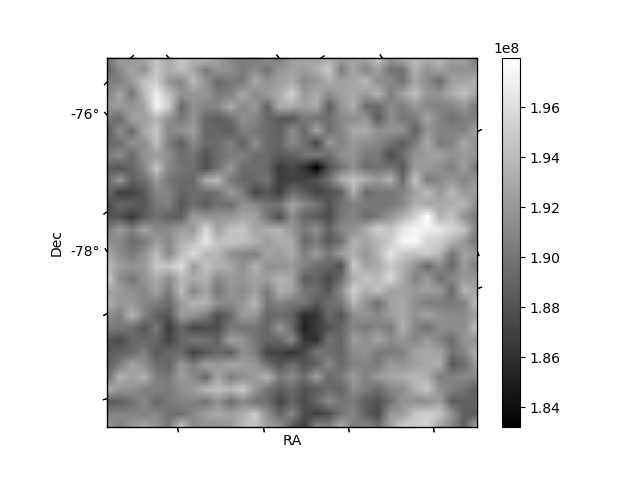
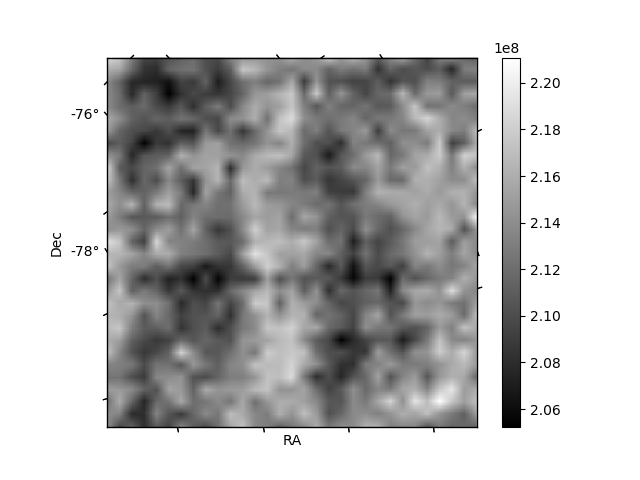
Histogram calculated using DETX and DETY for each event in the final _common_clean file
| Quadrant A | 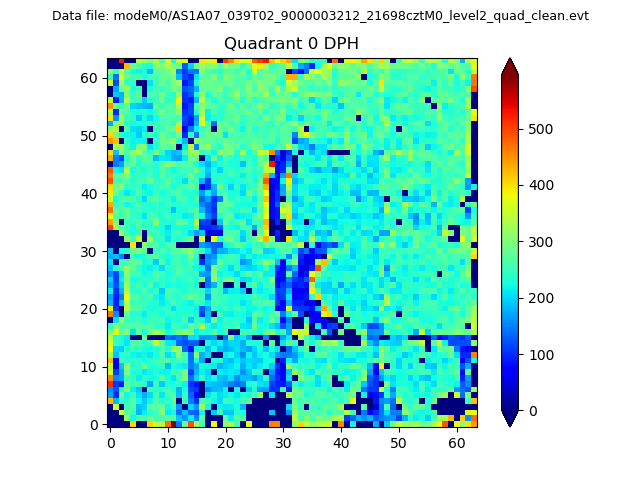 |
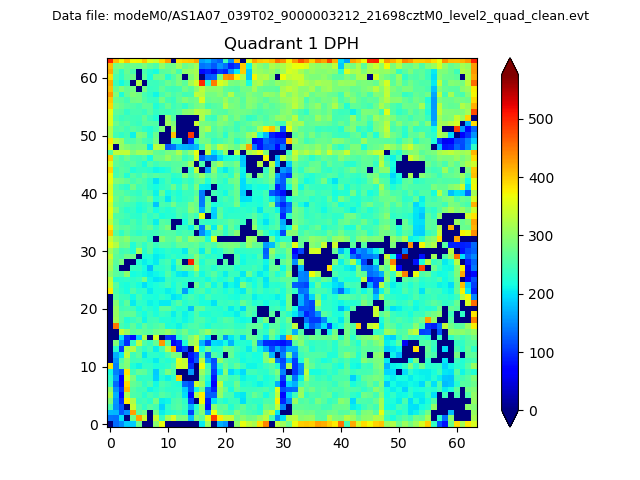 |
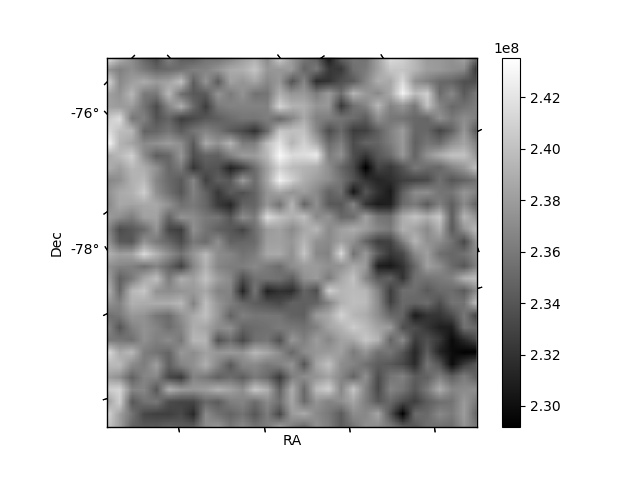
Quadrant B |
|---|---|---|---|
| Quadrant D | 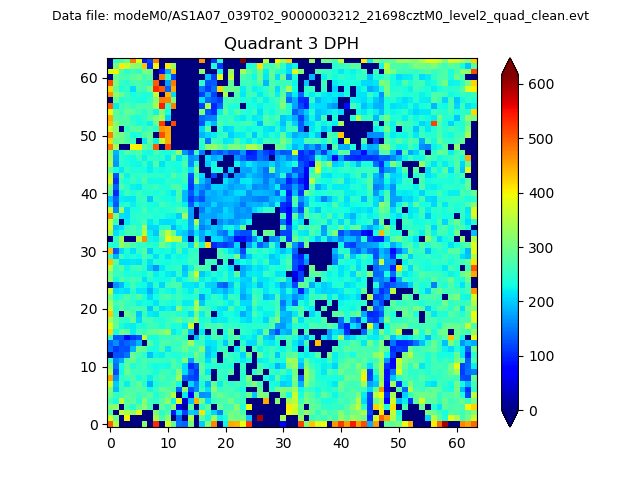 |
 |
Quadrant C |
| Plot type | Count rate plots | Images |
|---|---|---|
| Comparison with Poisson distribution Blue bars denote a histogram of data divided into 1 sec bins. Red curve is a Poisson curve with rate = median count rate of data. |
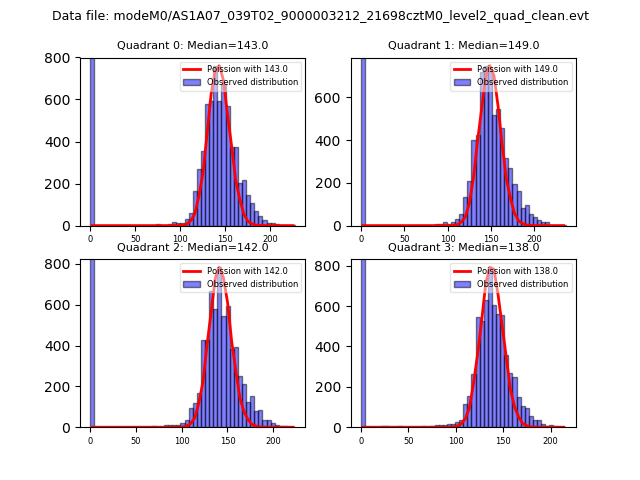 |
 |
| Quadrant-wise count rates Data is divided into 100 sec bins |
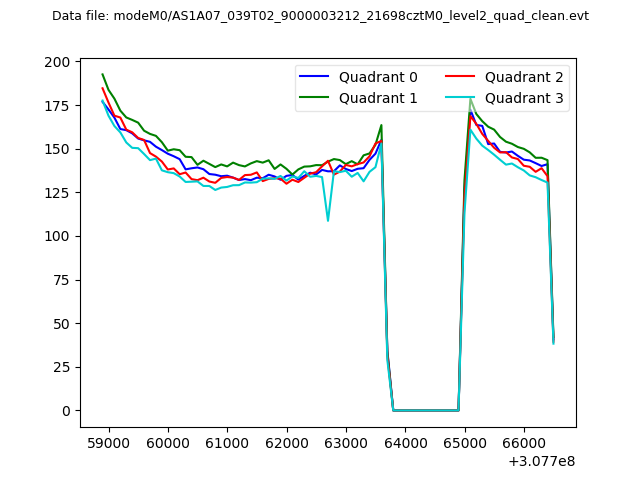 |
|
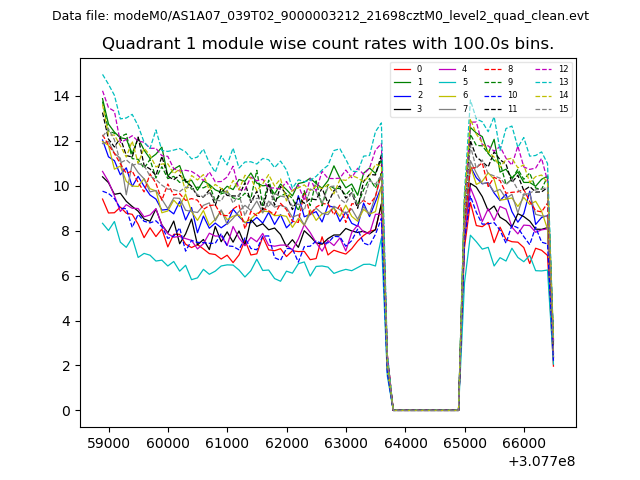
| Module-wise count rates for Quadrant A Data is divided into 100 sec bins |
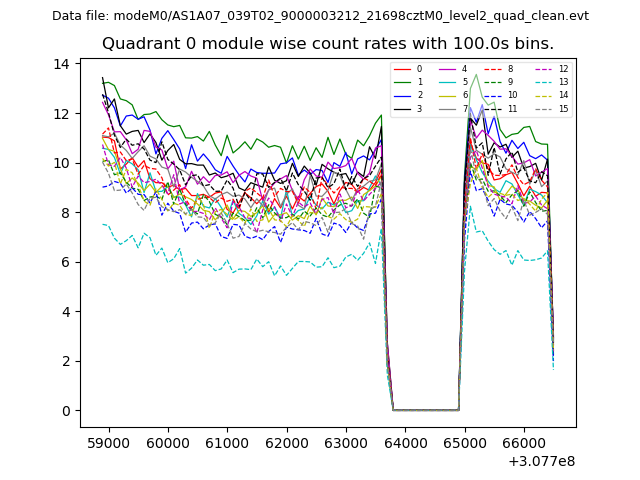 |
 |
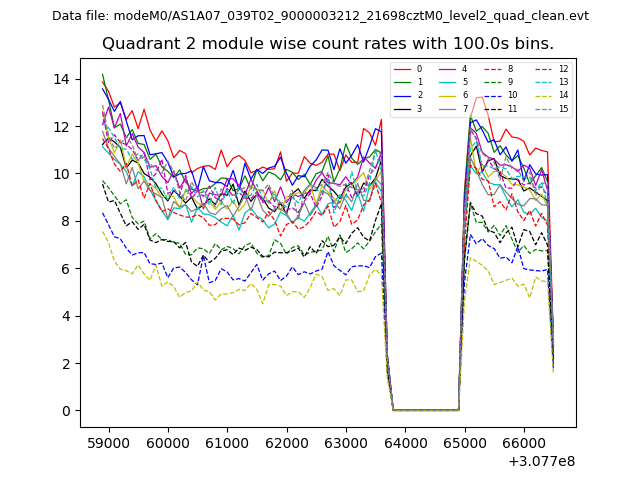
| Module-wise count rates for Quadrant B Data is divided into 100 sec bins |
 |
 |
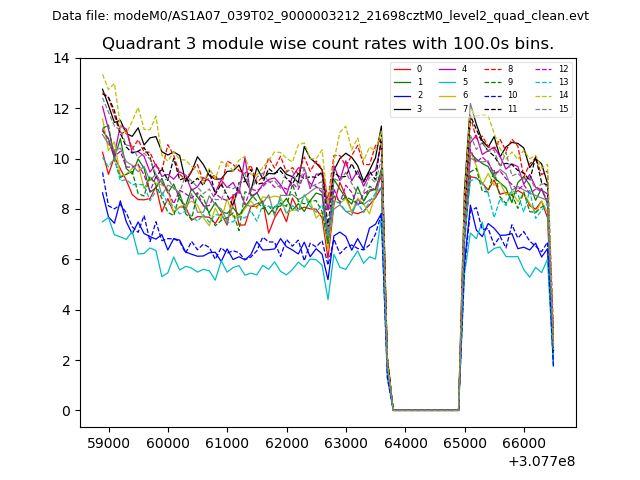
| Module-wise count rates for Quadrant C Data is divided into 100 sec bins |
 |
 |
| Module-wise count rates for Quadrant D Data is divided into 100 sec bins |
 |
 |
| Parameter | Plot |
|---|---|
| CZT HV Monitor | 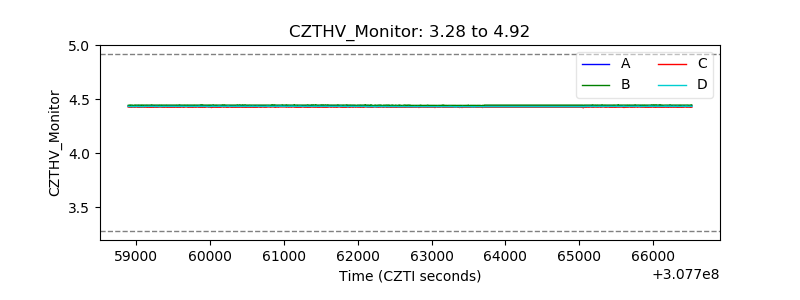 |
| D_VDD | 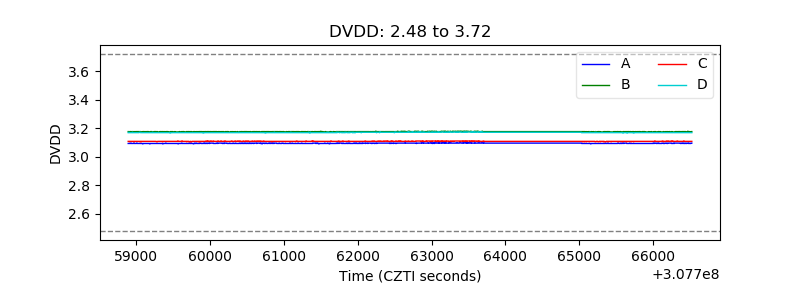 |
| Temperature 1 | 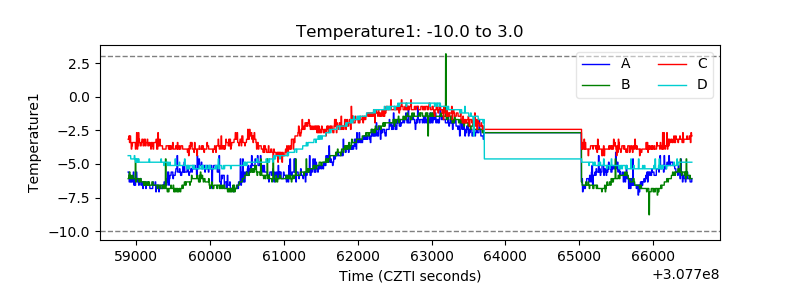 |
| Veto HV Monitor | 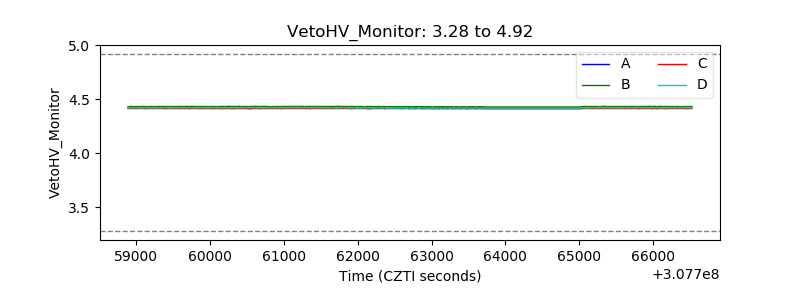 |
| Veto LLD | 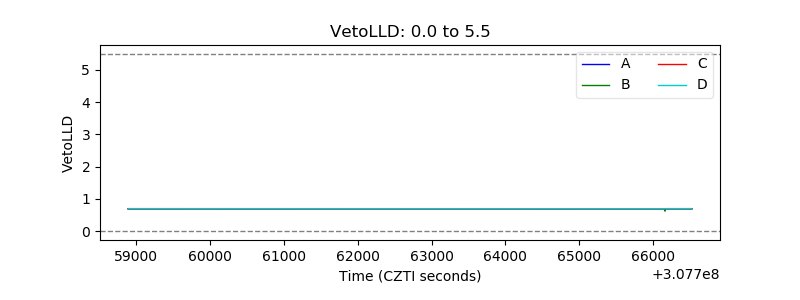 |
| Alpha Counter | 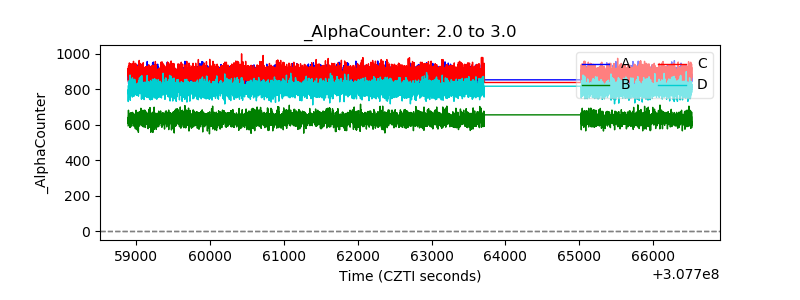 |
| _CPM_Rate | 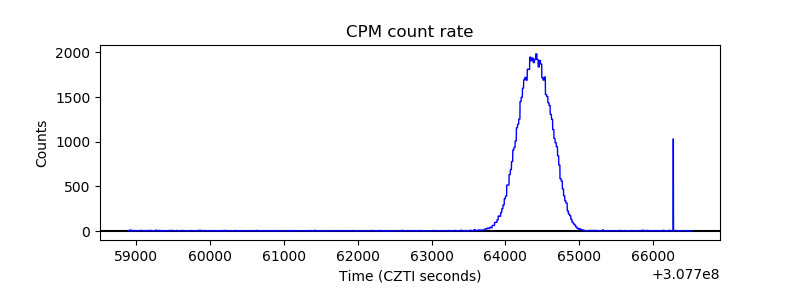 |
| CZT Counter | 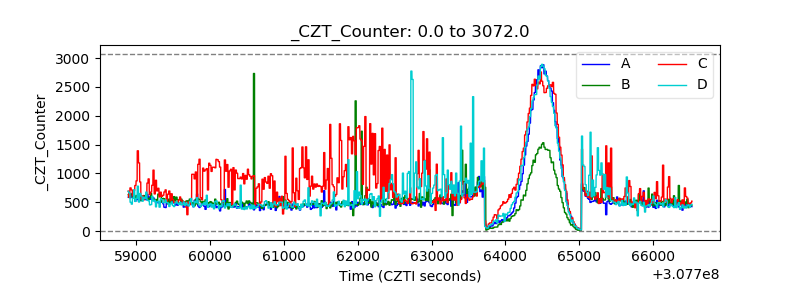 |
| +2.5 Volts monitor | 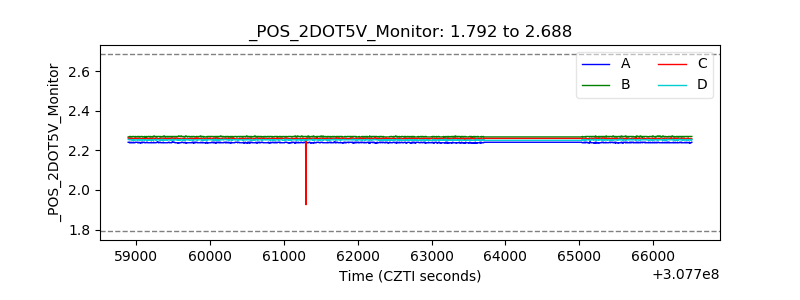 |
| +5 Volts monitor |  |
| _ROLL_ROT | 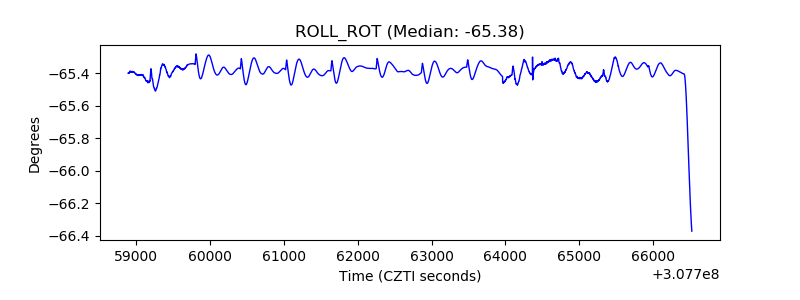 |
| _Roll_DEC | 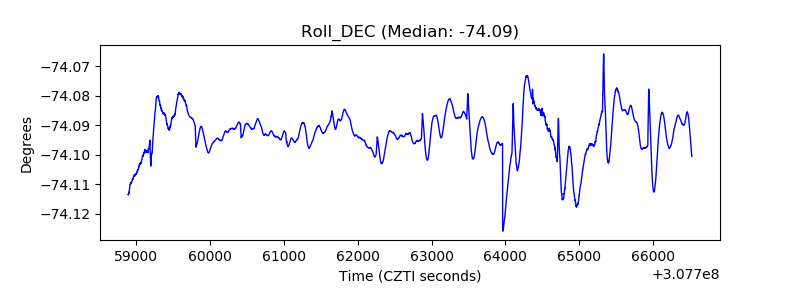 |
| _Roll_RA |  |
| Veto Counter | 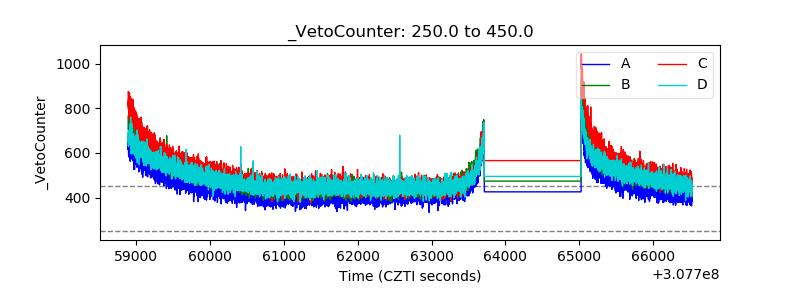 |