| Param | Original file | Final file |
|---|---|---|
| Filename | modeM0/AS1A07_039T02_9000003212_21699cztM0_level2.evt | modeM0/AS1A07_039T02_9000003212_21699cztM0_level2_quad_clean.evt |
| Size (bytes) | 588,781,440 | 133,603,200 |
| Size | 561.5 MB | 127.4 MB |
| Events in quadrant A | 4,778,308 | 866,076 |
| Events in quadrant B | 3,340,571 | 950,651 |
| Events in quadrant C | 5,219,710 | 895,250 |
| Events in quadrant D | 4,047,293 | 875,950 |
| Mode M0 | |||
|---|---|---|---|
| Quadrant | BADHDUFLAG | Total packets | Discarded packets |
| A | 0 | 18518 | 2 |
| B | 0 | 13881 | 2 |
| C | 0 | 19653 | 2 |
| D | 0 | 16334 | 2 |
| Mode SS | |||
|---|---|---|---|
| Quadrant | BADHDUFLAG | Total packets | Discarded packets |
| A | 0 | 134 | 0 |
| B | 0 | 134 | 0 |
| C | 0 | 134 | 0 |
| D | 0 | 134 | 0 |
| Mode M9 | |||
|---|---|---|---|
| Quadrant | BADHDUFLAG | Total packets | Discarded packets |
| A | 0 | 14 | 0 |
| B | 0 | 15 | 0 |
| C | 0 | 15 | 0 |
| D | 0 | 15 | 0 |
| Quadrant | Total seconds | Saturated seconds | Saturation percentage |
|---|---|---|---|
| A | 6569 | 774 | 11.782615% |
| B | 6569 | 57 | 0.867712% |
| C | 6569 | 596 | 9.072918% |
| D | 6569 | 181 | 2.755366% |
Noise dominated data is calculated using 1-second bins in cleaned event files. If a bin has >2000 counts, and if more than 50% of those come from <1% of pixels, then it is considered to be noise-dominated and hence unusable.
| Quadrant | # 1 sec bins | Bins with >0 counts | Bins with >2000 counts | High rate bins dominated by noise | Noise dominated (total time) | Noise dominated (detector-on time) | Marked lightcurve |
|---|---|---|---|---|---|---|---|
| A | 7744 | 6570 | 338 | 338 | 4.36% | 5.14% |  |
| B | 7744 | 6570 | 2 | 2 | 0.03% | 0.03% | 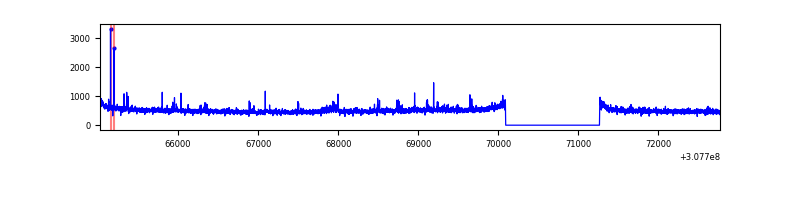 |
| C | 7744 | 6570 | 312 | 312 | 4.03% | 4.75% | 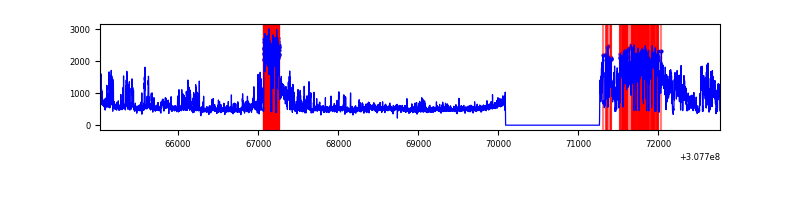 |
| D | 7744 | 6570 | 55 | 55 | 0.71% | 0.84% | 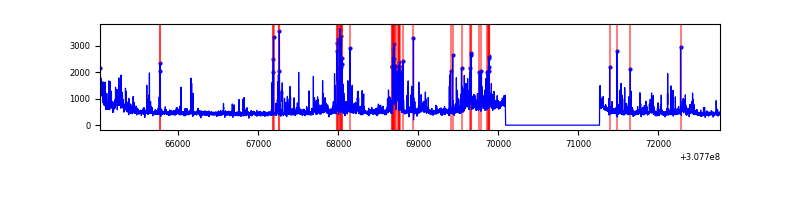 |
Top three noisy pixels from each quadrant. If the there are fewer than three noisy pixels in the level2.evt file, extra rows are filled as -1
| Pixel properties | Quadrant properties | ||||||
|---|---|---|---|---|---|---|---|
| Quadrant | DetID | PixID | Counts | Sigma | Mean | Median | Sigma |
| A | 5 | 89 | 940042 | 6153.8 | 769 | 755 | 152.6 |
| A | 5 | 105 | 387342 | 2532.75 | 769 | 755 | 152.6 |
| A | 5 | 73 | 306919 | 2005.85 | 769 | 755 | 152.6 |
| B | 0 | 229 | 43272 | 279.06 | 820 | 798 | 152.2 |
| B | 3 | 64 | 33245 | 213.18 | 820 | 798 | 152.2 |
| B | 0 | 230 | 32841 | 210.53 | 820 | 798 | 152.2 |
| C | 8 | 208 | 1993085 | 10839.45 | 791 | 797 | 183.8 |
| C | 14 | 238 | 125772 | 679.95 | 791 | 797 | 183.8 |
| C | 10 | 23 | 11681 | 59.22 | 791 | 797 | 183.8 |
| D | 12 | 235 | 541475 | 2842.01 | 795 | 771 | 190.3 |
| D | 7 | 238 | 227667 | 1192.59 | 795 | 771 | 190.3 |
| D | 14 | 35 | 80497 | 419.05 | 795 | 771 | 190.3 |
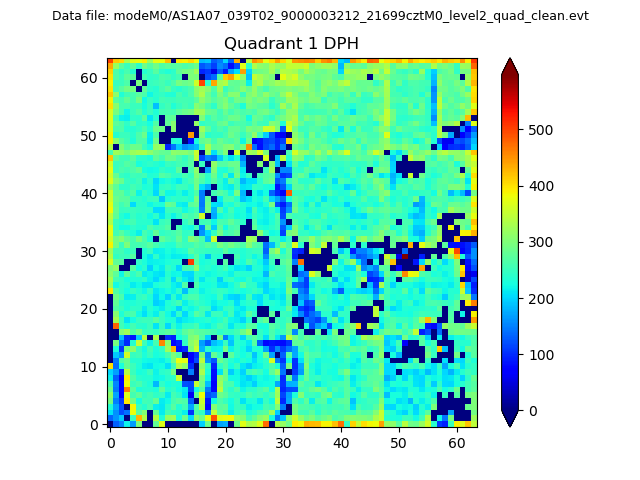
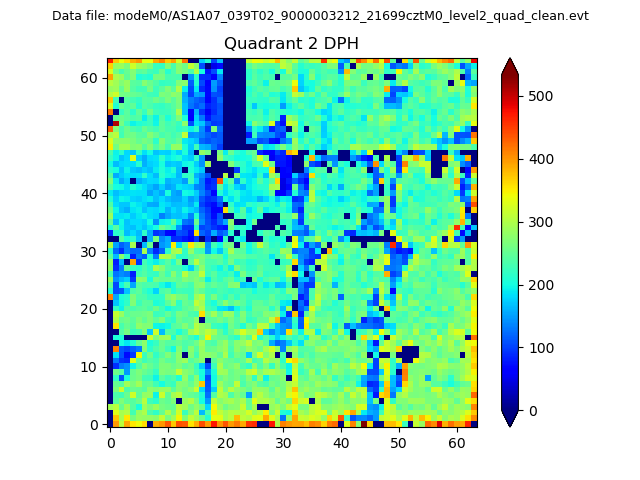
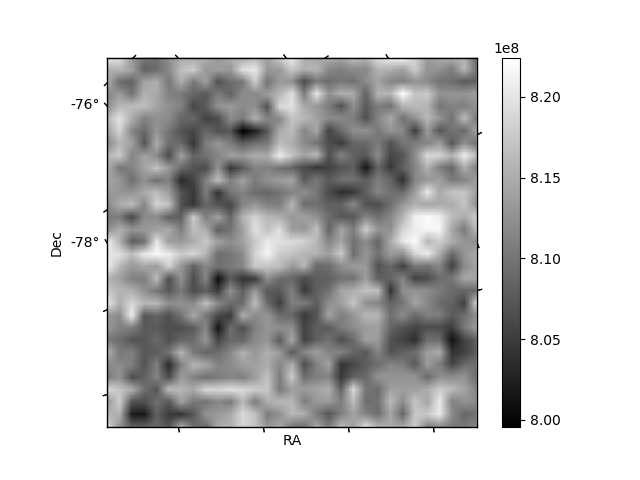
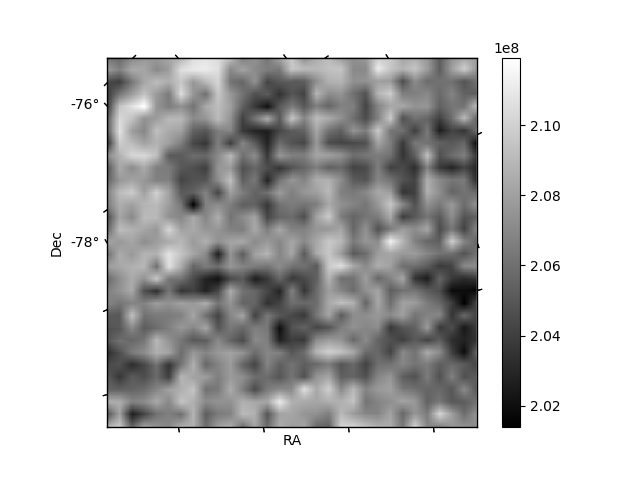
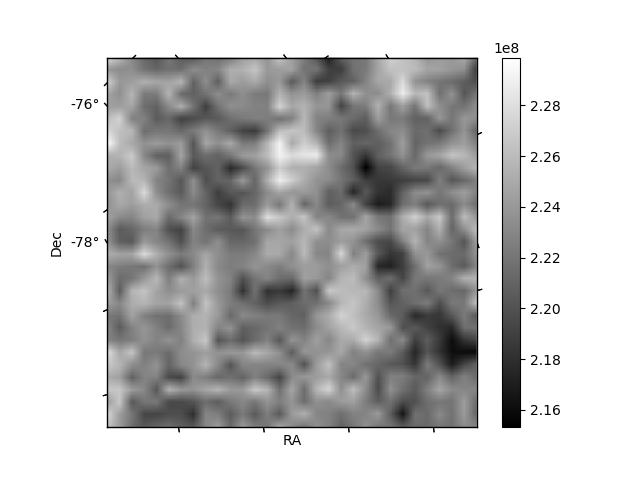
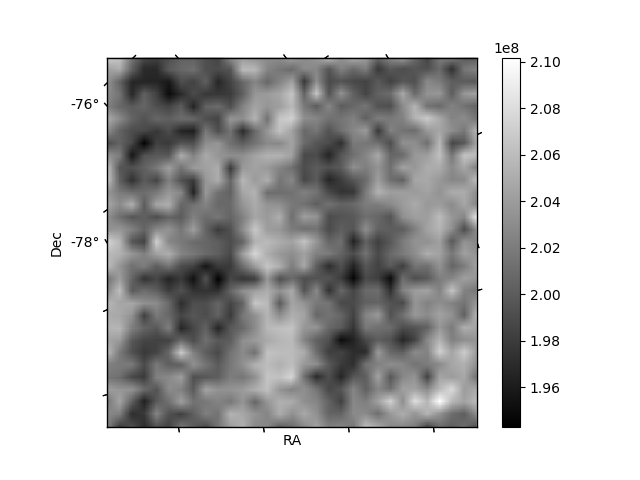
Histogram calculated using DETX and DETY for each event in the final _common_clean file
| Quadrant A | 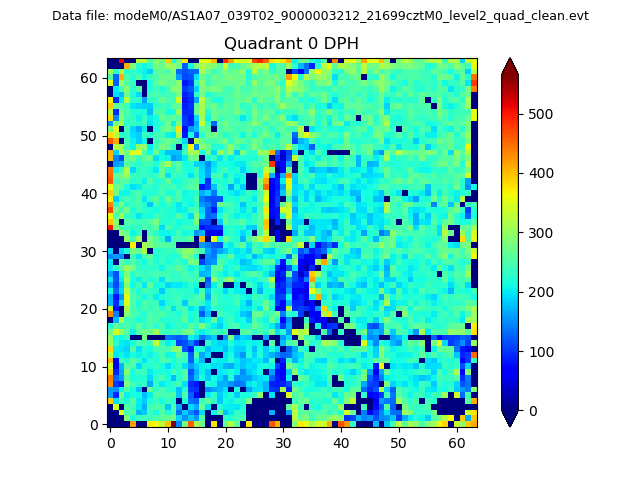 |
 |
Quadrant B |
|---|---|---|---|
| Quadrant D | 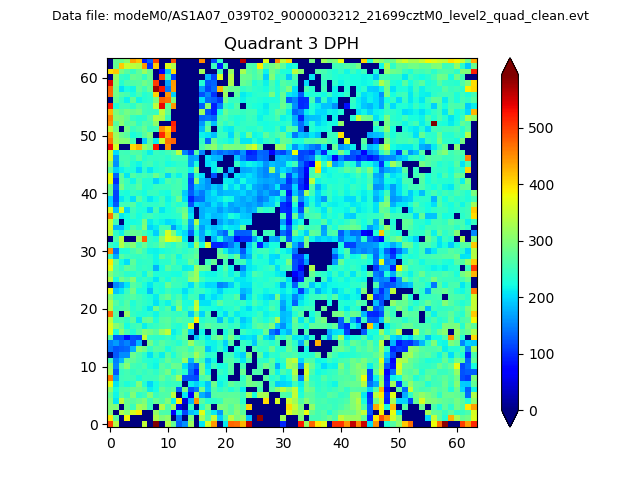 |
 |
Quadrant C |
| Plot type | Count rate plots | Images |
|---|---|---|
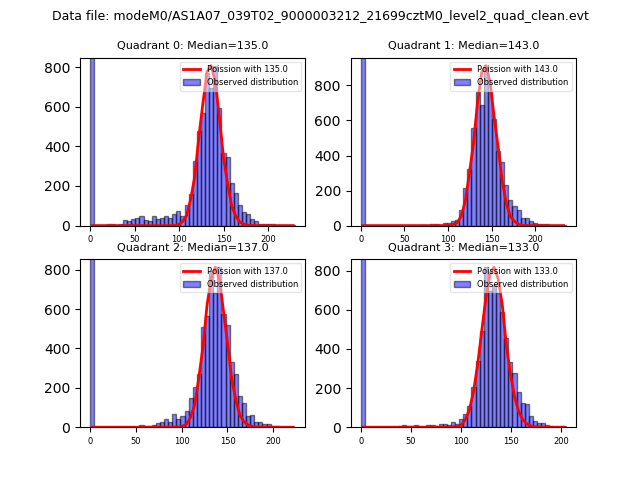
| Comparison with Poisson distribution Blue bars denote a histogram of data divided into 1 sec bins. Red curve is a Poisson curve with rate = median count rate of data. |
 |
 |
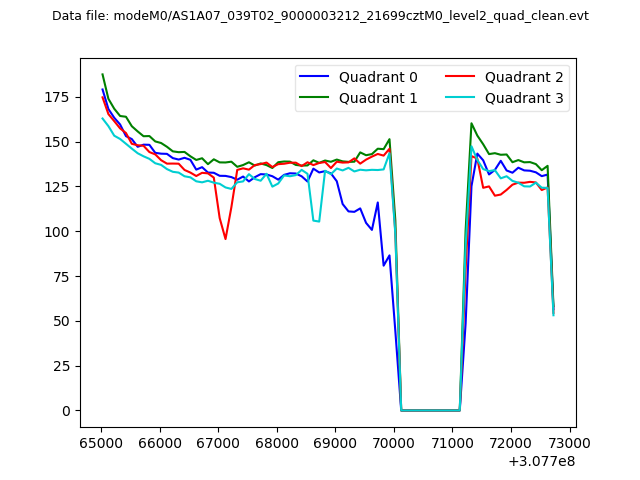
| Quadrant-wise count rates Data is divided into 100 sec bins |
 |
|
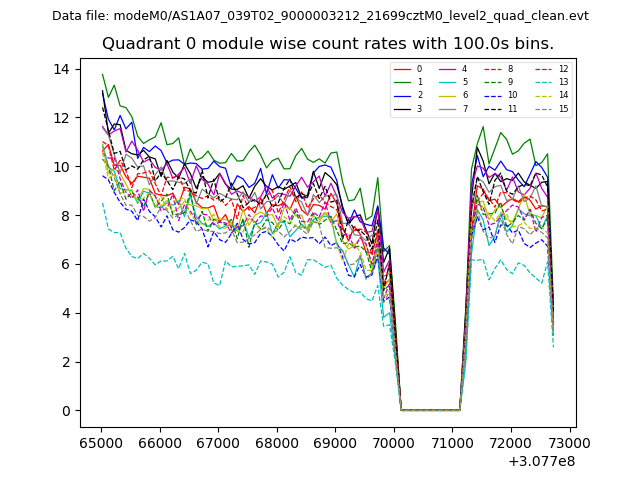
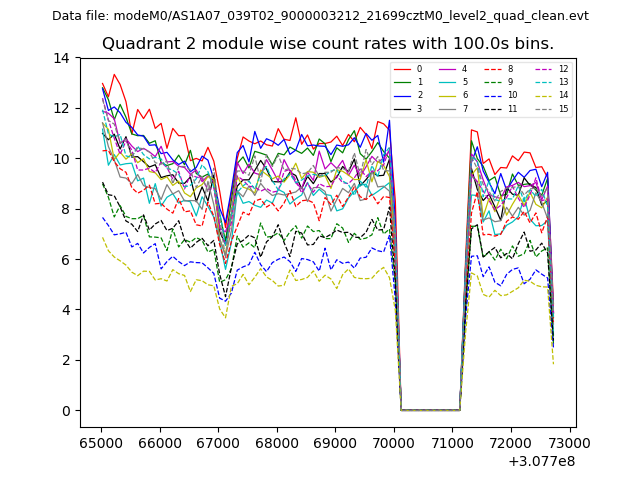
| Module-wise count rates for Quadrant A Data is divided into 100 sec bins |
 |
 |
| Module-wise count rates for Quadrant B Data is divided into 100 sec bins |
 |
 |
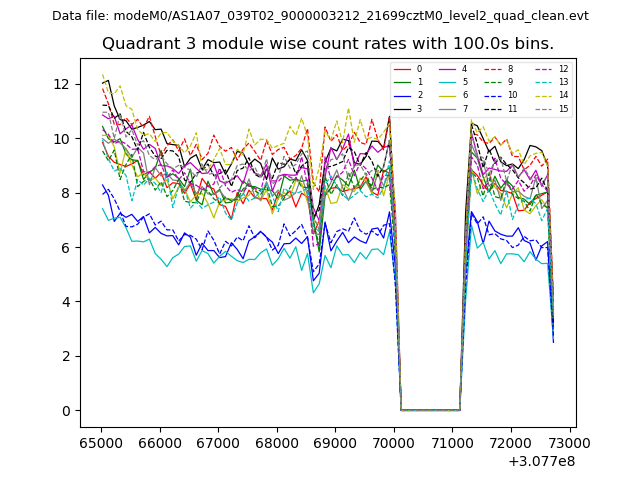
| Module-wise count rates for Quadrant C Data is divided into 100 sec bins |
 |
 |
| Module-wise count rates for Quadrant D Data is divided into 100 sec bins |
 |
 |
| Parameter | Plot |
|---|---|
| CZT HV Monitor | 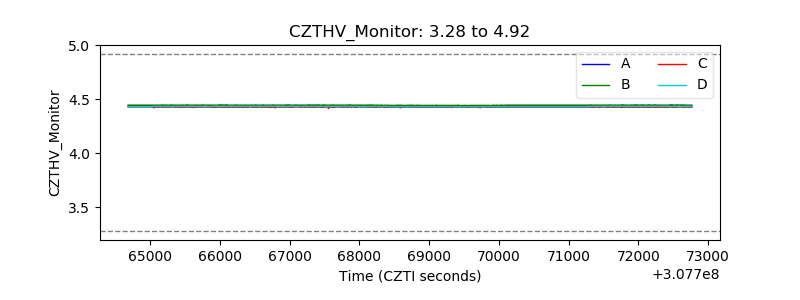 |
| D_VDD | 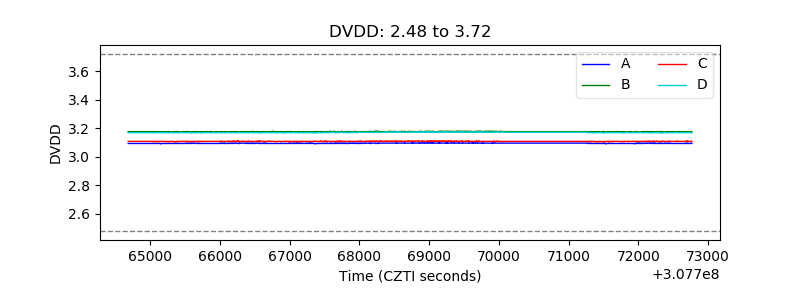 |
| Temperature 1 | 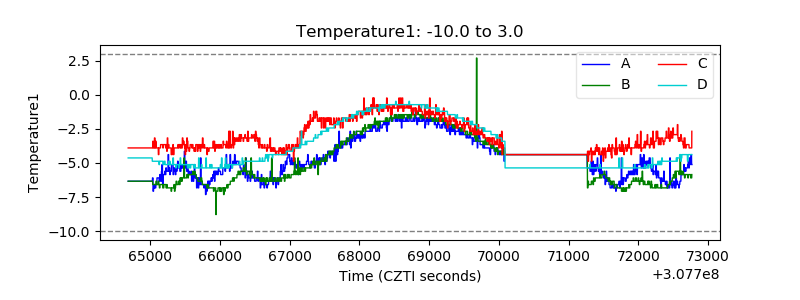 |
| Veto HV Monitor | 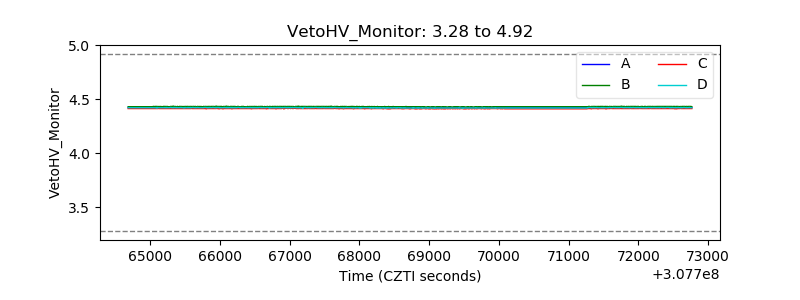 |
| Veto LLD | 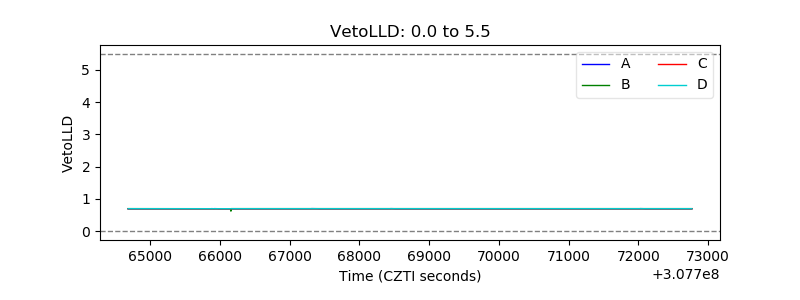 |
| Alpha Counter | 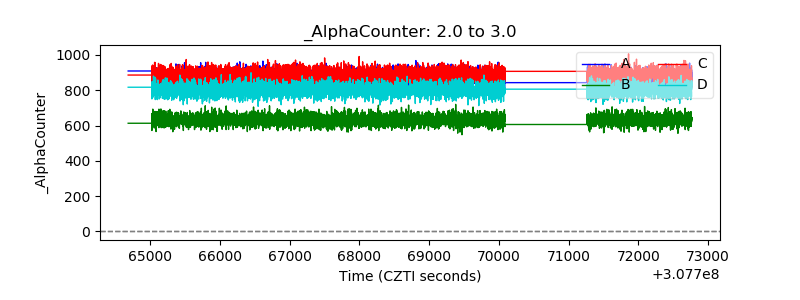 |
| _CPM_Rate | 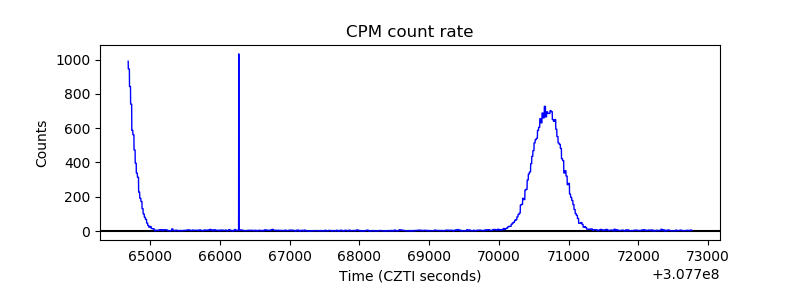 |
| CZT Counter | 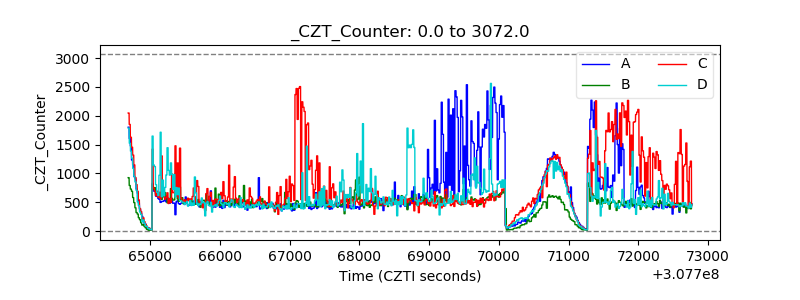 |
| +2.5 Volts monitor |  |
| +5 Volts monitor |  |
| _ROLL_ROT |  |
| _Roll_DEC |  |
| _Roll_RA | 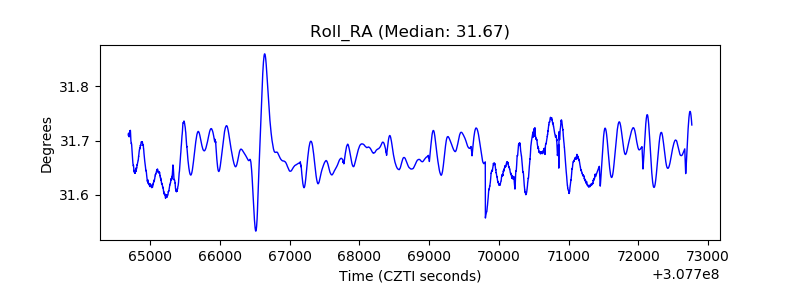 |
| Veto Counter | 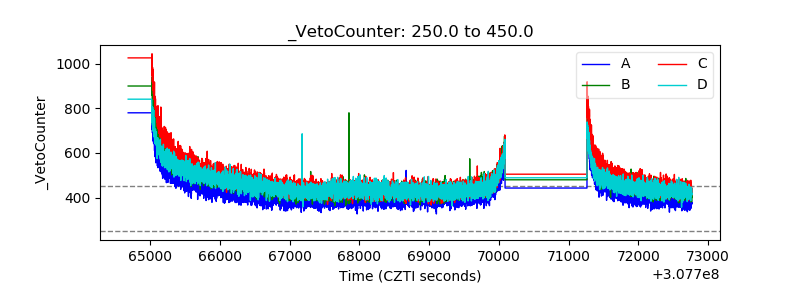 |