| Param | Original file | Final file |
|---|---|---|
| Filename | modeM0/AS1A07_039T02_9000003212_21702cztM0_level2.evt | modeM0/AS1A07_039T02_9000003212_21702cztM0_level2_quad_clean.evt |
| Size (bytes) | 660,720,960 | 130,835,520 |
| Size | 630.1 MB | 124.8 MB |
| Events in quadrant A | 3,279,177 | 881,005 |
| Events in quadrant B | 3,838,633 | 899,280 |
| Events in quadrant C | 8,807,032 | 823,601 |
| Events in quadrant D | 3,602,562 | 861,663 |
| Mode M0 | |||
|---|---|---|---|
| Quadrant | BADHDUFLAG | Total packets | Discarded packets |
| A | 0 | 14656 | 1 |
| B | 0 | 16022 | 1 |
| C | 0 | 31114 | 1 |
| D | 0 | 15457 | 1 |
| Mode SS | |||
|---|---|---|---|
| Quadrant | BADHDUFLAG | Total packets | Discarded packets |
| A | 0 | 144 | 0 |
| B | 0 | 144 | 0 |
| C | 0 | 144 | 0 |
| D | 0 | 144 | 0 |
| Mode M9 | |||
|---|---|---|---|
| Quadrant | BADHDUFLAG | Total packets | Discarded packets |
| A | 0 | 2 | 0 |
| B | 0 | 2 | 0 |
| C | 0 | 2 | 0 |
| D | 0 | 2 | 0 |
| Quadrant | Total seconds | Saturated seconds | Saturation percentage |
|---|---|---|---|
| A | 7127 | 228 | 3.199102% |
| B | 7128 | 331 | 4.643659% |
| C | 7128 | 1565 | 21.955668% |
| D | 7128 | 216 | 3.030303% |
Noise dominated data is calculated using 1-second bins in cleaned event files. If a bin has >2000 counts, and if more than 50% of those come from <1% of pixels, then it is considered to be noise-dominated and hence unusable.
| Quadrant | # 1 sec bins | Bins with >0 counts | Bins with >2000 counts | High rate bins dominated by noise | Noise dominated (total time) | Noise dominated (detector-on time) | Marked lightcurve |
|---|---|---|---|---|---|---|---|
| A | 7262 | 7128 | 0 | 0 | 0.00% | 0.00% | 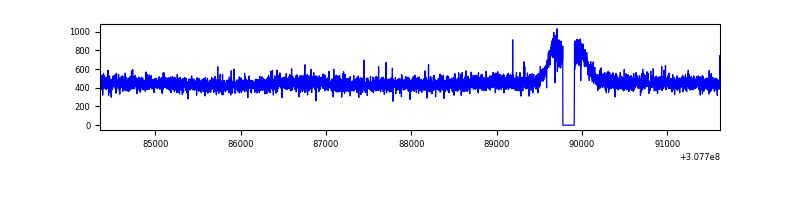 |
| B | 7263 | 7129 | 71 | 71 | 0.98% | 1.00% | 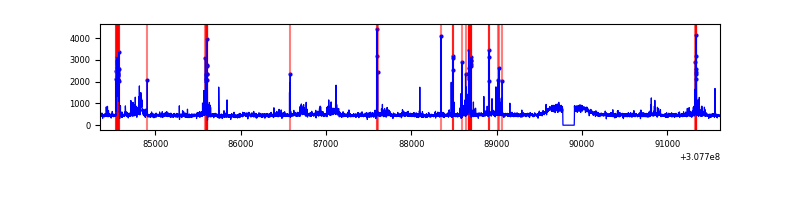 |
| C | 7263 | 7129 | 851 | 851 | 11.72% | 11.94% | 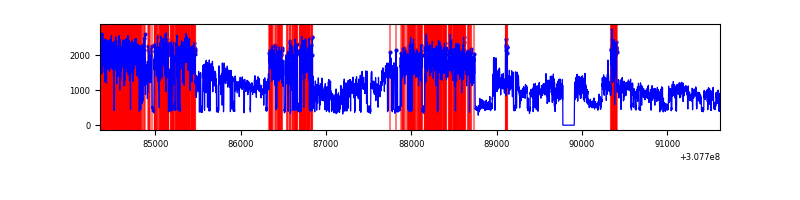 |
| D | 7263 | 7129 | 20 | 20 | 0.28% | 0.28% | 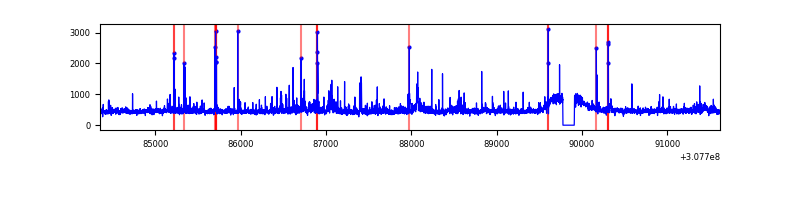 |
Top three noisy pixels from each quadrant. If the there are fewer than three noisy pixels in the level2.evt file, extra rows are filled as -1
| Pixel properties | Quadrant properties | ||||||
|---|---|---|---|---|---|---|---|
| Quadrant | DetID | PixID | Counts | Sigma | Mean | Median | Sigma |
| A | 13 | 254 | 13420 | 73.54 | 848 | 826 | 171.3 |
| A | 3 | 137 | 7202 | 37.23 | 848 | 826 | 171.3 |
| A | 0 | 226 | 7145 | 36.9 | 848 | 826 | 171.3 |
| B | 3 | 64 | 366582 | 2251.63 | 844 | 820 | 162.4 |
| B | 0 | 230 | 54958 | 333.27 | 844 | 820 | 162.4 |
| B | 0 | 229 | 47990 | 290.38 | 844 | 820 | 162.4 |
| C | 8 | 208 | 5573215 | 30084.09 | 793 | 795 | 185.2 |
| C | 14 | 238 | 123143 | 660.53 | 793 | 795 | 185.2 |
| C | 10 | 22 | 6009 | 28.15 | 793 | 795 | 185.2 |
| D | 12 | 235 | 126969 | 619.76 | 841 | 814 | 203.6 |
| D | 14 | 35 | 94659 | 461.03 | 841 | 814 | 203.6 |
| D | 2 | 136 | 67699 | 328.59 | 841 | 814 | 203.6 |
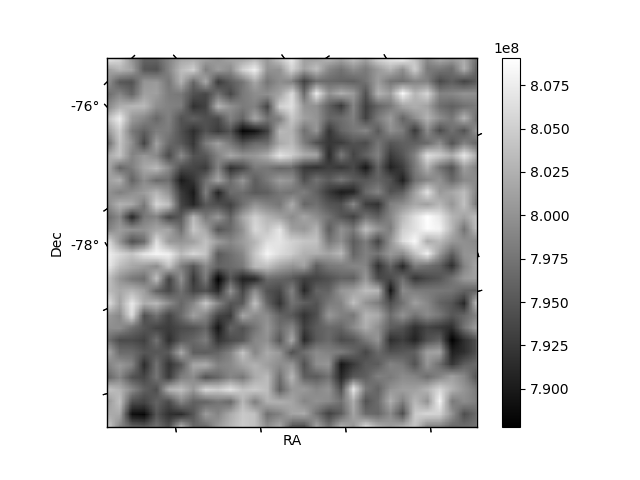
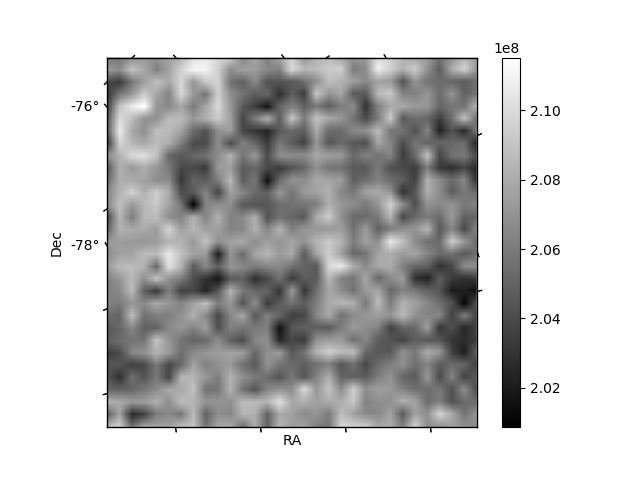
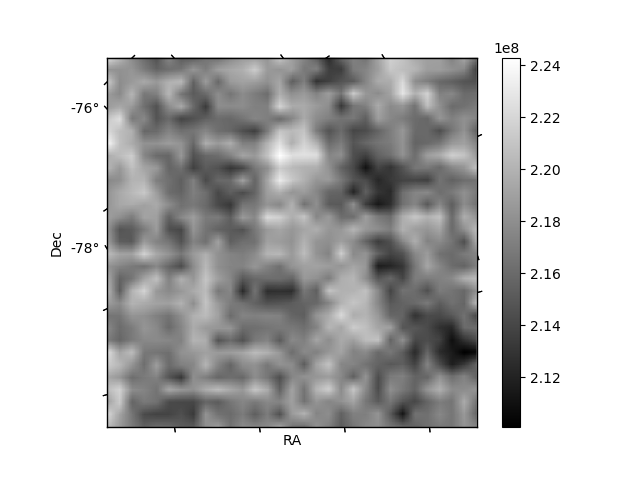
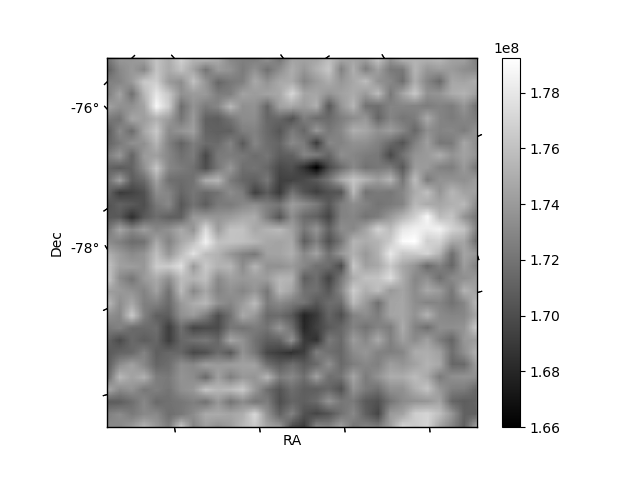
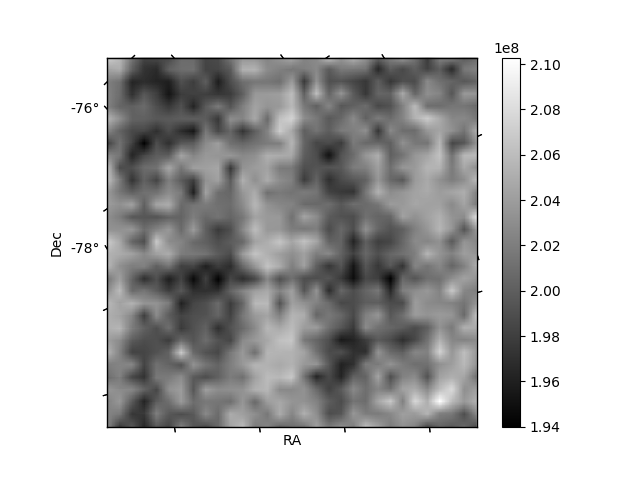
Histogram calculated using DETX and DETY for each event in the final _common_clean file
| Quadrant A | 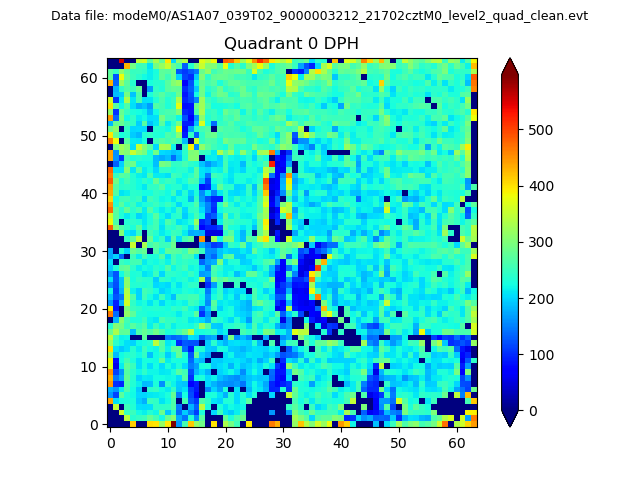 |
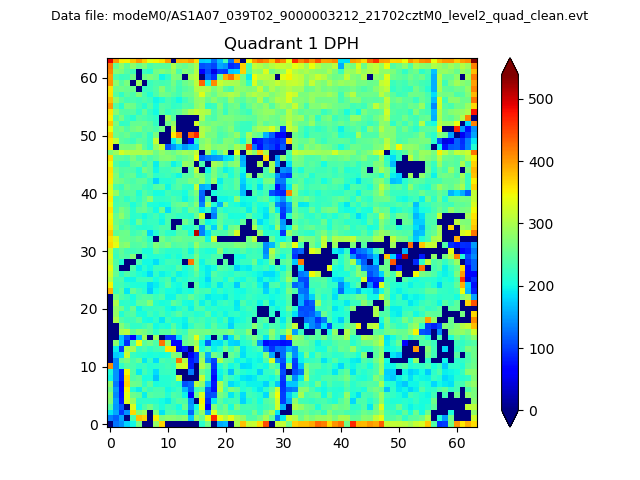 |
Quadrant B |
|---|---|---|---|
| Quadrant D | 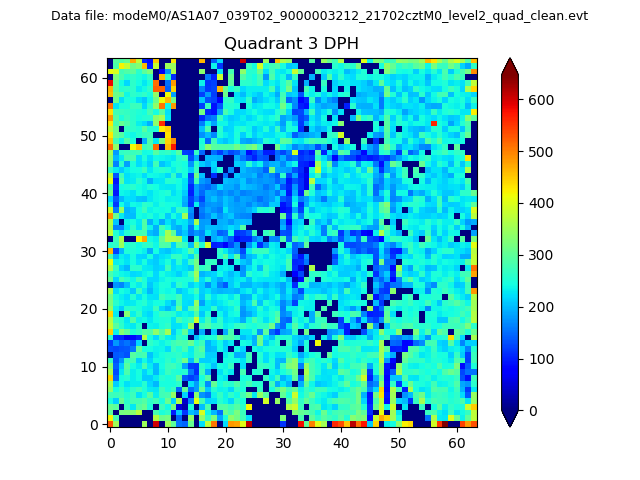 |
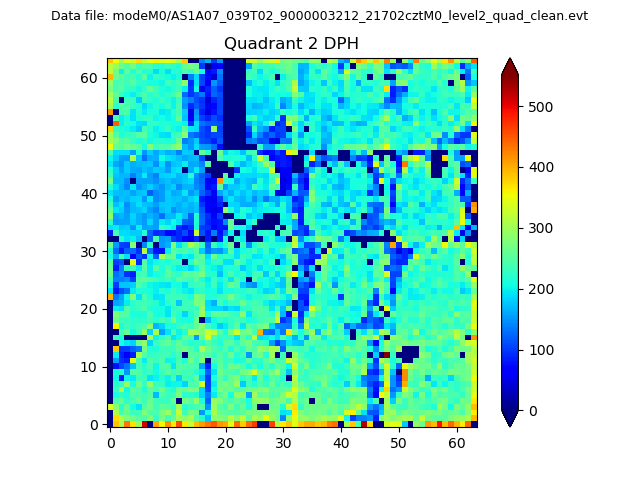 |
Quadrant C |
| Plot type | Count rate plots | Images |
|---|---|---|
| Comparison with Poisson distribution Blue bars denote a histogram of data divided into 1 sec bins. Red curve is a Poisson curve with rate = median count rate of data. |
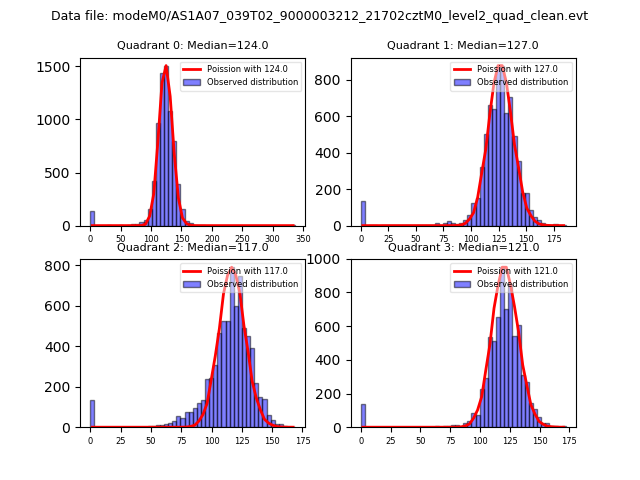 |
 |
| Quadrant-wise count rates Data is divided into 100 sec bins |
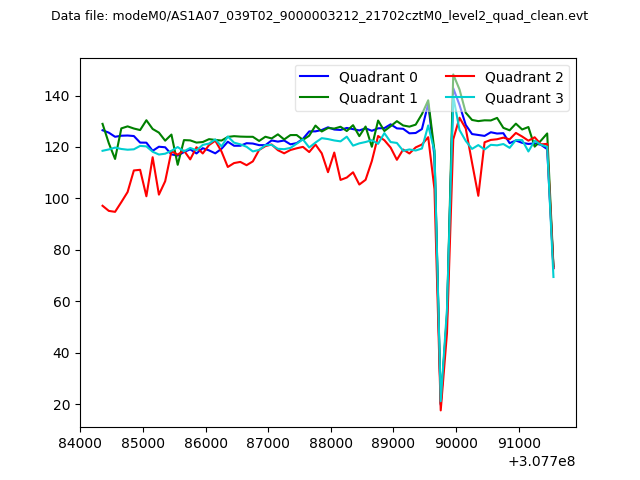 |
|
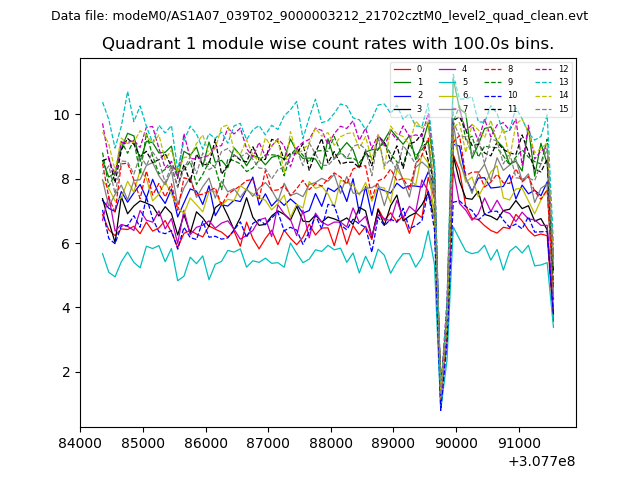
| Module-wise count rates for Quadrant A Data is divided into 100 sec bins |
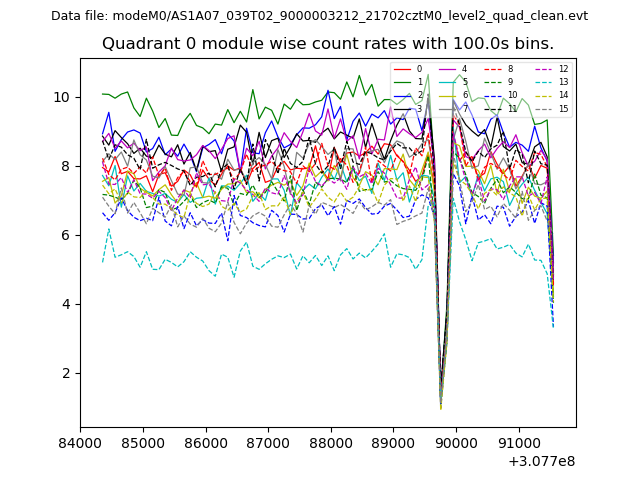 |
 |
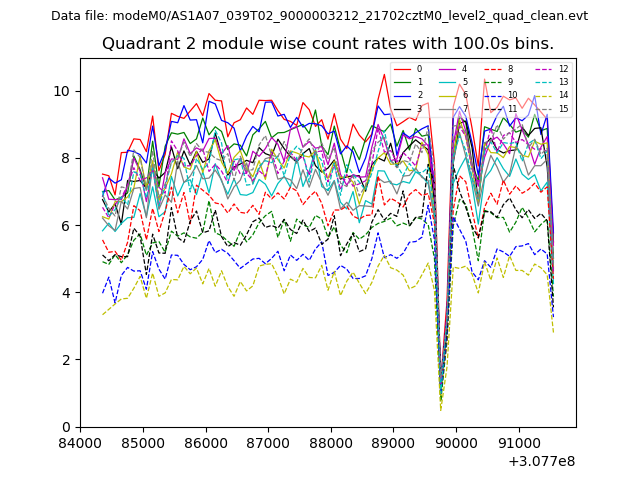
| Module-wise count rates for Quadrant B Data is divided into 100 sec bins |
 |
 |
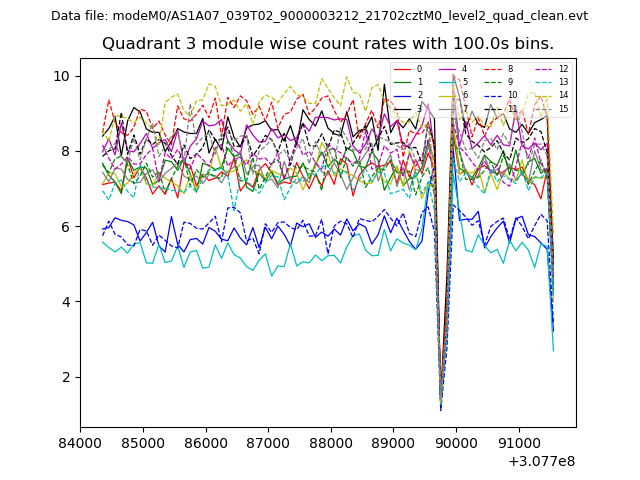
| Module-wise count rates for Quadrant C Data is divided into 100 sec bins |
 |
 |
| Module-wise count rates for Quadrant D Data is divided into 100 sec bins |
 |
 |
| Parameter | Plot |
|---|---|
| CZT HV Monitor | 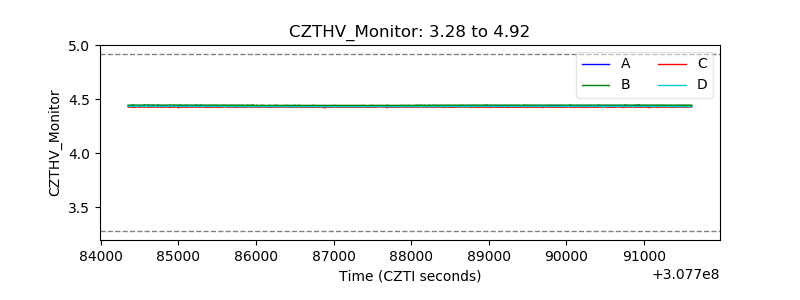 |
| D_VDD | 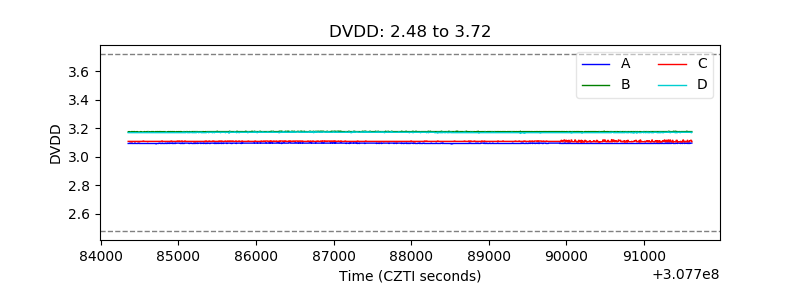 |
| Temperature 1 | 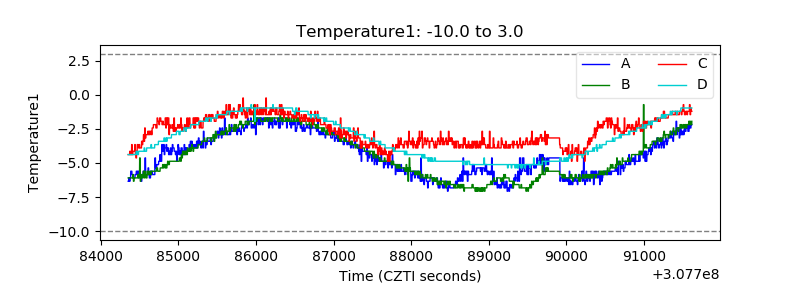 |
| Veto HV Monitor | 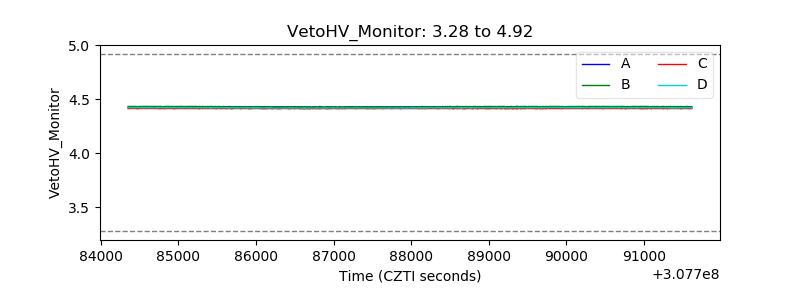 |
| Veto LLD | 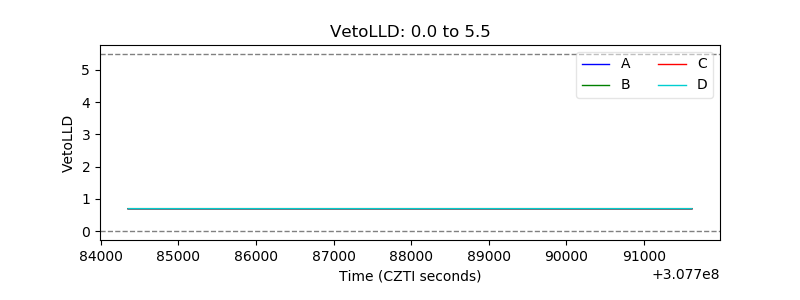 |
| Alpha Counter | 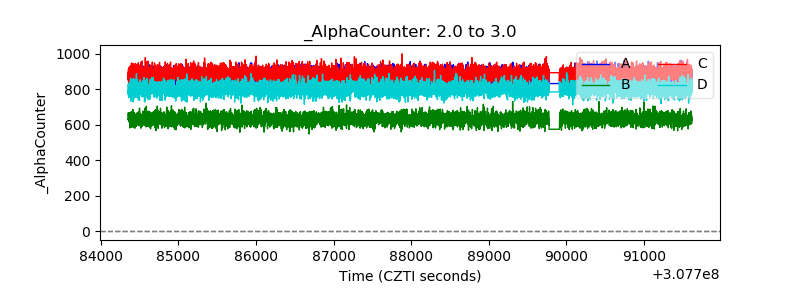 |
| _CPM_Rate | 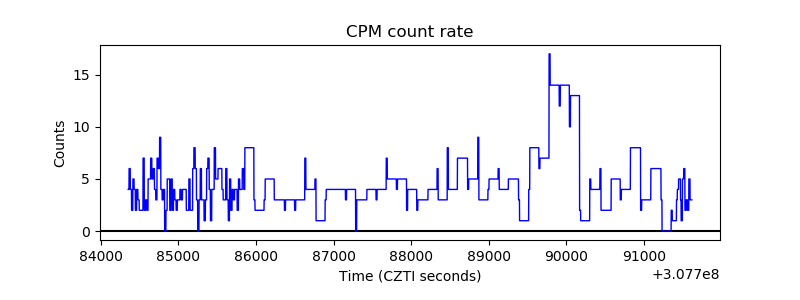 |
| CZT Counter |  |
| +2.5 Volts monitor |  |
| +5 Volts monitor |  |
| _ROLL_ROT | 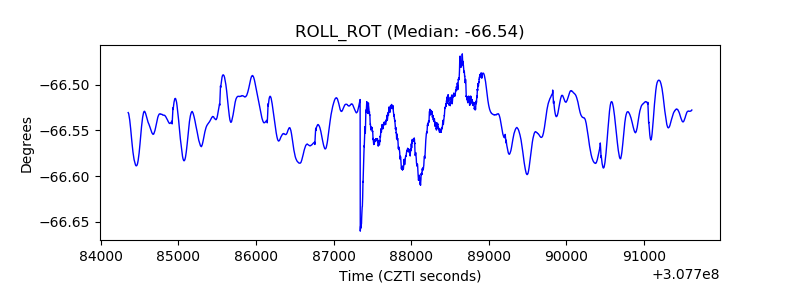 |
| _Roll_DEC | 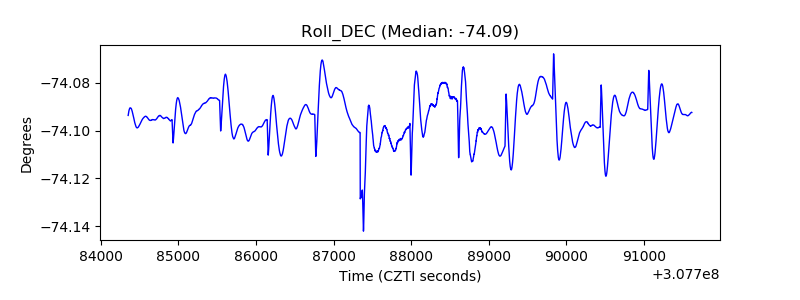 |
| _Roll_RA | 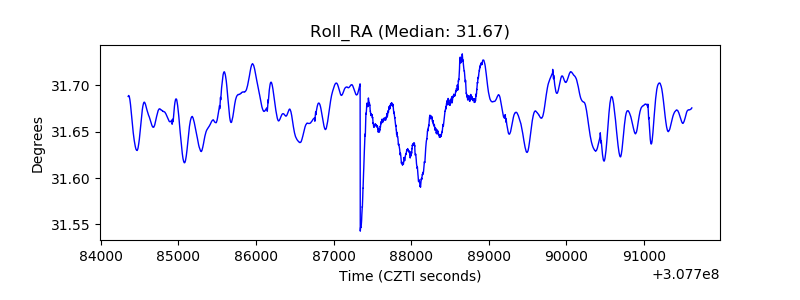 |
| Veto Counter | 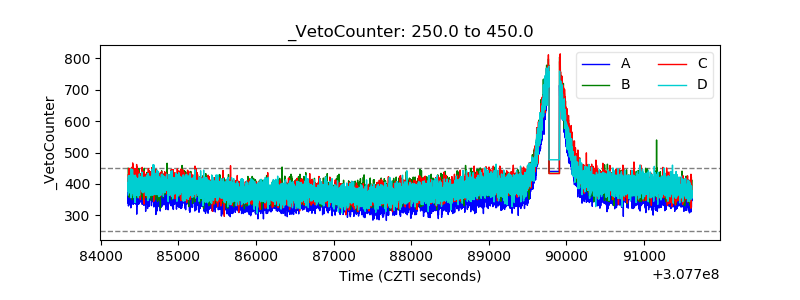 |