| Param | Original file | Final file |
|---|---|---|
| Filename | modeM0/AS1A07_039T02_9000003212_21706cztM0_level2.evt | modeM0/AS1A07_039T02_9000003212_21706cztM0_level2_quad_clean.evt |
| Size (bytes) | 799,122,240 | 170,173,440 |
| Size | 762.1 MB | 162.3 MB |
| Events in quadrant A | 4,390,022 | 1,139,049 |
| Events in quadrant B | 4,737,347 | 1,159,765 |
| Events in quadrant C | 8,870,568 | 1,105,159 |
| Events in quadrant D | 5,571,927 | 1,101,859 |
| Mode M0 | |||
|---|---|---|---|
| Quadrant | BADHDUFLAG | Total packets | Discarded packets |
| A | 0 | 19617 | 1 |
| B | 0 | 20210 | 1 |
| C | 0 | 32924 | 1 |
| D | 0 | 23039 | 1 |
| Mode SS | |||
|---|---|---|---|
| Quadrant | BADHDUFLAG | Total packets | Discarded packets |
| A | 0 | 188 | 0 |
| B | 0 | 188 | 0 |
| C | 0 | 188 | 0 |
| D | 0 | 188 | 0 |
| Mode M9 | |||
|---|---|---|---|
| Quadrant | BADHDUFLAG | Total packets | Discarded packets |
| A | 0 | 4 | 0 |
| B | 0 | 4 | 0 |
| C | 0 | 4 | 0 |
| D | 0 | 4 | 0 |
| Quadrant | Total seconds | Saturated seconds | Saturation percentage |
|---|---|---|---|
| A | 9348 | 122 | 1.305092% |
| B | 9349 | 193 | 2.064392% |
| C | 9349 | 643 | 6.877741% |
| D | 9349 | 324 | 3.465611% |
Noise dominated data is calculated using 1-second bins in cleaned event files. If a bin has >2000 counts, and if more than 50% of those come from <1% of pixels, then it is considered to be noise-dominated and hence unusable.
| Quadrant | # 1 sec bins | Bins with >0 counts | Bins with >2000 counts | High rate bins dominated by noise | Noise dominated (total time) | Noise dominated (detector-on time) | Marked lightcurve |
|---|---|---|---|---|---|---|---|
| A | 9673 | 9349 | 0 | 0 | 0.00% | 0.00% | 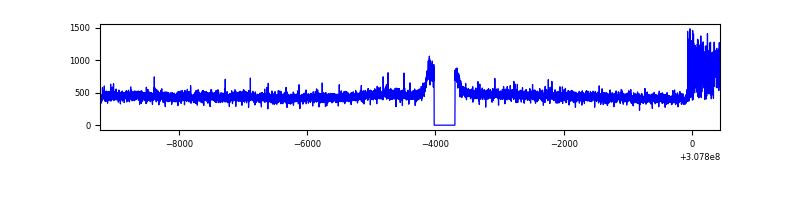 |
| B | 9674 | 9350 | 45 | 45 | 0.47% | 0.48% | 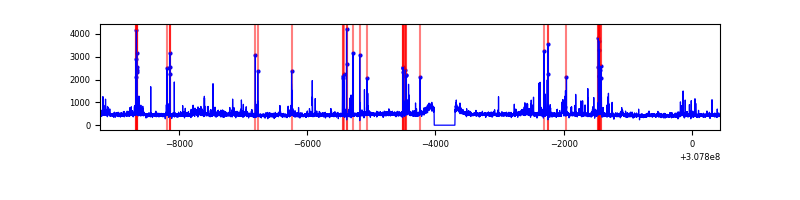 |
| C | 9674 | 9350 | 101 | 101 | 1.04% | 1.08% | 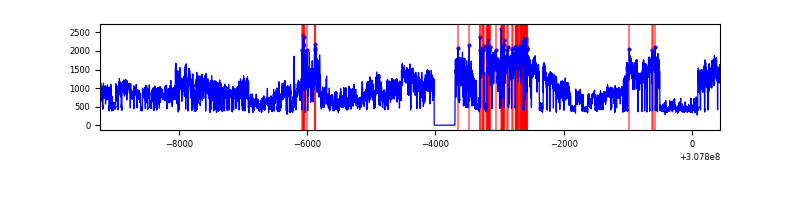 |
| D | 9674 | 9350 | 218 | 218 | 2.25% | 2.33% |  |
Top three noisy pixels from each quadrant. If the there are fewer than three noisy pixels in the level2.evt file, extra rows are filled as -1
| Pixel properties | Quadrant properties | ||||||
|---|---|---|---|---|---|---|---|
| Quadrant | DetID | PixID | Counts | Sigma | Mean | Median | Sigma |
| A | 15 | 236 | 240491 | 1099.9 | 1075 | 1051 | 217.7 |
| A | 13 | 254 | 18318 | 79.32 | 1075 | 1051 | 217.7 |
| A | 0 | 226 | 9016 | 36.59 | 1075 | 1051 | 217.7 |
| B | 3 | 64 | 293823 | 1443.78 | 1072 | 1045 | 202.8 |
| B | 0 | 189 | 90724 | 442.24 | 1072 | 1045 | 202.8 |
| B | 0 | 230 | 57539 | 278.59 | 1072 | 1045 | 202.8 |
| C | 8 | 208 | 4687808 | 19601.88 | 1022 | 1029 | 239.1 |
| C | 14 | 238 | 159387 | 662.31 | 1022 | 1029 | 239.1 |
| C | 13 | 250 | 15655 | 61.17 | 1022 | 1029 | 239.1 |
| D | 1 | 52 | 1184460 | 4689.05 | 1044 | 1012 | 252.4 |
| D | 13 | 104 | 111280 | 436.9 | 1044 | 1012 | 252.4 |
| D | 2 | 136 | 108479 | 425.8 | 1044 | 1012 | 252.4 |
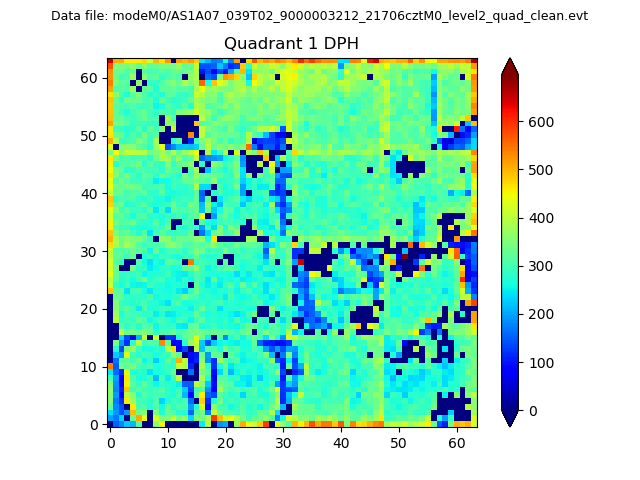
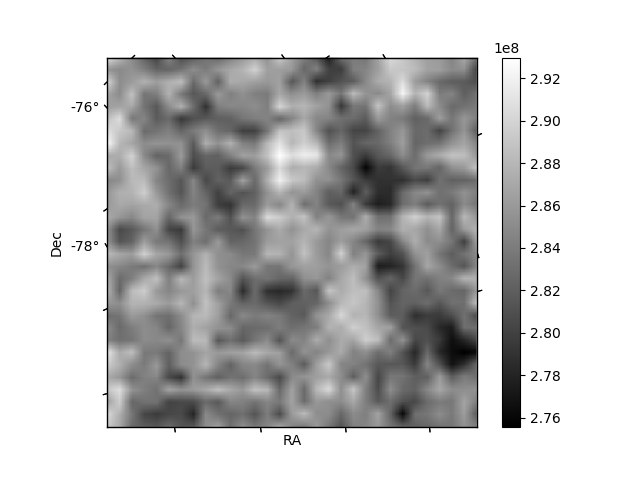
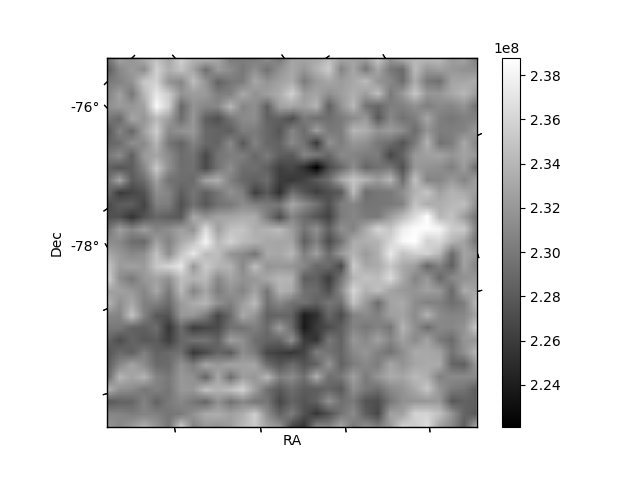
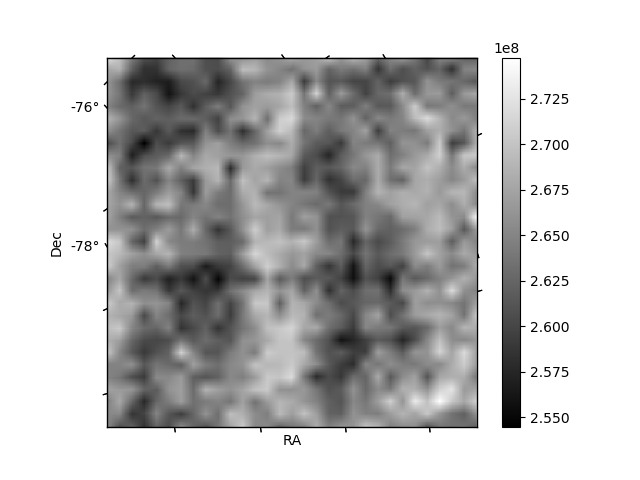
Histogram calculated using DETX and DETY for each event in the final _common_clean file
| Quadrant A |  |
 |
Quadrant B |
|---|---|---|---|
| Quadrant D | 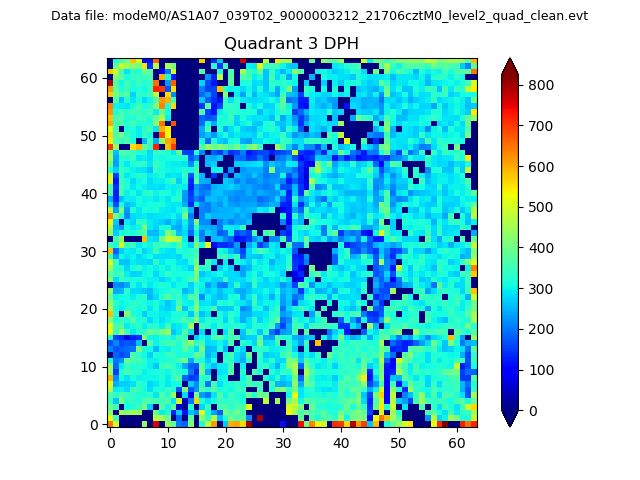 |
 |
Quadrant C |
| Plot type | Count rate plots | Images |
|---|---|---|
| Comparison with Poisson distribution Blue bars denote a histogram of data divided into 1 sec bins. Red curve is a Poisson curve with rate = median count rate of data. |
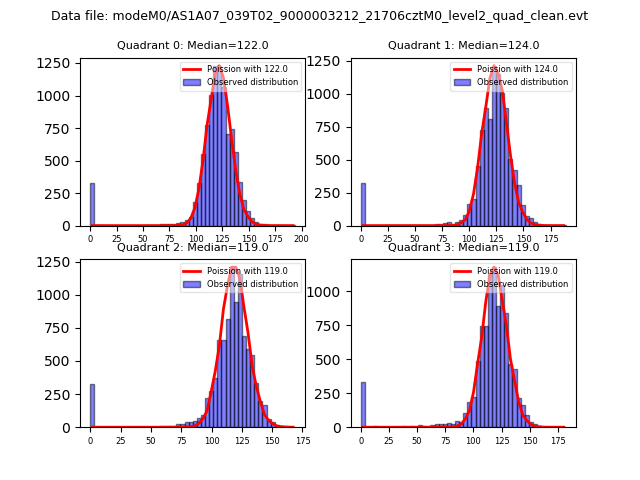 |
 |
| Quadrant-wise count rates Data is divided into 100 sec bins |
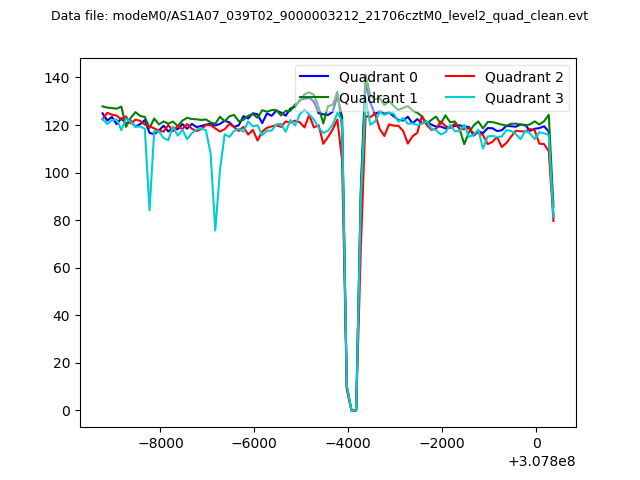 |
|
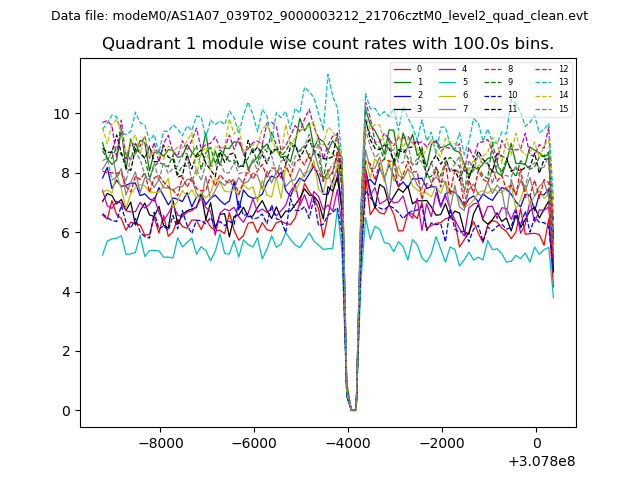
| Module-wise count rates for Quadrant A Data is divided into 100 sec bins |
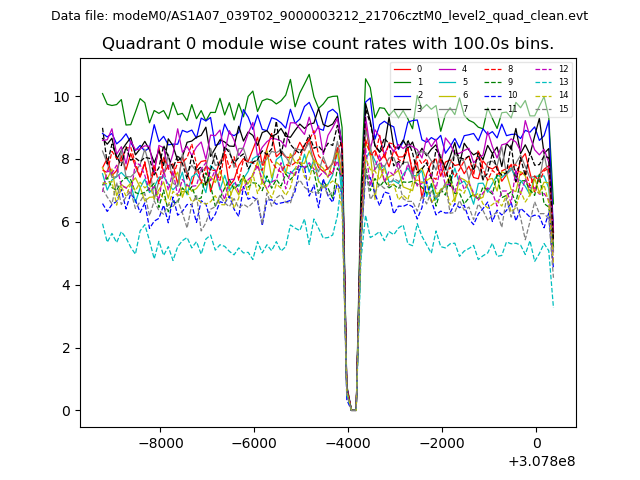 |
 |
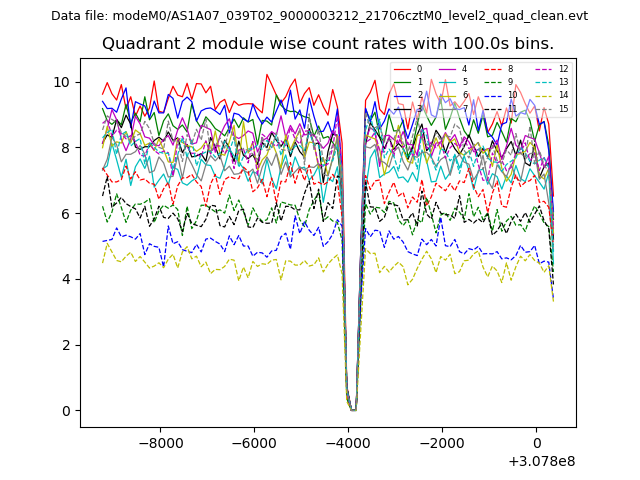
| Module-wise count rates for Quadrant B Data is divided into 100 sec bins |
 |
 |
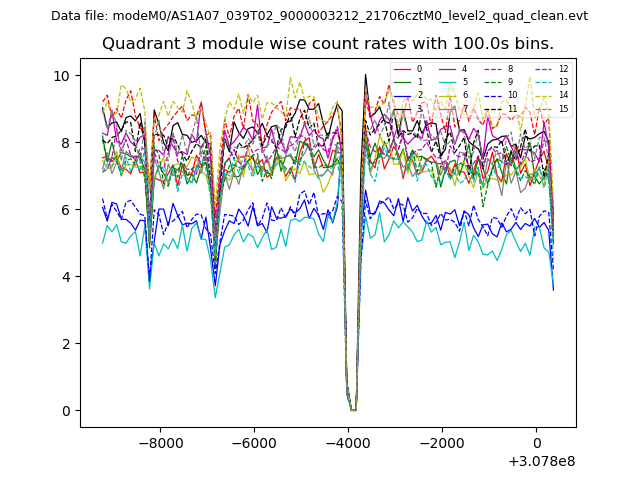
| Module-wise count rates for Quadrant C Data is divided into 100 sec bins |
 |
 |
| Module-wise count rates for Quadrant D Data is divided into 100 sec bins |
 |
 |
| Parameter | Plot |
|---|---|
| CZT HV Monitor | 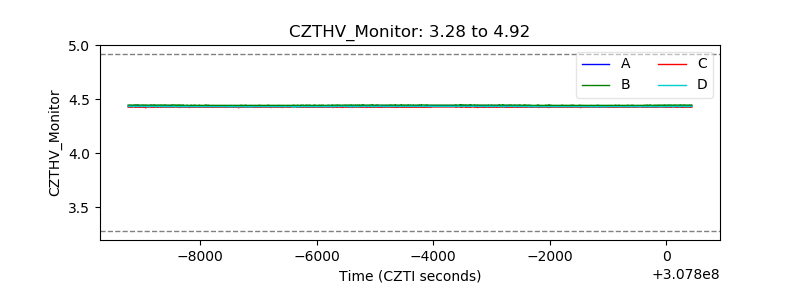 |
| D_VDD | 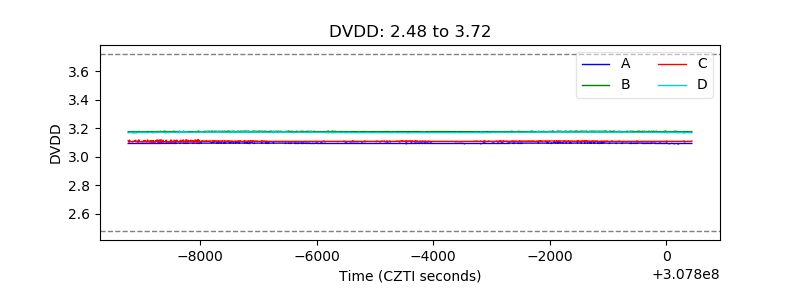 |
| Temperature 1 | 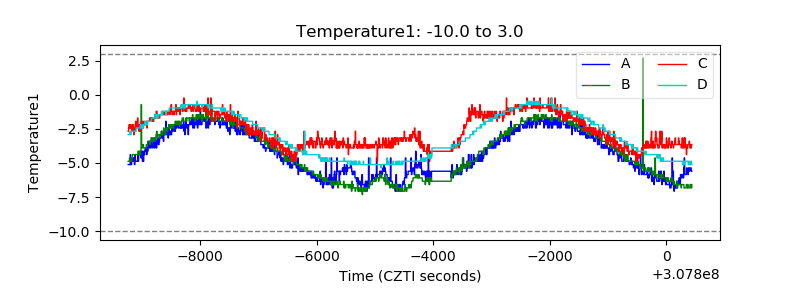 |
| Veto HV Monitor | 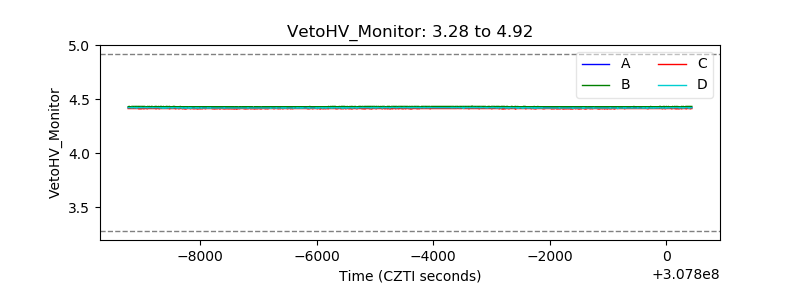 |
| Veto LLD | 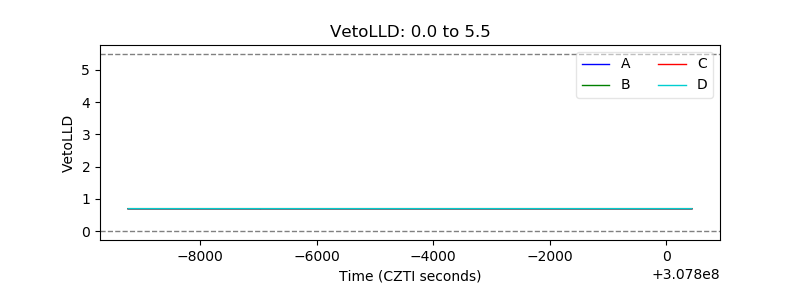 |
| Alpha Counter | 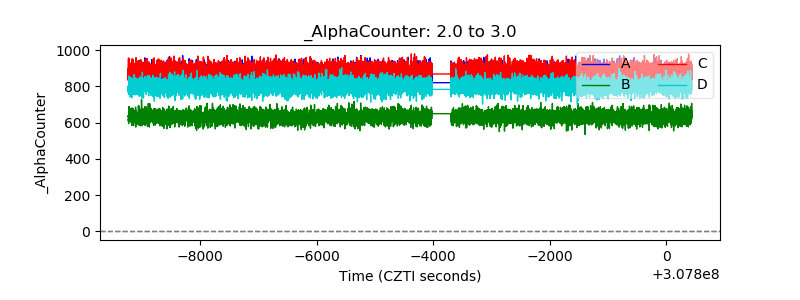 |
| _CPM_Rate | 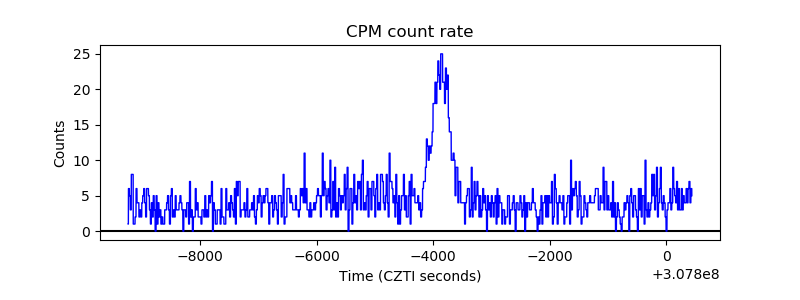 |
| CZT Counter |  |
| +2.5 Volts monitor |  |
| +5 Volts monitor |  |
| _ROLL_ROT | 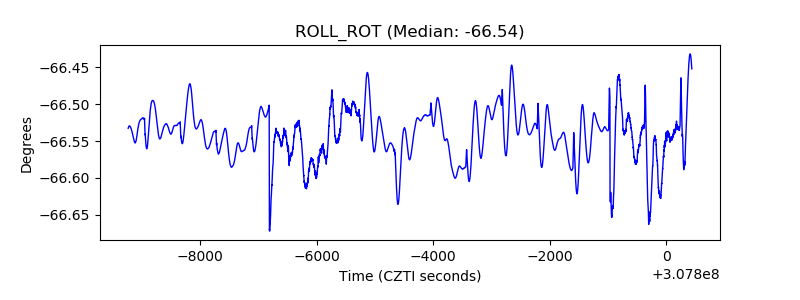 |
| _Roll_DEC | 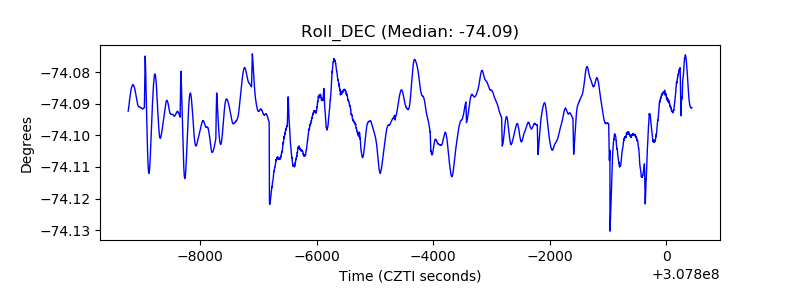 |
| _Roll_RA | 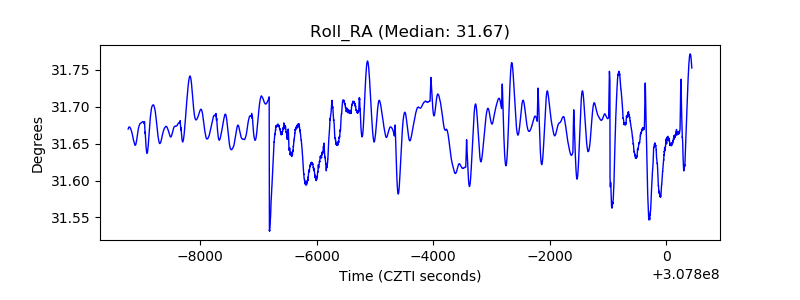 |
| Veto Counter | 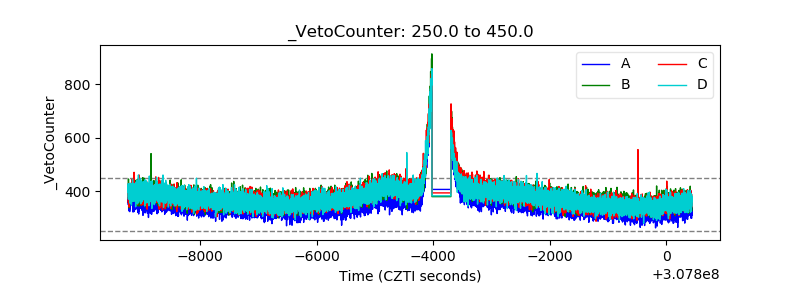 |