| Param | Original file | Final file |
|---|---|---|
| Filename | modeM0/AS1A07_039T01_9000003216cztM0_level2.fits | modeM0/AS1A07_039T01_9000003216cztM0_level2_quad_clean.evt |
| Size (bytes) | 446,244,480 | 621,380,160 |
| Size | 425.6 MB | 592.6 MB |
| Events in quadrant A | 2,695,034 | 4,014,699 |
| Events in quadrant B | 2,606,912 | 4,082,407 |
| Events in quadrant C | 2,672,794 | 3,915,758 |
| Events in quadrant D | 2,325,920 | 3,595,290 |
| Mode M0 | |||
|---|---|---|---|
| Quadrant | BADHDUFLAG | Total packets | Discarded packets |
| A | 0 | 96705 | 0 |
| B | 0 | 101970 | 0 |
| C | 0 | 111789 | 0 |
| D | 0 | 113816 | 0 |
| Mode M9 | |||
|---|---|---|---|
| Quadrant | BADHDUFLAG | Total packets | Discarded packets |
| A | 0 | 57 | 0 |
| B | 0 | 57 | 0 |
| C | 0 | 57 | 0 |
| D | 0 | 57 | 0 |
| Mode SS | |||
|---|---|---|---|
| Quadrant | BADHDUFLAG | Total packets | Discarded packets |
| A | 0 | 956 | 0 |
| B | 0 | 956 | 0 |
| C | 0 | 956 | 0 |
| D | 0 | 956 | 0 |
| Quadrant | Total seconds | Saturated seconds | Saturation percentage |
|---|---|---|---|
| A | 46797 | 773 | 1.651815% |
| B | 46797 | 1018 | 2.175353% |
| C | 46797 | 1826 | 3.901960% |
| D | 46797 | 1609 | 3.438255% |
Noise dominated data is calculated using 1-second bins in cleaned event files. If a bin has >2000 counts, and if more than 50% of those come from <1% of pixels, then it is considered to be noise-dominated and hence unusable.
| Quadrant | # 1 sec bins | Bins with >0 counts | Bins with >2000 counts | High rate bins dominated by noise | Noise dominated (total time) | Noise dominated (detector-on time) | Marked lightcurve |
|---|---|---|---|---|---|---|---|
| A | 52692 | 46795 | 0 | 0 | 0.00% | 0.00% |  |
| B | 52692 | 46788 | 0 | 0 | 0.00% | 0.00% |  |
| C | 52692 | 46795 | 0 | 0 | 0.00% | 0.00% |  |
| D | 52692 | 46786 | 0 | 0 | 0.00% | 0.00% | 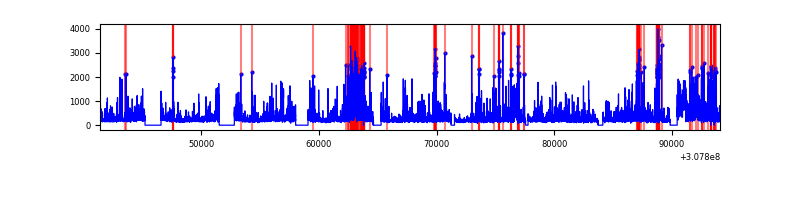 |
Top three noisy pixels from each quadrant. If the there are fewer than three noisy pixels in the level2.evt file, extra rows are filled as -1
| Pixel properties | Quadrant properties | ||||||
|---|---|---|---|---|---|---|---|
| Quadrant | DetID | PixID | Counts | Sigma | Mean | Median | Sigma |
| A | 0 | 29 | 2546 | 10.94 | 701 | 660 | 172.4 |
| A | 7 | 110 | 2138 | 8.57 | 701 | 660 | 172.4 |
| A | 9 | 19 | 2042 | 8.02 | 701 | 660 | 172.4 |
| B | 2 | 9 | 2118 | 10.81 | 689 | 658 | 135.0 |
| B | 2 | 8 | 1761 | 8.17 | 689 | 658 | 135.0 |
| B | 3 | 17 | 1732 | 7.95 | 689 | 658 | 135.0 |
| C | 3 | 234 | 1940 | 7.1 | 705 | 661 | 180.1 |
| C | 12 | 241 | 1918 | 6.98 | 705 | 661 | 180.1 |
| C | 3 | 126 | 1812 | 6.39 | 705 | 661 | 180.1 |
| D | 4 | 246 | 1770 | 6.6 | 663 | 604 | 176.7 |
| D | 3 | 14 | 1698 | 6.19 | 663 | 604 | 176.7 |
| D | 15 | 46 | 1652 | 5.93 | 663 | 604 | 176.7 |
Histogram calculated using DETX and DETY for each event in the final _common_clean file
| Quadrant A | 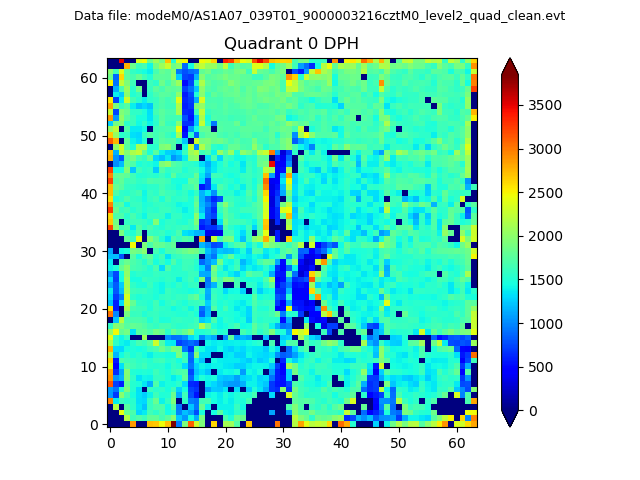 |
 |
Quadrant B |
|---|---|---|---|
| Quadrant D | 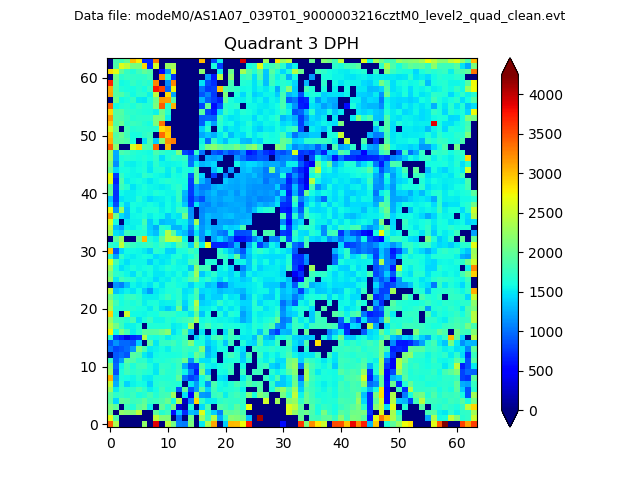 |
 |
Quadrant C |
| Plot type | Count rate plots | Images |
|---|---|---|
| Comparison with Poisson distribution Blue bars denote a histogram of data divided into 1 sec bins. Red curve is a Poisson curve with rate = median count rate of data. |
 |
 |
| Quadrant-wise count rates Data is divided into 100 sec bins |
 |
|
| Module-wise count rates for Quadrant A Data is divided into 100 sec bins |
 |
 |
| Module-wise count rates for Quadrant B Data is divided into 100 sec bins |
 |
 |
| Module-wise count rates for Quadrant C Data is divided into 100 sec bins |
 |
 |
| Module-wise count rates for Quadrant D Data is divided into 100 sec bins |
 |
 |
| Parameter | Plot |
|---|---|
| CZT HV Monitor |  |
| D_VDD |  |
| Temperature 1 |  |
| Veto HV Monitor |  |
| Veto LLD |  |
| Alpha Counter |  |
| _CPM_Rate |  |
| CZT Counter |  |
| +2.5 Volts monitor |  |
| +5 Volts monitor |  |
| _ROLL_ROT |  |
| _Roll_DEC |  |
| _Roll_RA |  |
| Veto Counter |  |