| Param | Original file | Final file |
|---|---|---|
| Filename | modeM0/AS1A07_039T01_9000003216_21712cztM0_level2.evt | modeM0/AS1A07_039T01_9000003216_21712cztM0_level2_quad_clean.evt |
| Size (bytes) | 386,798,400 | 113,817,600 |
| Size | 368.9 MB | 108.5 MB |
| Events in quadrant A | 2,620,505 | 765,539 |
| Events in quadrant B | 2,960,951 | 796,778 |
| Events in quadrant C | 2,906,833 | 767,537 |
| Events in quadrant D | 2,858,608 | 739,627 |
| Mode M0 | |||
|---|---|---|---|
| Quadrant | BADHDUFLAG | Total packets | Discarded packets |
| A | 0 | 11234 | 1 |
| B | 0 | 12189 | 1 |
| C | 0 | 11936 | 1 |
| D | 0 | 12011 | 1 |
| Mode M9 | |||
|---|---|---|---|
| Quadrant | BADHDUFLAG | Total packets | Discarded packets |
| A | 0 | 13 | 0 |
| B | 0 | 13 | 0 |
| C | 0 | 13 | 0 |
| D | 0 | 13 | 0 |
| Mode SS | |||
|---|---|---|---|
| Quadrant | BADHDUFLAG | Total packets | Discarded packets |
| A | 0 | 112 | 0 |
| B | 0 | 112 | 0 |
| C | 0 | 112 | 0 |
| D | 0 | 112 | 0 |
| Quadrant | Total seconds | Saturated seconds | Saturation percentage |
|---|---|---|---|
| A | 5392 | 21 | 0.389466% |
| B | 5392 | 76 | 1.409496% |
| C | 5392 | 51 | 0.945846% |
| D | 5392 | 23 | 0.426558% |
Noise dominated data is calculated using 1-second bins in cleaned event files. If a bin has >2000 counts, and if more than 50% of those come from <1% of pixels, then it is considered to be noise-dominated and hence unusable.
| Quadrant | # 1 sec bins | Bins with >0 counts | Bins with >2000 counts | High rate bins dominated by noise | Noise dominated (total time) | Noise dominated (detector-on time) | Marked lightcurve |
|---|---|---|---|---|---|---|---|
| A | 6752 | 5393 | 3 | 3 | 0.04% | 0.06% | 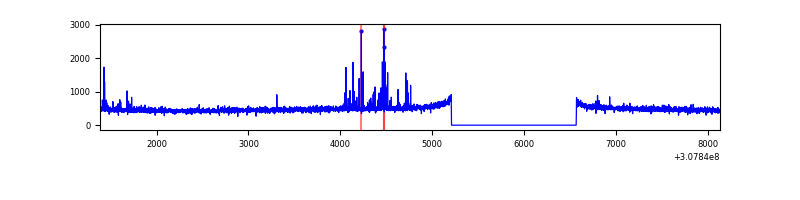 |
| B | 6752 | 5393 | 23 | 23 | 0.34% | 0.43% | 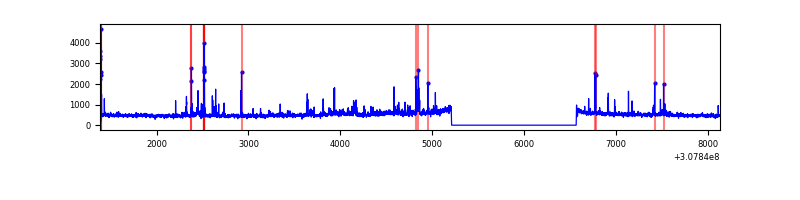 |
| C | 6752 | 5393 | 0 | 0 | 0.00% | 0.00% |  |
| D | 6752 | 5393 | 15 | 15 | 0.22% | 0.28% | 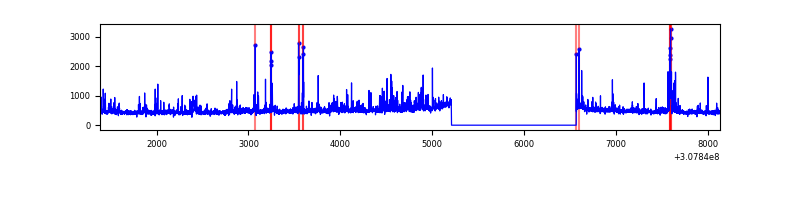 |
Top three noisy pixels from each quadrant. If the there are fewer than three noisy pixels in the level2.evt file, extra rows are filled as -1
| Pixel properties | Quadrant properties | ||||||
|---|---|---|---|---|---|---|---|
| Quadrant | DetID | PixID | Counts | Sigma | Mean | Median | Sigma |
| A | 10 | 253 | 52645 | 391.21 | 665 | 652 | 132.9 |
| A | 13 | 254 | 9077 | 63.39 | 665 | 652 | 132.9 |
| A | 0 | 226 | 5648 | 37.59 | 665 | 652 | 132.9 |
| B | 3 | 64 | 152778 | 1226.53 | 673 | 656 | 124.0 |
| B | 0 | 230 | 56715 | 451.99 | 673 | 656 | 124.0 |
| B | 0 | 189 | 55661 | 443.5 | 673 | 656 | 124.0 |
| C | 8 | 208 | 222741 | 1453.01 | 660 | 664 | 152.8 |
| C | 14 | 238 | 107273 | 697.52 | 660 | 664 | 152.8 |
| C | 10 | 23 | 4603 | 25.77 | 660 | 664 | 152.8 |
| D | 12 | 235 | 162475 | 1031.24 | 656 | 638 | 156.9 |
| D | 1 | 52 | 86235 | 545.43 | 656 | 638 | 156.9 |
| D | 2 | 136 | 50976 | 320.76 | 656 | 638 | 156.9 |
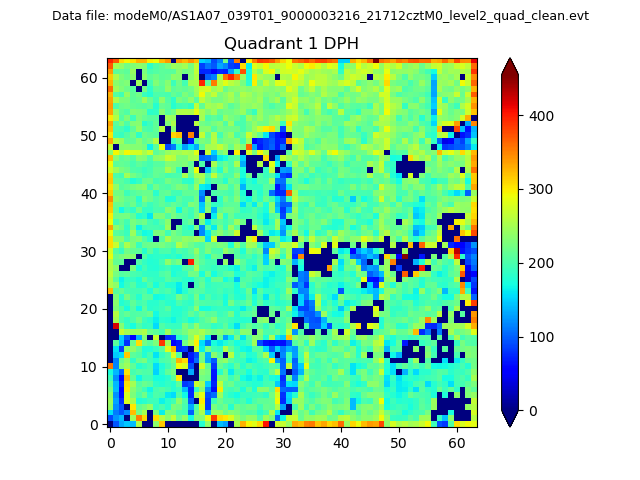
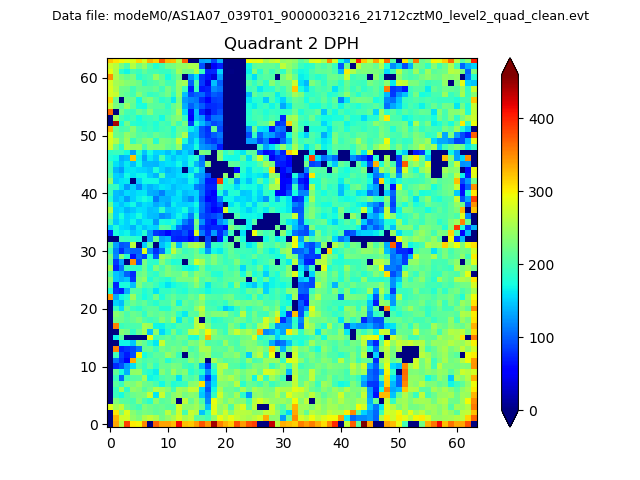
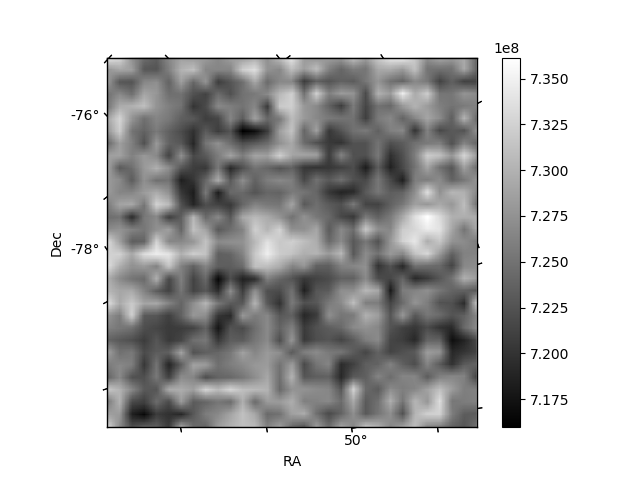
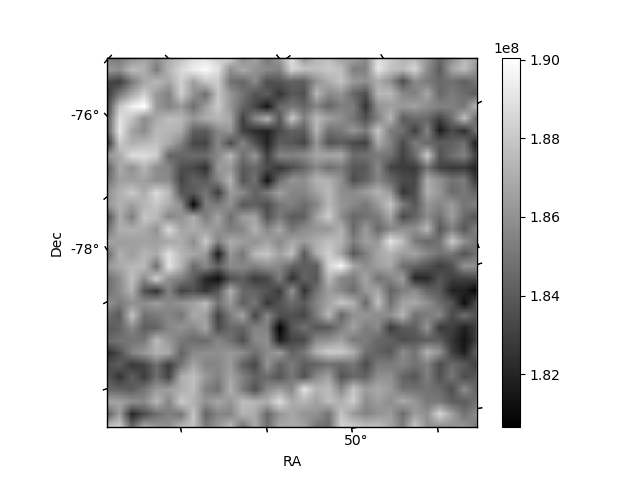
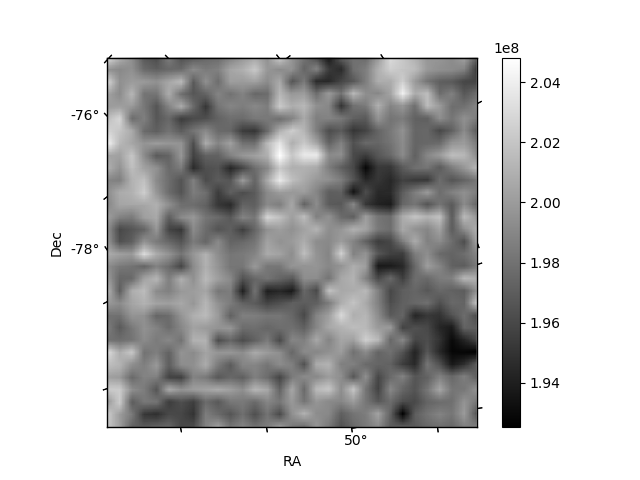
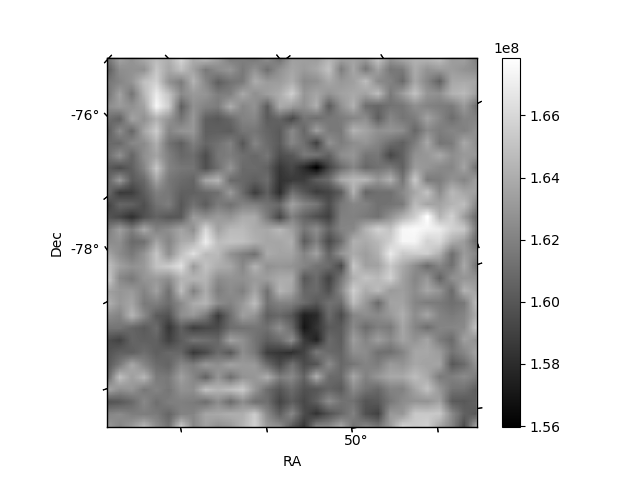
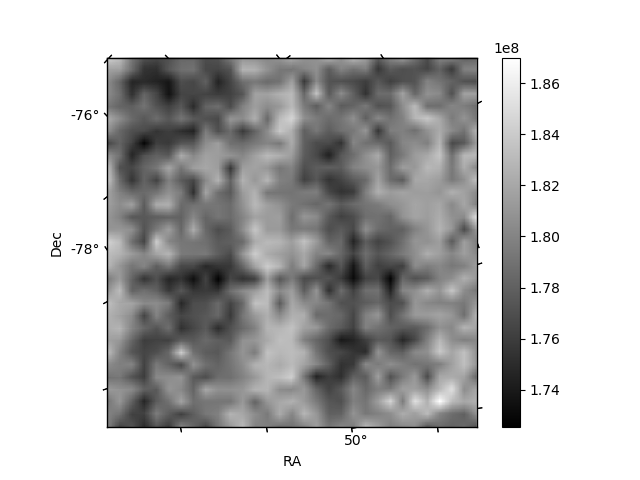
Histogram calculated using DETX and DETY for each event in the final _common_clean file
| Quadrant A | 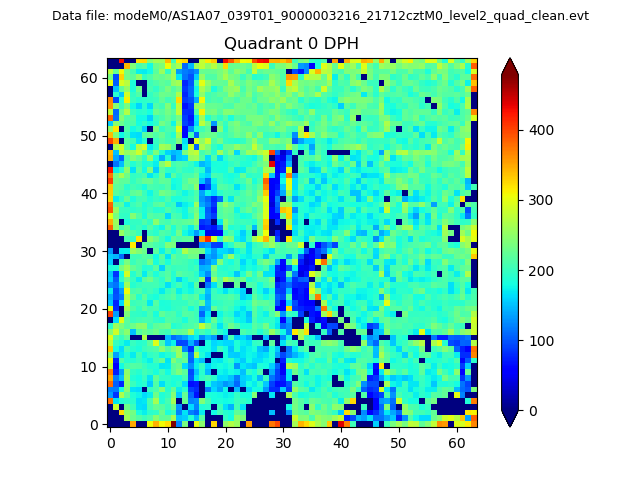 |
 |
Quadrant B |
|---|---|---|---|
| Quadrant D | 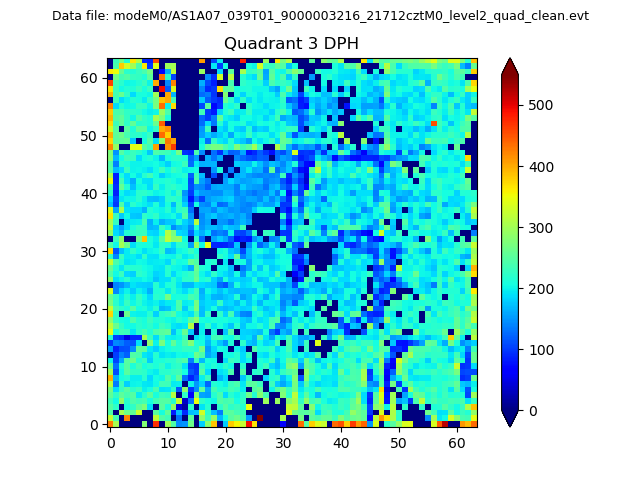 |
 |
Quadrant C |
| Plot type | Count rate plots | Images |
|---|---|---|
| Comparison with Poisson distribution Blue bars denote a histogram of data divided into 1 sec bins. Red curve is a Poisson curve with rate = median count rate of data. |
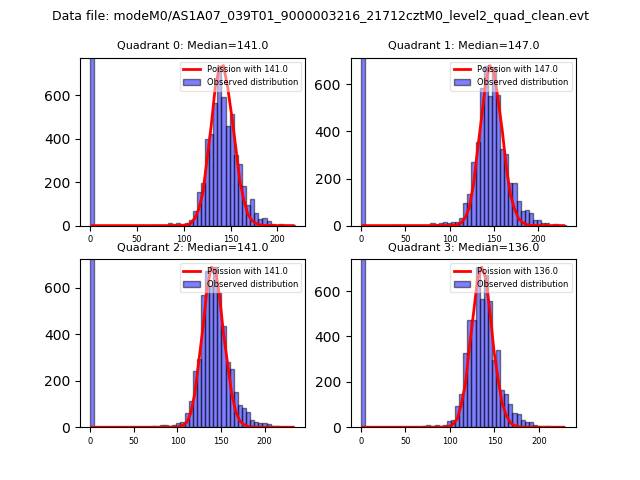 |
 |
| Quadrant-wise count rates Data is divided into 100 sec bins |
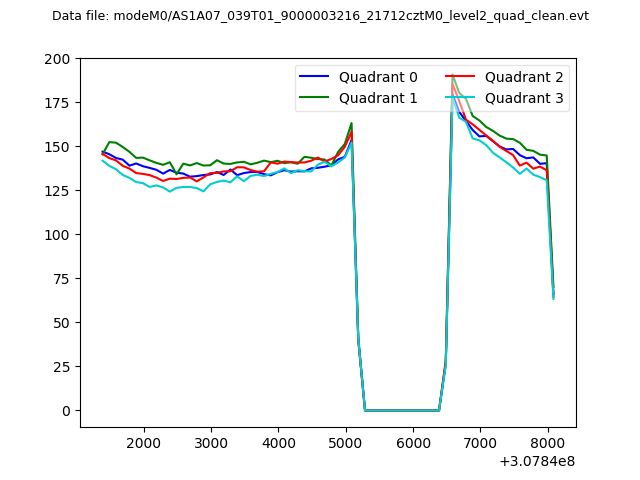 |
|
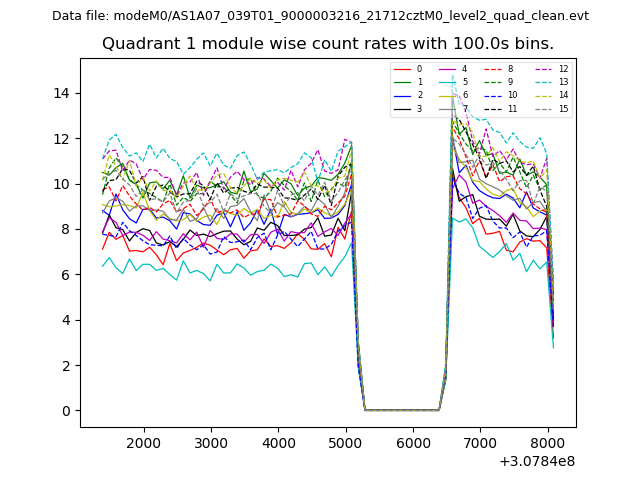
| Module-wise count rates for Quadrant A Data is divided into 100 sec bins |
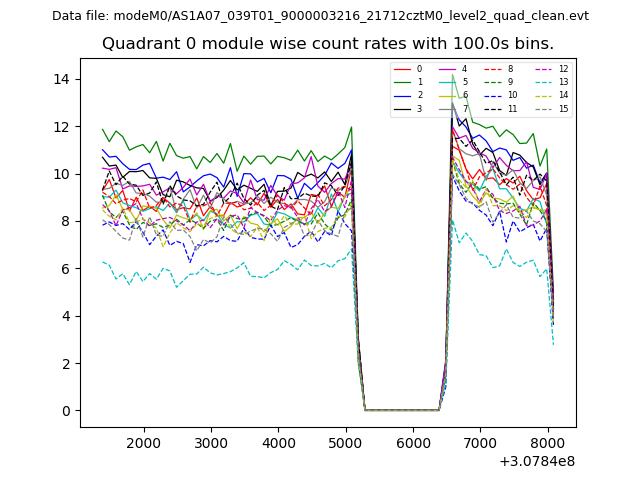 |
 |
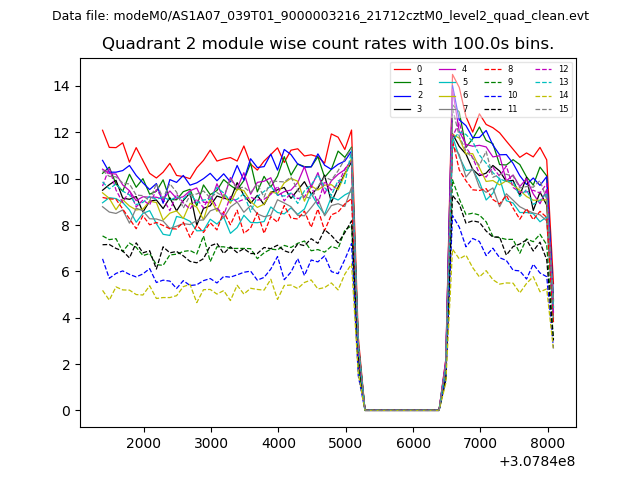
| Module-wise count rates for Quadrant B Data is divided into 100 sec bins |
 |
 |
| Module-wise count rates for Quadrant C Data is divided into 100 sec bins |
 |
 |
| Module-wise count rates for Quadrant D Data is divided into 100 sec bins |
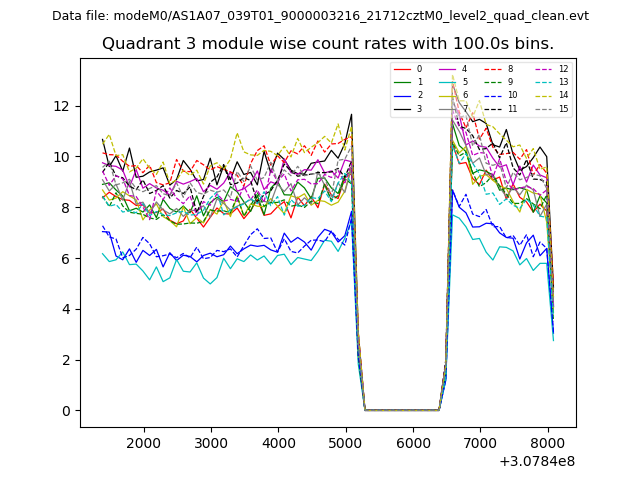 |
 |
| Parameter | Plot |
|---|---|
| CZT HV Monitor | 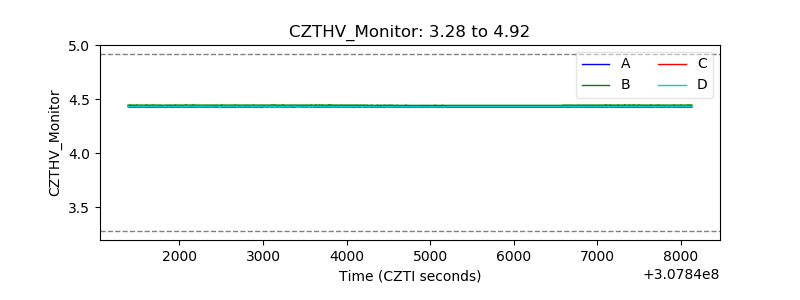 |
| D_VDD | 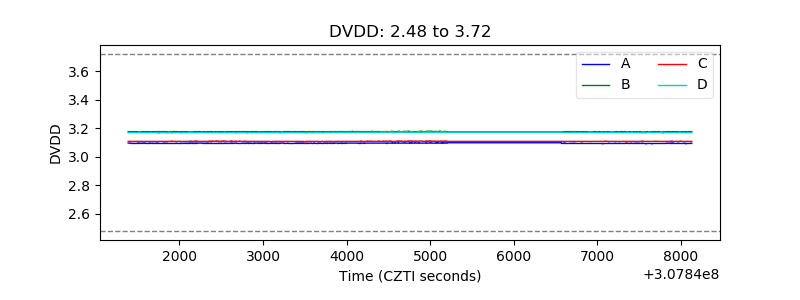 |
| Temperature 1 | 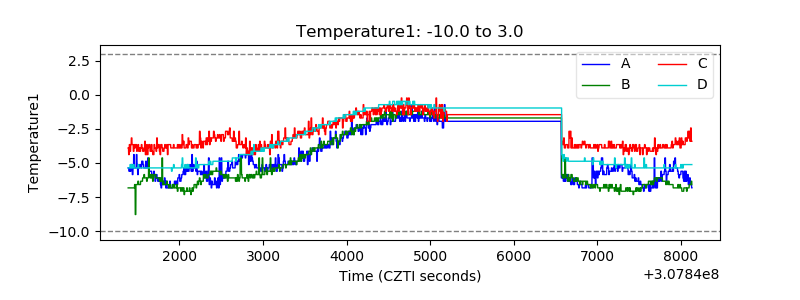 |
| Veto HV Monitor | 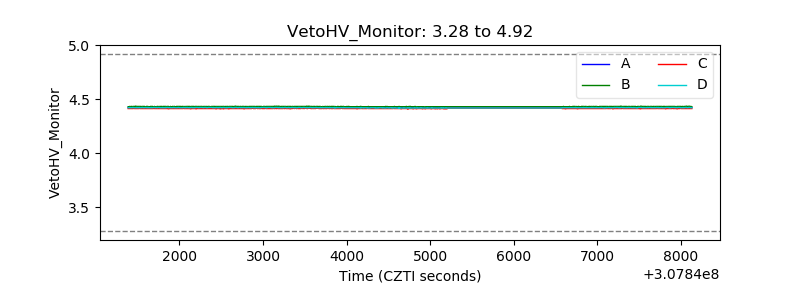 |
| Veto LLD | 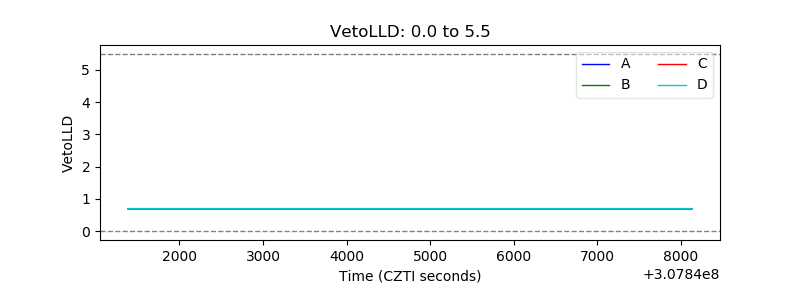 |
| Alpha Counter | 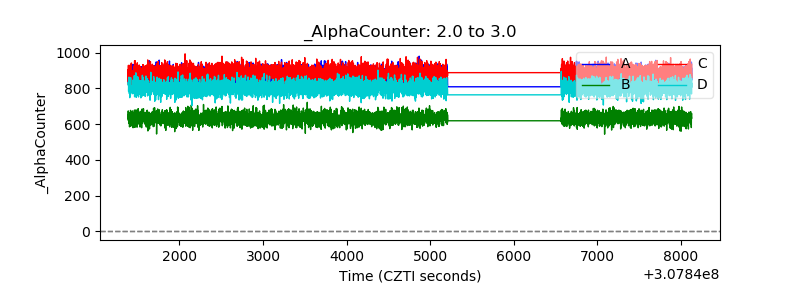 |
| _CPM_Rate | 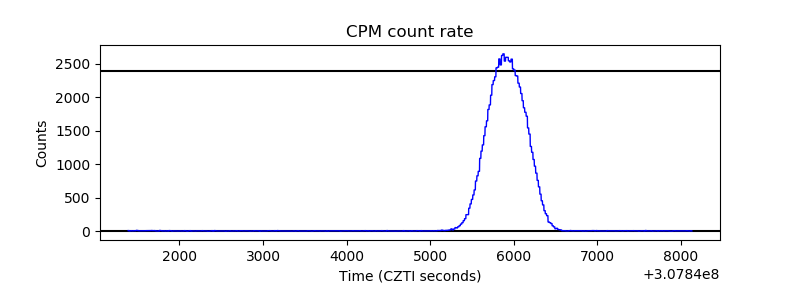 |
| CZT Counter | 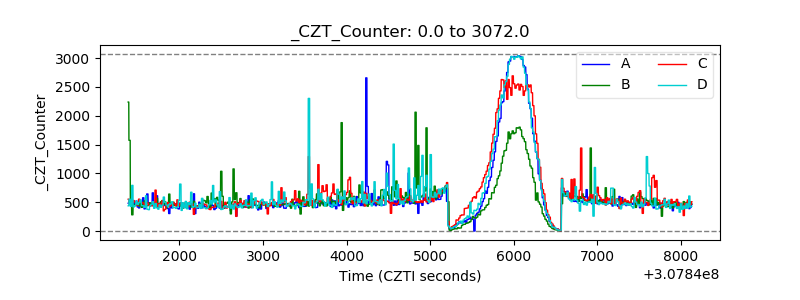 |
| +2.5 Volts monitor |  |
| +5 Volts monitor | 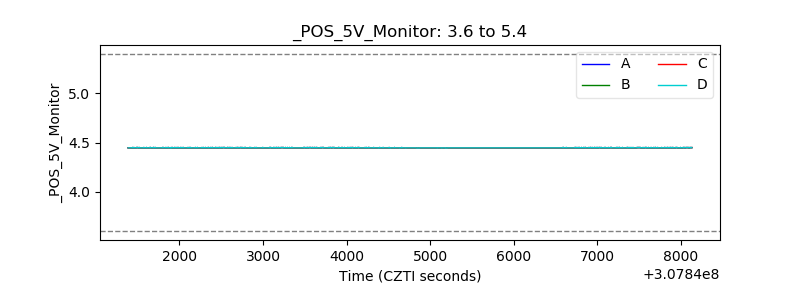 |
| _ROLL_ROT | 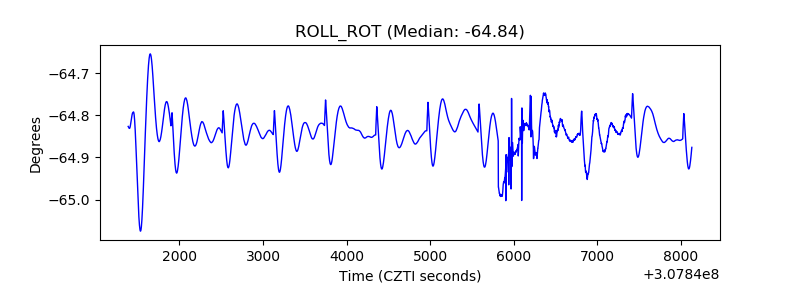 |
| _Roll_DEC |  |
| _Roll_RA | 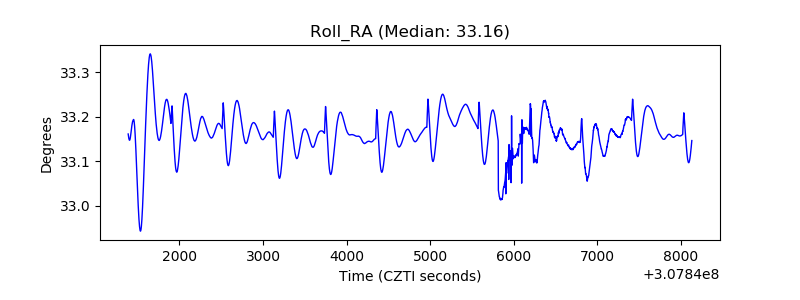 |
| Veto Counter | 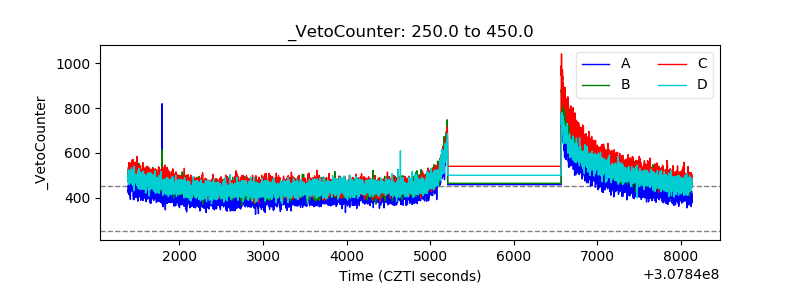 |