| Param | Original file | Final file |
|---|---|---|
| Filename | modeM0/AS1A07_039T01_9000003216_21714cztM0_level2.evt | modeM0/AS1A07_039T01_9000003216_21714cztM0_level2_quad_clean.evt |
| Size (bytes) | 459,529,920 | 133,223,040 |
| Size | 438.2 MB | 127.1 MB |
| Events in quadrant A | 3,101,714 | 892,210 |
| Events in quadrant B | 3,470,627 | 920,049 |
| Events in quadrant C | 3,323,327 | 894,538 |
| Events in quadrant D | 3,568,762 | 864,212 |
| Mode M0 | |||
|---|---|---|---|
| Quadrant | BADHDUFLAG | Total packets | Discarded packets |
| A | 0 | 13553 | 2 |
| B | 0 | 14444 | 3 |
| C | 0 | 13807 | 2 |
| D | 0 | 15010 | 2 |
| Mode M9 | |||
|---|---|---|---|
| Quadrant | BADHDUFLAG | Total packets | Discarded packets |
| A | 0 | 17 | 0 |
| B | 0 | 18 | 0 |
| C | 0 | 18 | 0 |
| D | 0 | 18 | 0 |
| Mode SS | |||
|---|---|---|---|
| Quadrant | BADHDUFLAG | Total packets | Discarded packets |
| A | 0 | 136 | 0 |
| B | 0 | 136 | 0 |
| C | 0 | 136 | 0 |
| D | 0 | 136 | 0 |
| Quadrant | Total seconds | Saturated seconds | Saturation percentage |
|---|---|---|---|
| A | 6657 | 17 | 0.255370% |
| B | 6656 | 71 | 1.066707% |
| C | 6656 | 74 | 1.111779% |
| D | 6656 | 53 | 0.796274% |
Noise dominated data is calculated using 1-second bins in cleaned event files. If a bin has >2000 counts, and if more than 50% of those come from <1% of pixels, then it is considered to be noise-dominated and hence unusable.
| Quadrant | # 1 sec bins | Bins with >0 counts | Bins with >2000 counts | High rate bins dominated by noise | Noise dominated (total time) | Noise dominated (detector-on time) | Marked lightcurve |
|---|---|---|---|---|---|---|---|
| A | 7707 | 6658 | 1 | 1 | 0.01% | 0.02% | 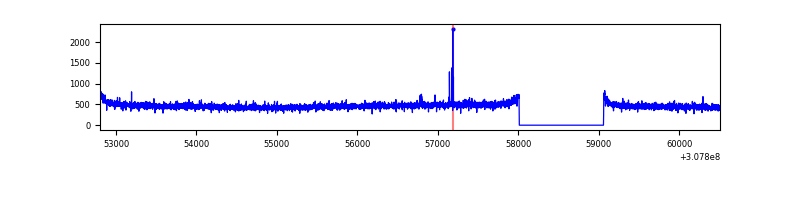 |
| B | 7706 | 6657 | 27 | 27 | 0.35% | 0.41% | 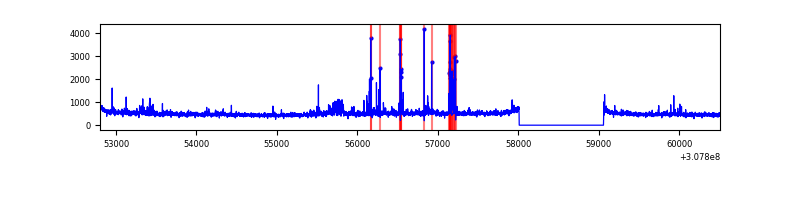 |
| C | 7706 | 6657 | 0 | 0 | 0.00% | 0.00% | 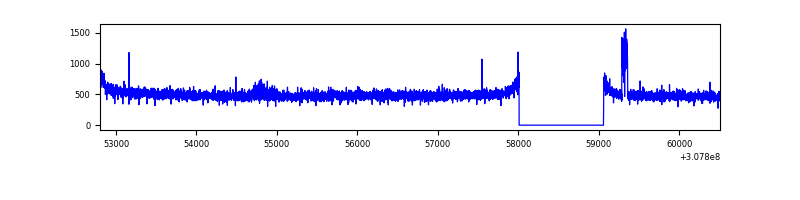 |
| D | 7706 | 6657 | 17 | 17 | 0.22% | 0.26% |  |
Top three noisy pixels from each quadrant. If the there are fewer than three noisy pixels in the level2.evt file, extra rows are filled as -1
| Pixel properties | Quadrant properties | ||||||
|---|---|---|---|---|---|---|---|
| Quadrant | DetID | PixID | Counts | Sigma | Mean | Median | Sigma |
| A | 13 | 254 | 11430 | 66.62 | 800 | 784 | 159.8 |
| A | 10 | 253 | 8529 | 48.47 | 800 | 784 | 159.8 |
| A | 0 | 226 | 6711 | 37.09 | 800 | 784 | 159.8 |
| B | 3 | 64 | 147766 | 989.0 | 807 | 786 | 148.6 |
| B | 0 | 229 | 57596 | 382.26 | 807 | 786 | 148.6 |
| B | 0 | 230 | 55481 | 368.03 | 807 | 786 | 148.6 |
| C | 14 | 238 | 125692 | 679.4 | 791 | 797 | 183.8 |
| C | 8 | 208 | 91476 | 493.27 | 791 | 797 | 183.8 |
| C | 8 | 128 | 11949 | 60.66 | 791 | 797 | 183.8 |
| D | 1 | 52 | 201128 | 1068.58 | 790 | 768 | 187.5 |
| D | 12 | 235 | 184221 | 978.41 | 790 | 768 | 187.5 |
| D | 14 | 35 | 63590 | 335.05 | 790 | 768 | 187.5 |
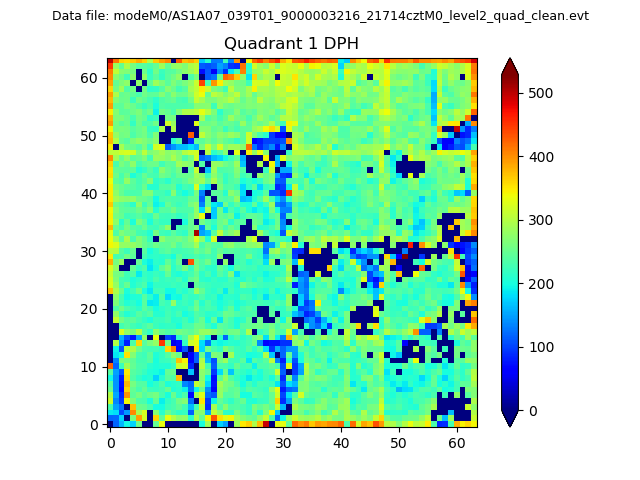
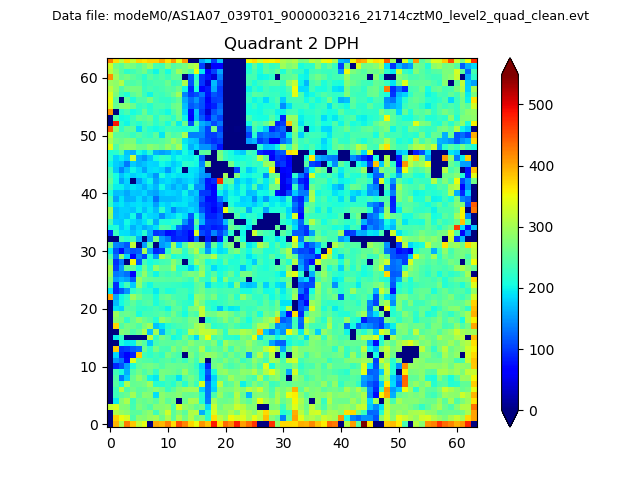
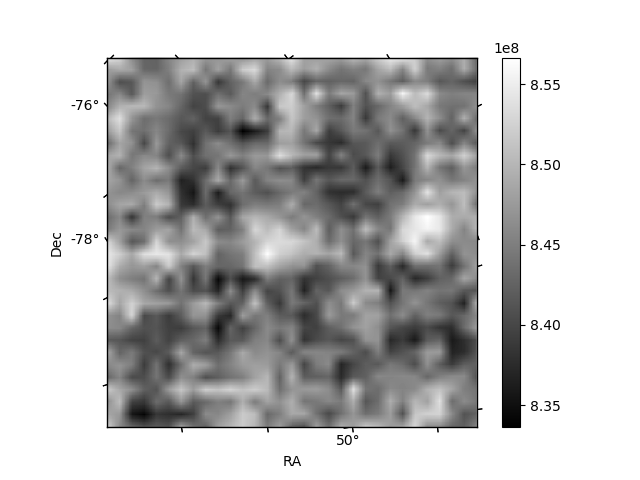
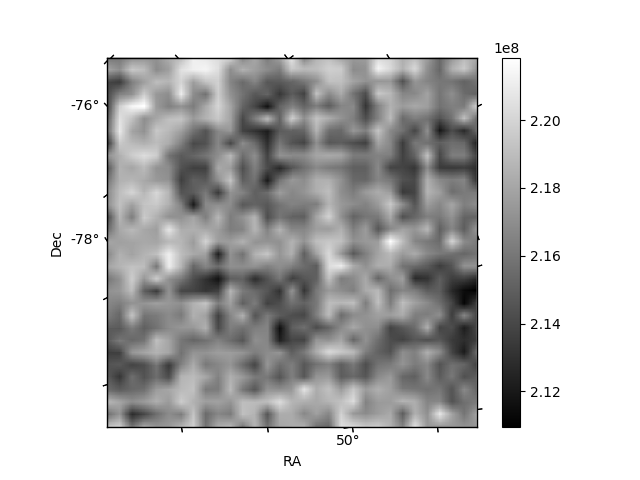
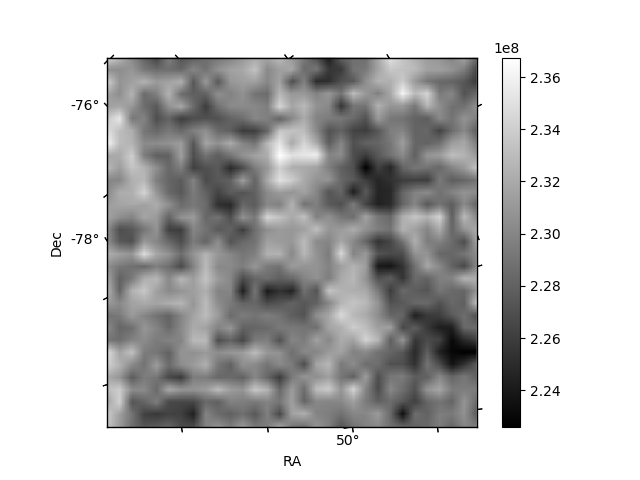
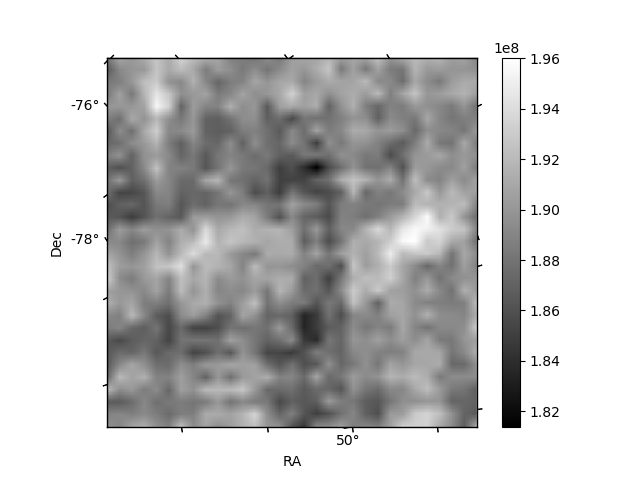
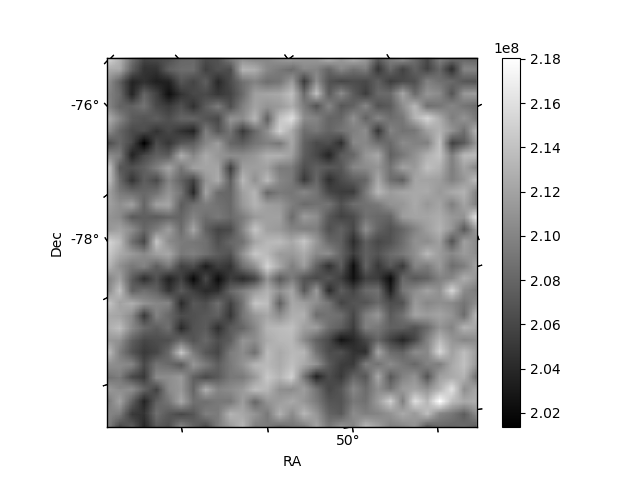
Histogram calculated using DETX and DETY for each event in the final _common_clean file
| Quadrant A | 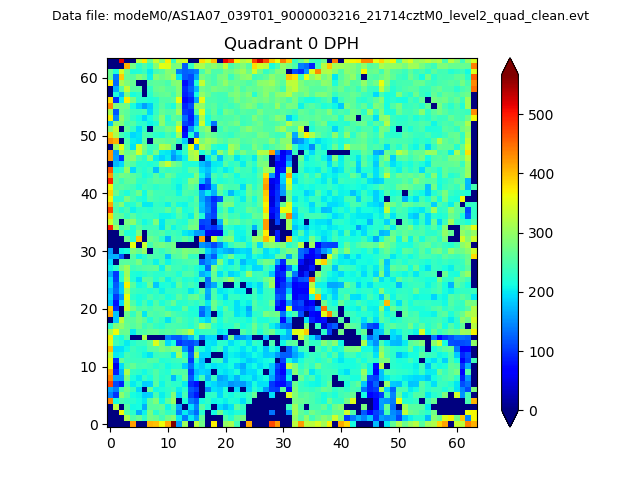 |
 |
Quadrant B |
|---|---|---|---|
| Quadrant D | 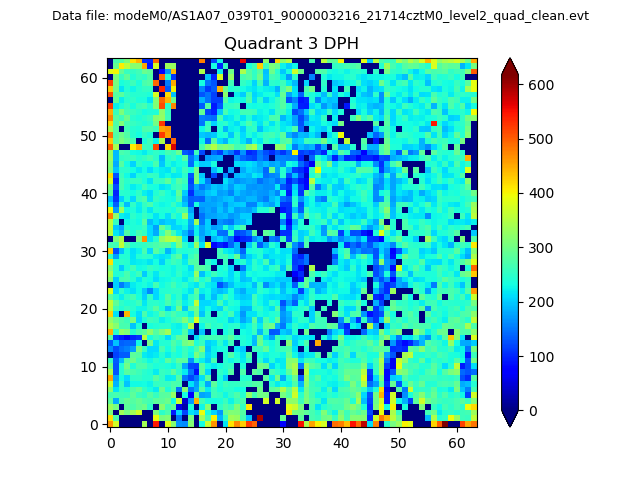 |
 |
Quadrant C |
| Plot type | Count rate plots | Images |
|---|---|---|
| Comparison with Poisson distribution Blue bars denote a histogram of data divided into 1 sec bins. Red curve is a Poisson curve with rate = median count rate of data. |
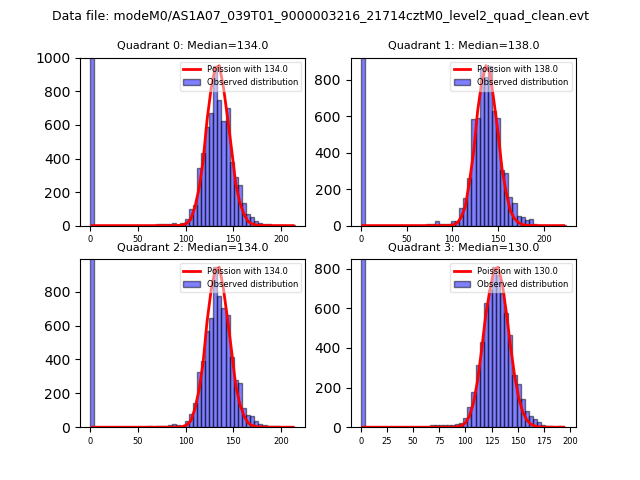 |
 |
| Quadrant-wise count rates Data is divided into 100 sec bins |
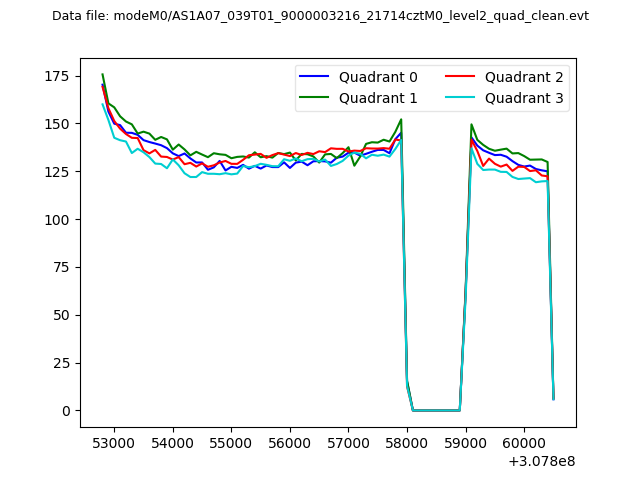 |
|
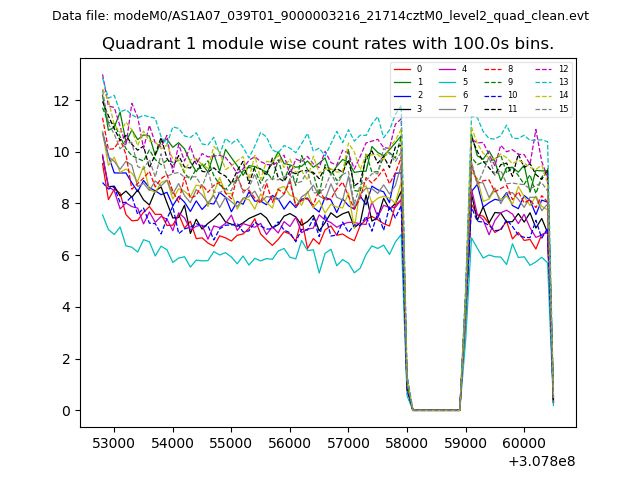
| Module-wise count rates for Quadrant A Data is divided into 100 sec bins |
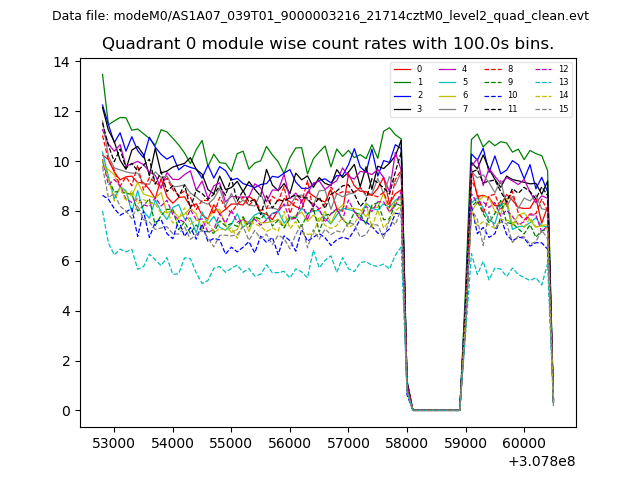 |
 |
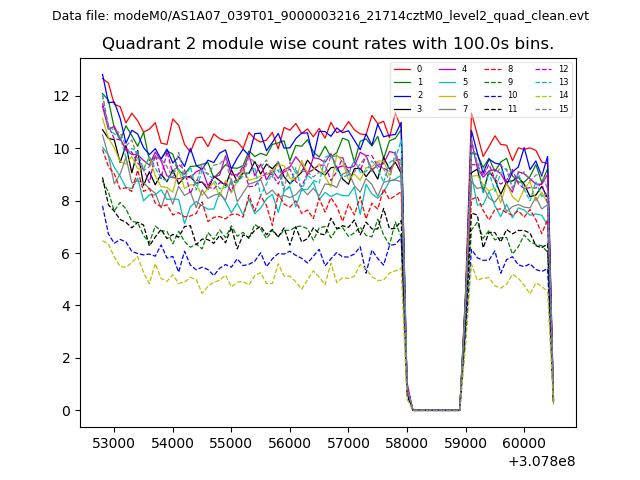
| Module-wise count rates for Quadrant B Data is divided into 100 sec bins |
 |
 |
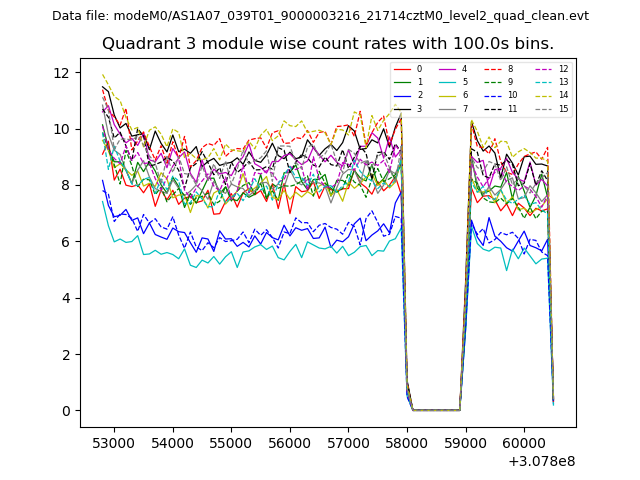
| Module-wise count rates for Quadrant C Data is divided into 100 sec bins |
 |
 |
| Module-wise count rates for Quadrant D Data is divided into 100 sec bins |
 |
 |
| Parameter | Plot |
|---|---|
| CZT HV Monitor | 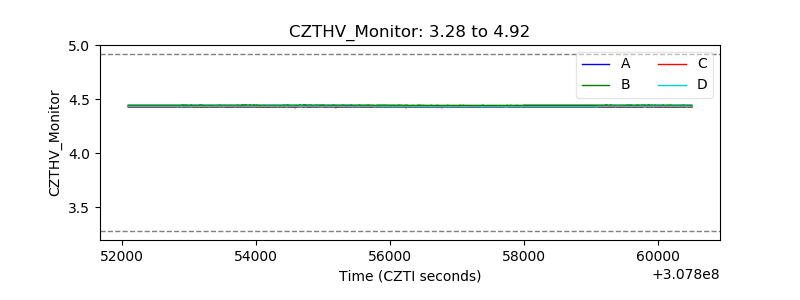 |
| D_VDD | 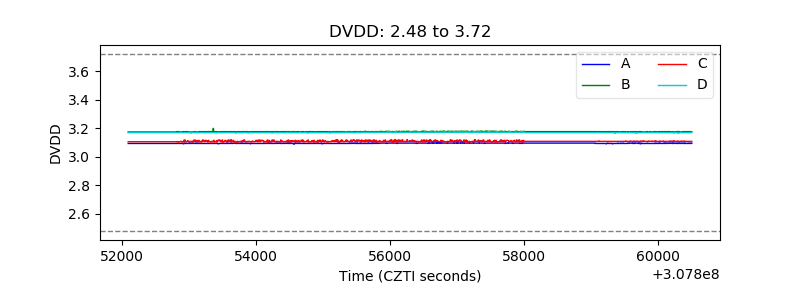 |
| Temperature 1 | 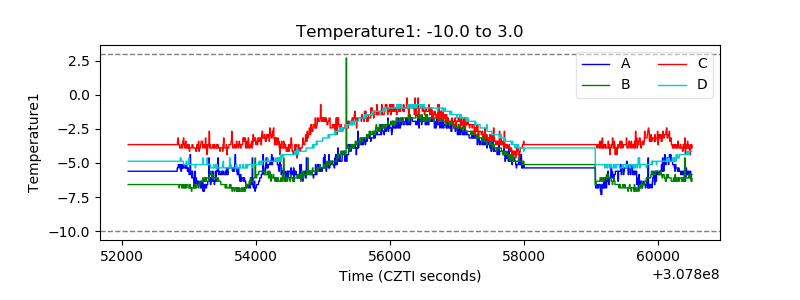 |
| Veto HV Monitor | 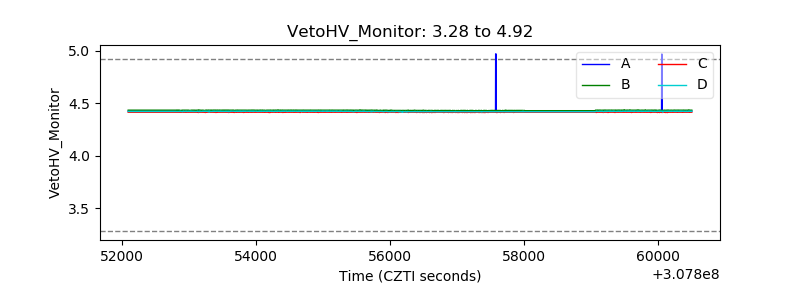 |
| Veto LLD |  |
| Alpha Counter | 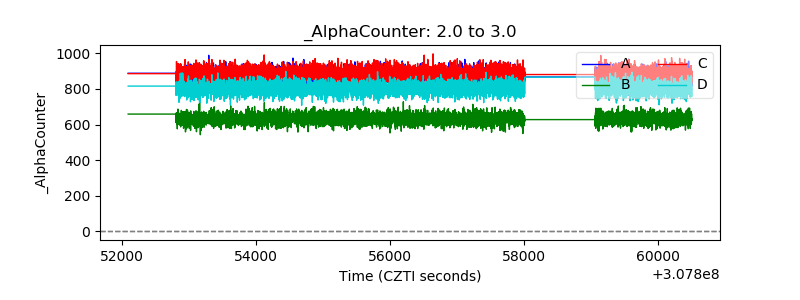 |
| _CPM_Rate | 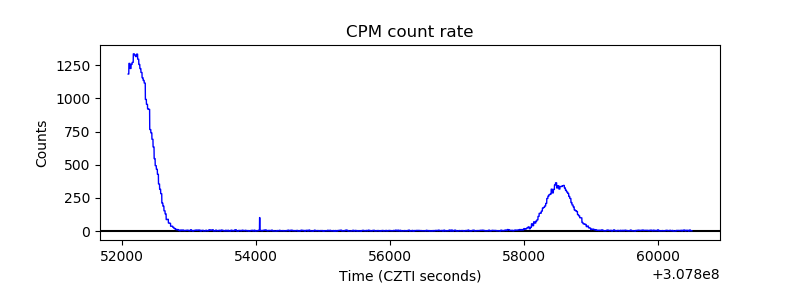 |
| CZT Counter | 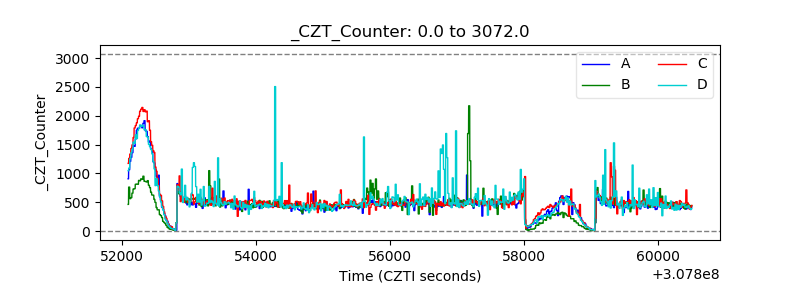 |
| +2.5 Volts monitor |  |
| +5 Volts monitor |  |
| _ROLL_ROT | 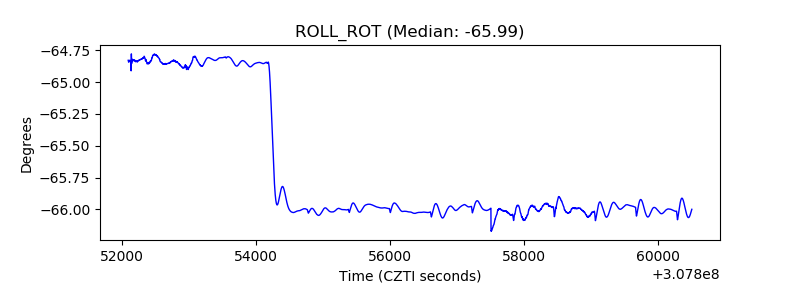 |
| _Roll_DEC | 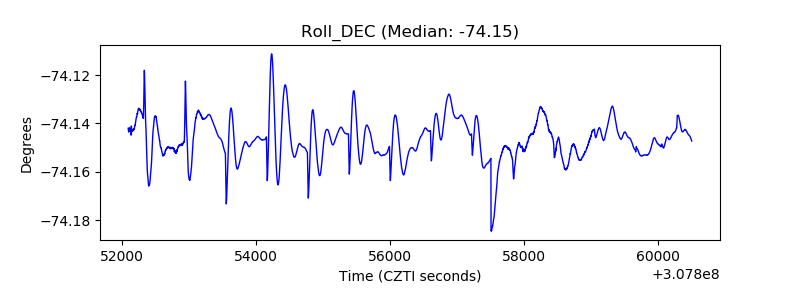 |
| _Roll_RA | 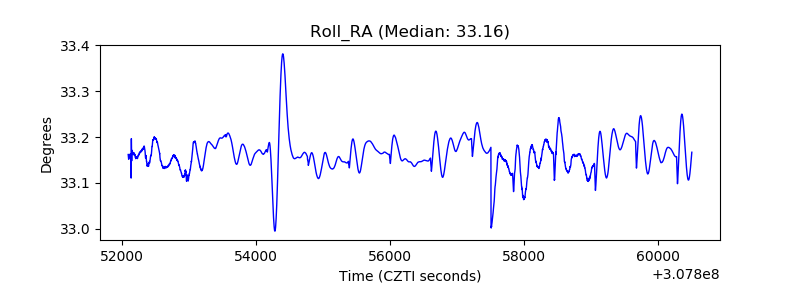 |
| Veto Counter | 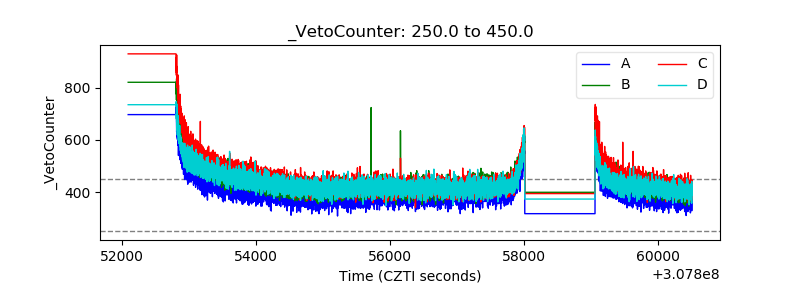 |