| Param | Original file | Final file |
|---|---|---|
| Filename | modeM0/AS1A07_039T01_9000003216_21715cztM0_level2.evt | modeM0/AS1A07_039T01_9000003216_21715cztM0_level2_quad_clean.evt |
| Size (bytes) | 530,184,960 | 132,390,720 |
| Size | 505.6 MB | 126.3 MB |
| Events in quadrant A | 3,161,781 | 890,631 |
| Events in quadrant B | 3,459,708 | 913,913 |
| Events in quadrant C | 4,119,527 | 879,375 |
| Events in quadrant D | 4,842,287 | 839,871 |
| Mode M0 | |||
|---|---|---|---|
| Quadrant | BADHDUFLAG | Total packets | Discarded packets |
| A | 0 | 14156 | 2 |
| B | 0 | 14721 | 2 |
| C | 0 | 16724 | 2 |
| D | 0 | 19146 | 2 |
| Mode M9 | |||
|---|---|---|---|
| Quadrant | BADHDUFLAG | Total packets | Discarded packets |
| A | 0 | 11 | 0 |
| B | 0 | 12 | 0 |
| C | 0 | 12 | 0 |
| D | 0 | 12 | 0 |
| Mode SS | |||
|---|---|---|---|
| Quadrant | BADHDUFLAG | Total packets | Discarded packets |
| A | 0 | 144 | 0 |
| B | 0 | 144 | 0 |
| C | 0 | 144 | 0 |
| D | 0 | 144 | 0 |
| Quadrant | Total seconds | Saturated seconds | Saturation percentage |
|---|---|---|---|
| A | 6966 | 66 | 0.947459% |
| B | 6966 | 122 | 1.751364% |
| C | 6966 | 267 | 3.832903% |
| D | 6966 | 435 | 6.244617% |
Noise dominated data is calculated using 1-second bins in cleaned event files. If a bin has >2000 counts, and if more than 50% of those come from <1% of pixels, then it is considered to be noise-dominated and hence unusable.
| Quadrant | # 1 sec bins | Bins with >0 counts | Bins with >2000 counts | High rate bins dominated by noise | Noise dominated (total time) | Noise dominated (detector-on time) | Marked lightcurve |
|---|---|---|---|---|---|---|---|
| A | 7636 | 6968 | 0 | 0 | 0.00% | 0.00% | 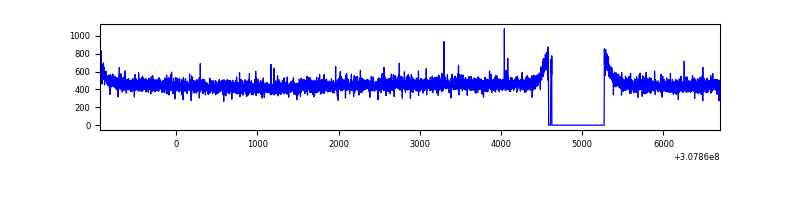 |
| B | 7636 | 6968 | 13 | 13 | 0.17% | 0.19% | 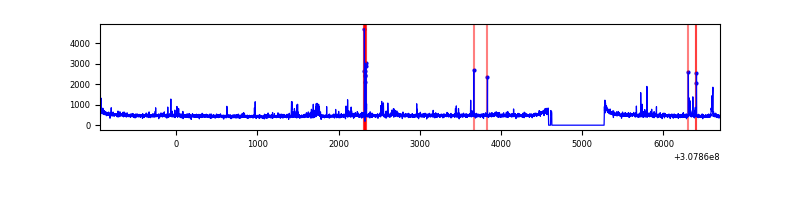 |
| C | 7636 | 6968 | 60 | 60 | 0.79% | 0.86% | 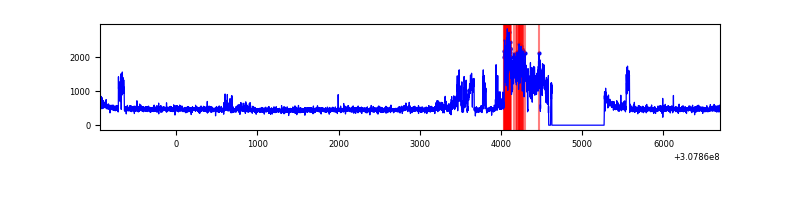 |
| D | 7636 | 6968 | 358 | 358 | 4.69% | 5.14% | 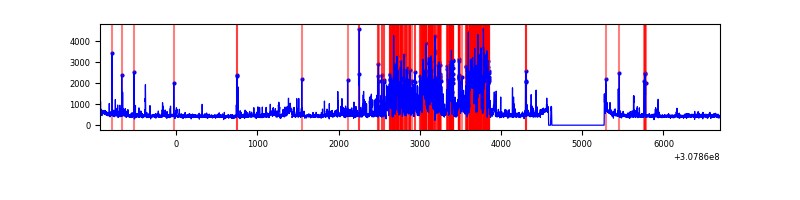 |
Top three noisy pixels from each quadrant. If the there are fewer than three noisy pixels in the level2.evt file, extra rows are filled as -1
| Pixel properties | Quadrant properties | ||||||
|---|---|---|---|---|---|---|---|
| Quadrant | DetID | PixID | Counts | Sigma | Mean | Median | Sigma |
| A | 13 | 254 | 12488 | 70.2 | 819 | 799 | 166.5 |
| A | 0 | 226 | 7006 | 37.28 | 819 | 799 | 166.5 |
| A | 3 | 137 | 6631 | 35.02 | 819 | 799 | 166.5 |
| B | 3 | 64 | 103573 | 665.4 | 822 | 800 | 154.5 |
| B | 0 | 230 | 38969 | 247.12 | 822 | 800 | 154.5 |
| B | 0 | 189 | 34046 | 215.25 | 822 | 800 | 154.5 |
| C | 8 | 208 | 884867 | 4784.52 | 796 | 800 | 184.8 |
| C | 14 | 238 | 125519 | 674.97 | 796 | 800 | 184.8 |
| C | 13 | 61 | 5560 | 25.76 | 796 | 800 | 184.8 |
| D | 13 | 153 | 1033963 | 5475.96 | 790 | 766 | 188.7 |
| D | 12 | 235 | 469353 | 2483.52 | 790 | 766 | 188.7 |
| D | 1 | 52 | 115659 | 608.93 | 790 | 766 | 188.7 |
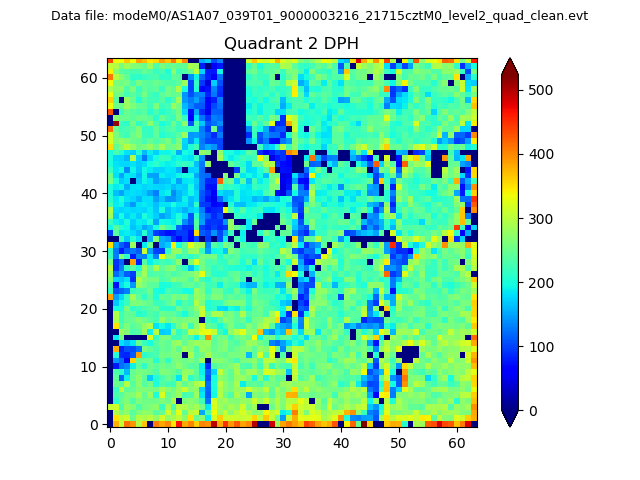
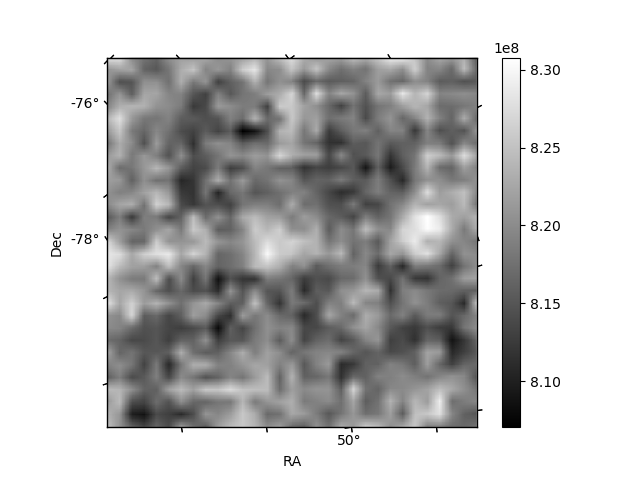
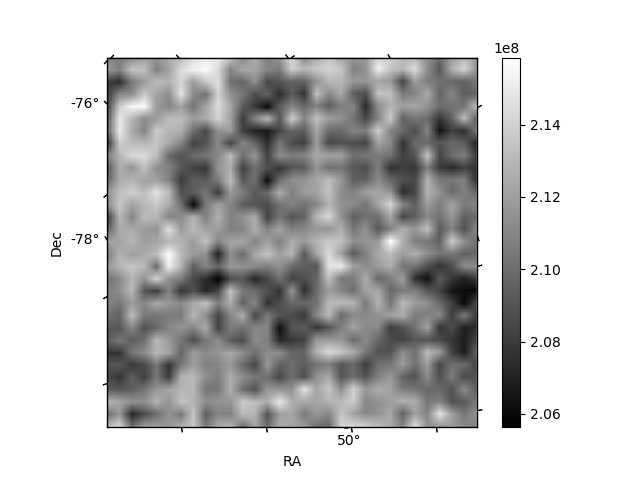
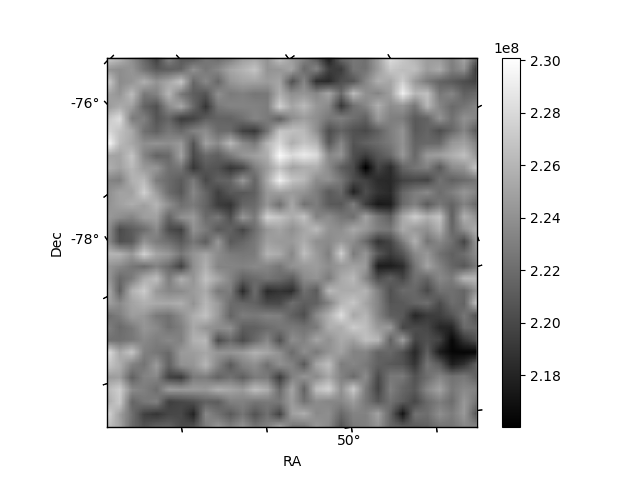
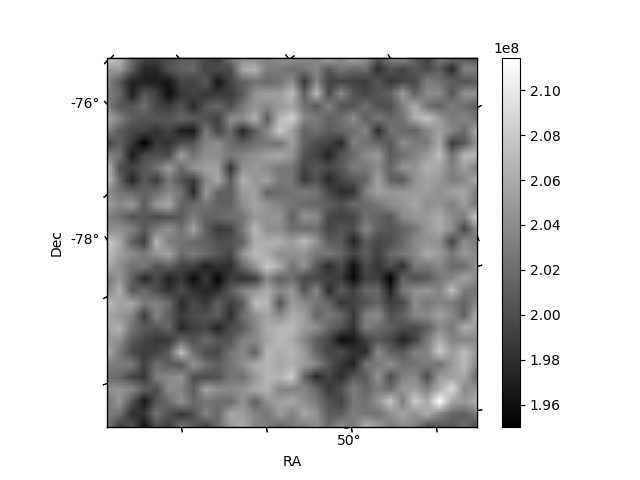
Histogram calculated using DETX and DETY for each event in the final _common_clean file
| Quadrant A | 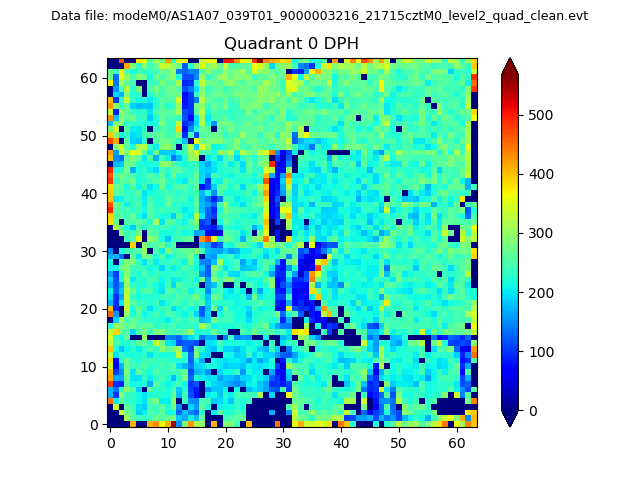 |
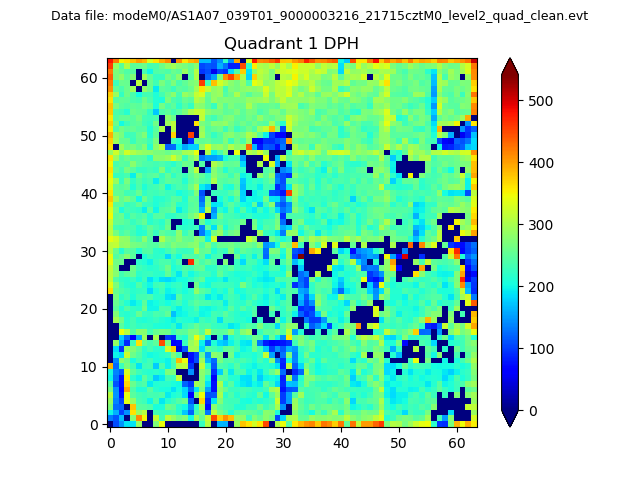 |
Quadrant B |
|---|---|---|---|
| Quadrant D | 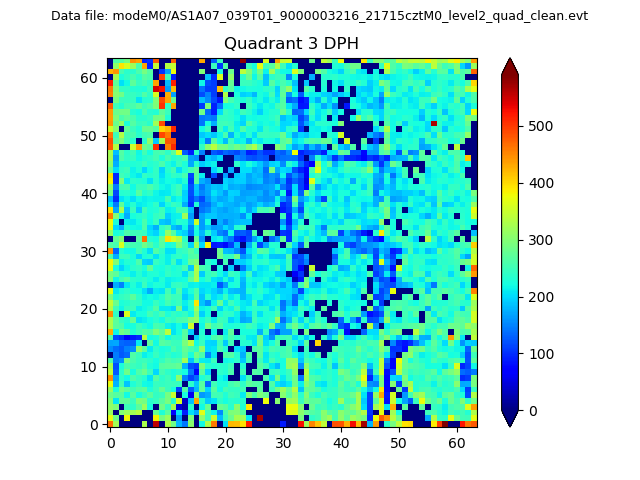 |
 |
Quadrant C |
| Plot type | Count rate plots | Images |
|---|---|---|
| Comparison with Poisson distribution Blue bars denote a histogram of data divided into 1 sec bins. Red curve is a Poisson curve with rate = median count rate of data. |
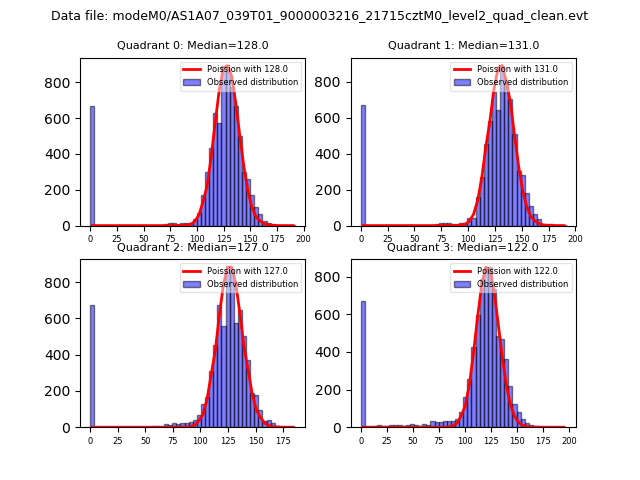 |
 |
| Quadrant-wise count rates Data is divided into 100 sec bins |
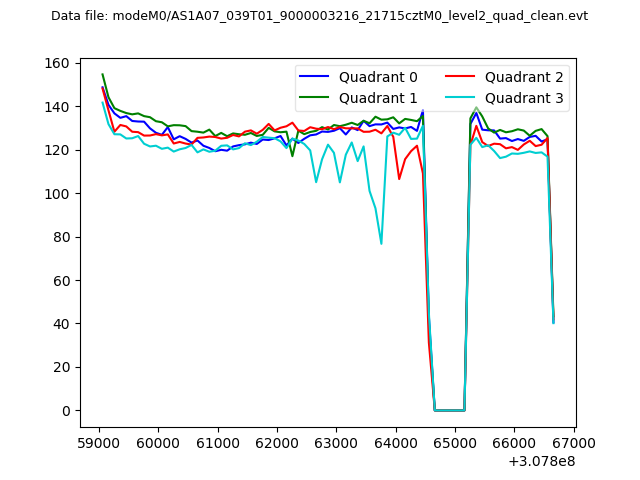 |
|
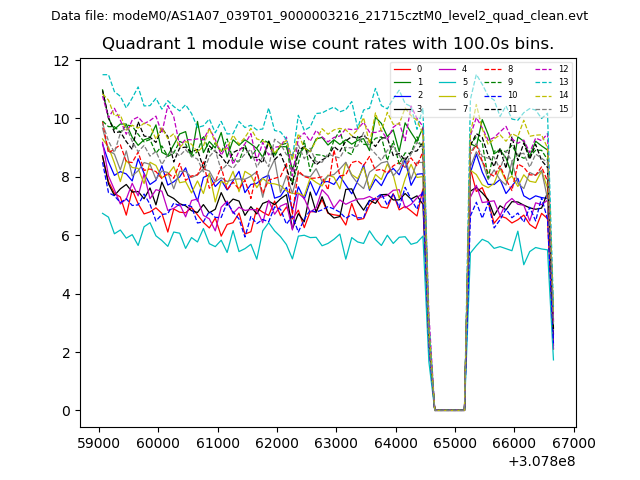
| Module-wise count rates for Quadrant A Data is divided into 100 sec bins |
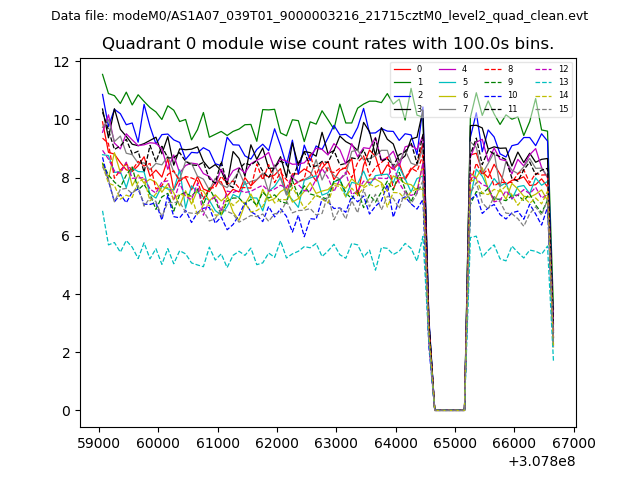 |
 |
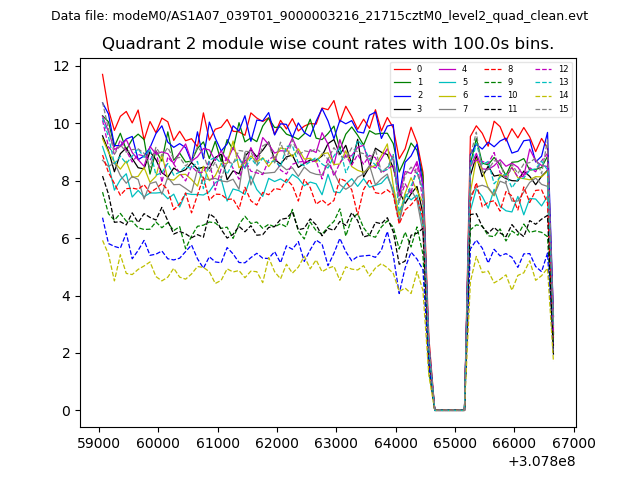
| Module-wise count rates for Quadrant B Data is divided into 100 sec bins |
 |
 |
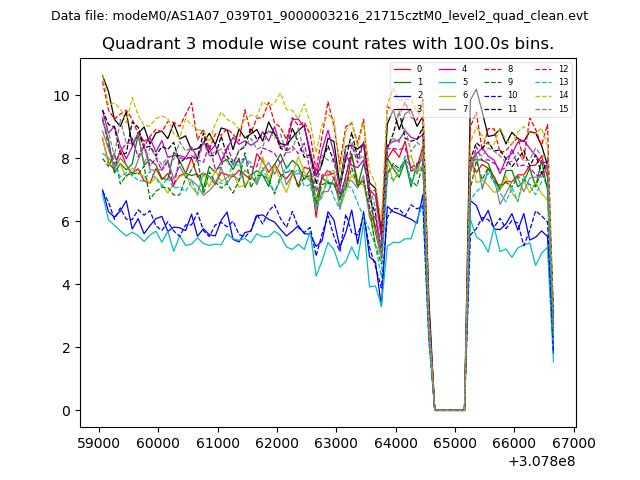
| Module-wise count rates for Quadrant C Data is divided into 100 sec bins |
 |
 |
| Module-wise count rates for Quadrant D Data is divided into 100 sec bins |
 |
 |
| Parameter | Plot |
|---|---|
| CZT HV Monitor | 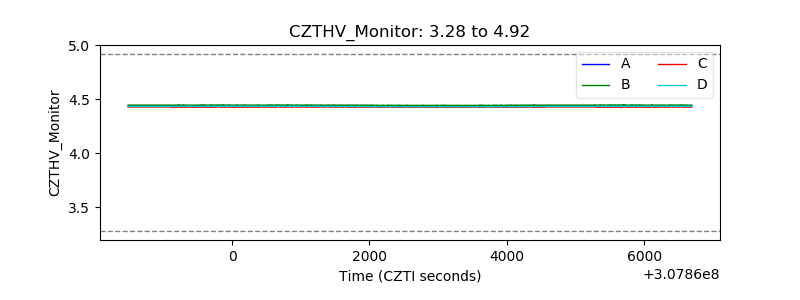 |
| D_VDD | 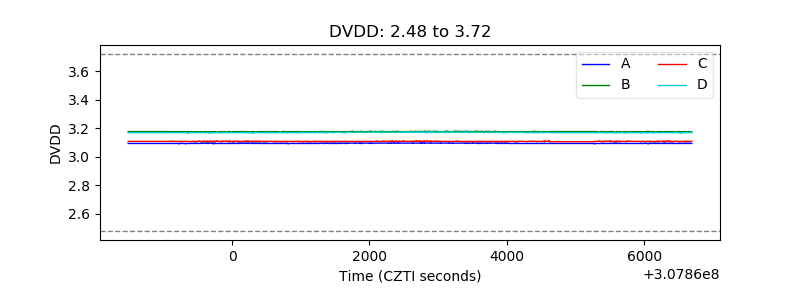 |
| Temperature 1 | 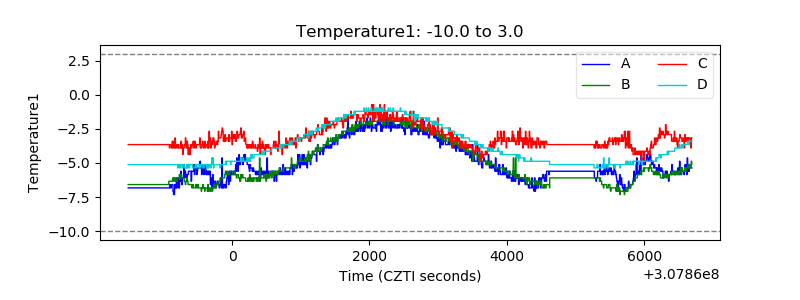 |
| Veto HV Monitor | 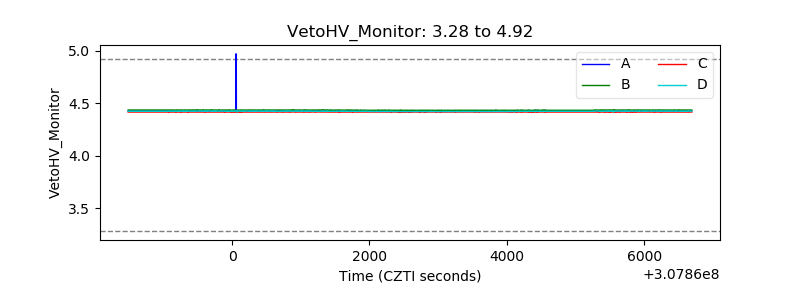 |
| Veto LLD |  |
| Alpha Counter | 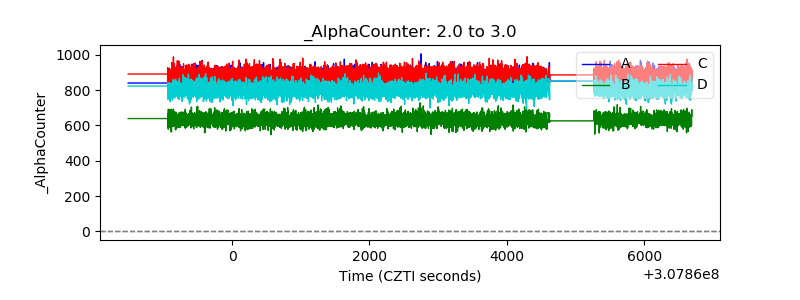 |
| _CPM_Rate | 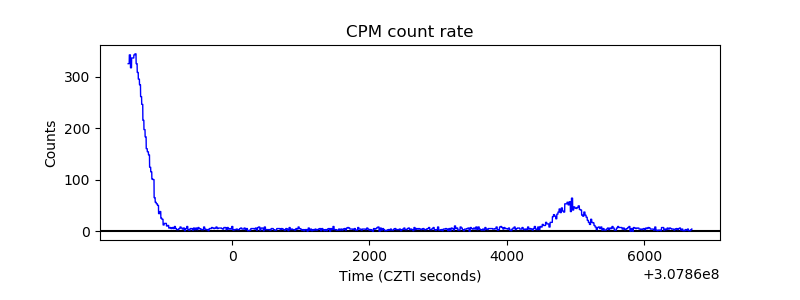 |
| CZT Counter | 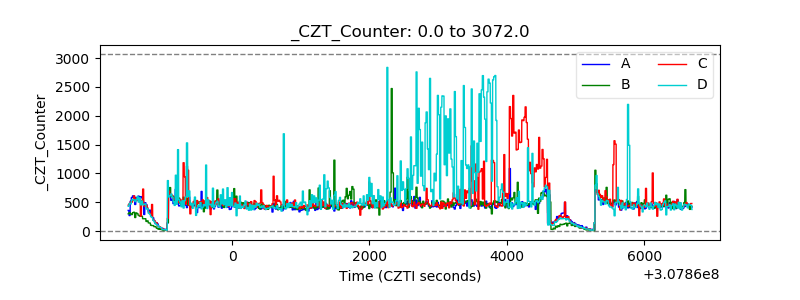 |
| +2.5 Volts monitor |  |
| +5 Volts monitor |  |
| _ROLL_ROT | 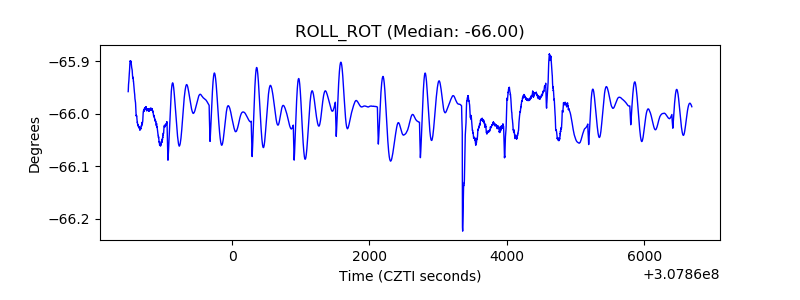 |
| _Roll_DEC | 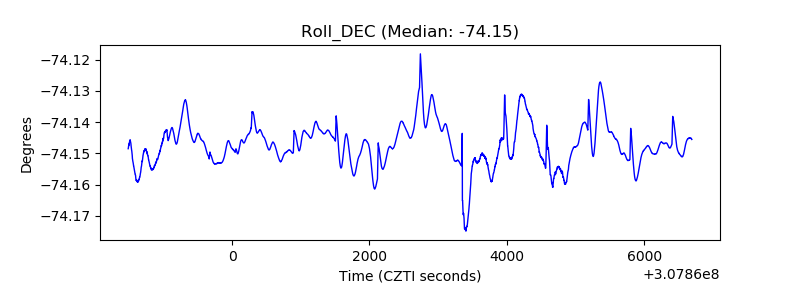 |
| _Roll_RA | 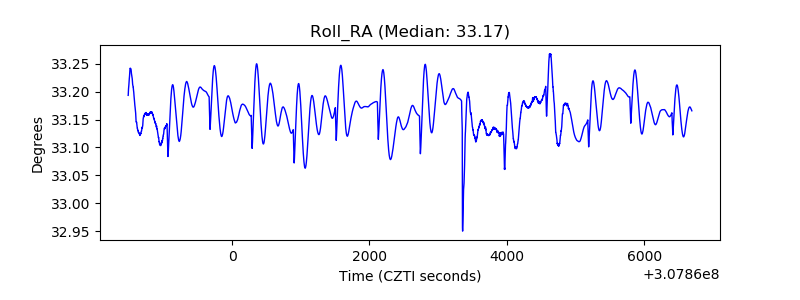 |
| Veto Counter | 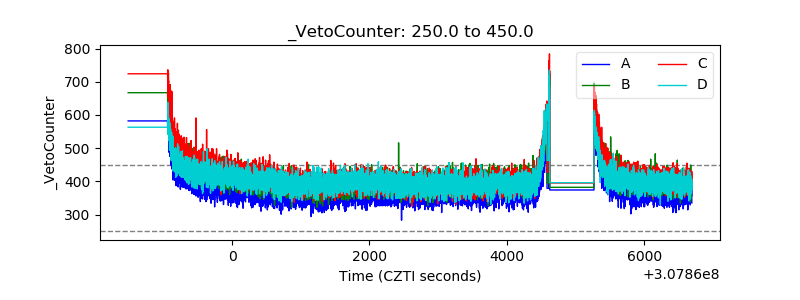 |