| Param | Original file | Final file |
|---|---|---|
| Filename | modeM0/AS1A07_039T01_9000003216_21716cztM0_level2.evt | modeM0/AS1A07_039T01_9000003216_21716cztM0_level2_quad_clean.evt |
| Size (bytes) | 494,225,280 | 127,186,560 |
| Size | 471.3 MB | 121.3 MB |
| Events in quadrant A | 3,103,732 | 846,932 |
| Events in quadrant B | 3,565,929 | 865,536 |
| Events in quadrant C | 4,306,384 | 839,126 |
| Events in quadrant D | 3,527,284 | 824,092 |
| Mode M0 | |||
|---|---|---|---|
| Quadrant | BADHDUFLAG | Total packets | Discarded packets |
| A | 0 | 13961 | 1 |
| B | 0 | 15085 | 1 |
| C | 0 | 17236 | 1 |
| D | 0 | 15150 | 1 |
| Mode M9 | |||
|---|---|---|---|
| Quadrant | BADHDUFLAG | Total packets | Discarded packets |
| A | 0 | 3 | 0 |
| B | 0 | 3 | 0 |
| C | 0 | 3 | 0 |
| D | 0 | 3 | 0 |
| Mode SS | |||
|---|---|---|---|
| Quadrant | BADHDUFLAG | Total packets | Discarded packets |
| A | 0 | 138 | 0 |
| B | 0 | 138 | 0 |
| C | 0 | 138 | 0 |
| D | 0 | 138 | 0 |
| Quadrant | Total seconds | Saturated seconds | Saturation percentage |
|---|---|---|---|
| A | 6838 | 126 | 1.842644% |
| B | 6839 | 192 | 2.807428% |
| C | 6839 | 250 | 3.655505% |
| D | 6839 | 178 | 2.602720% |
Noise dominated data is calculated using 1-second bins in cleaned event files. If a bin has >2000 counts, and if more than 50% of those come from <1% of pixels, then it is considered to be noise-dominated and hence unusable.
| Quadrant | # 1 sec bins | Bins with >0 counts | Bins with >2000 counts | High rate bins dominated by noise | Noise dominated (total time) | Noise dominated (detector-on time) | Marked lightcurve |
|---|---|---|---|---|---|---|---|
| A | 7138 | 6839 | 0 | 0 | 0.00% | 0.00% | 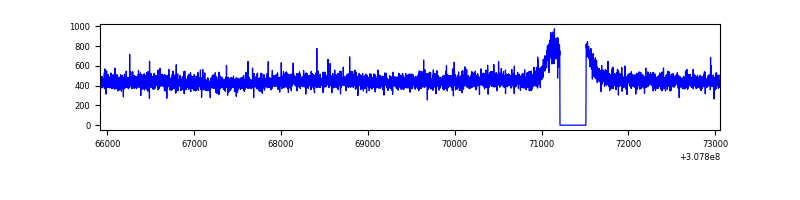 |
| B | 7139 | 6840 | 32 | 32 | 0.45% | 0.47% | 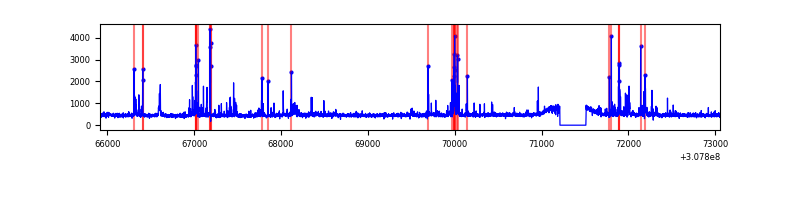 |
| C | 7139 | 6840 | 10 | 10 | 0.14% | 0.15% | 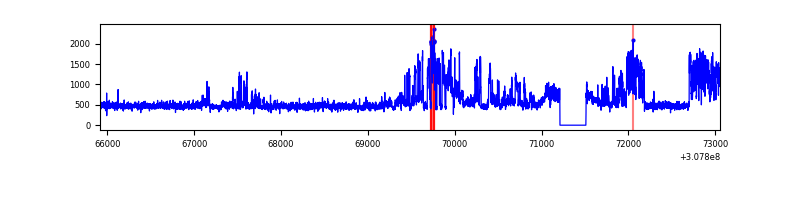 |
| D | 7139 | 6840 | 42 | 42 | 0.59% | 0.61% | 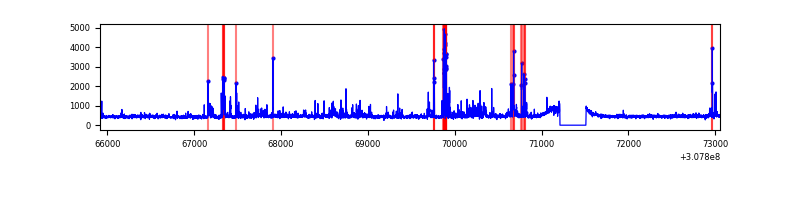 |
Top three noisy pixels from each quadrant. If the there are fewer than three noisy pixels in the level2.evt file, extra rows are filled as -1
| Pixel properties | Quadrant properties | ||||||
|---|---|---|---|---|---|---|---|
| Quadrant | DetID | PixID | Counts | Sigma | Mean | Median | Sigma |
| A | 13 | 254 | 11694 | 67.2 | 802 | 783 | 162.4 |
| A | 0 | 226 | 6937 | 37.9 | 802 | 783 | 162.4 |
| A | 3 | 137 | 6625 | 35.98 | 802 | 783 | 162.4 |
| B | 3 | 64 | 238632 | 1555.39 | 799 | 776 | 152.9 |
| B | 6 | 36 | 91423 | 592.76 | 799 | 776 | 152.9 |
| B | 0 | 189 | 29786 | 189.7 | 799 | 776 | 152.9 |
| C | 8 | 208 | 1138654 | 6268.02 | 779 | 782 | 181.5 |
| C | 14 | 238 | 122174 | 668.69 | 779 | 782 | 181.5 |
| C | 13 | 61 | 5297 | 24.87 | 779 | 782 | 181.5 |
| D | 13 | 153 | 238157 | 1250.72 | 788 | 765 | 189.8 |
| D | 1 | 52 | 107207 | 560.8 | 788 | 765 | 189.8 |
| D | 7 | 238 | 59340 | 308.61 | 788 | 765 | 189.8 |
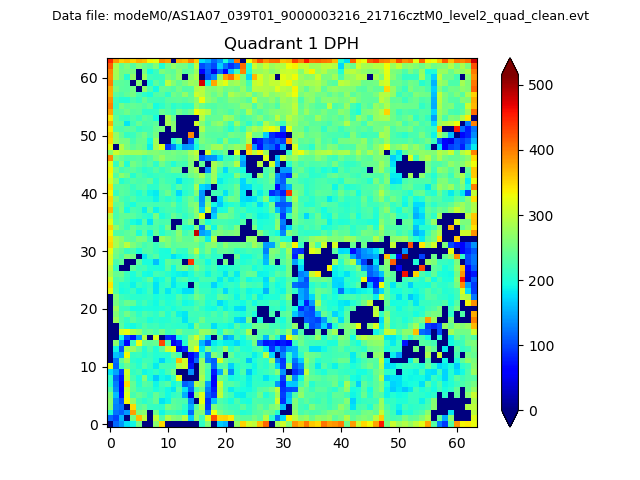
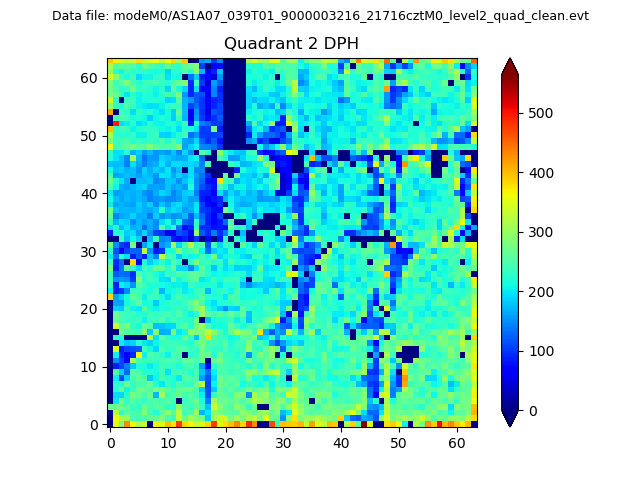
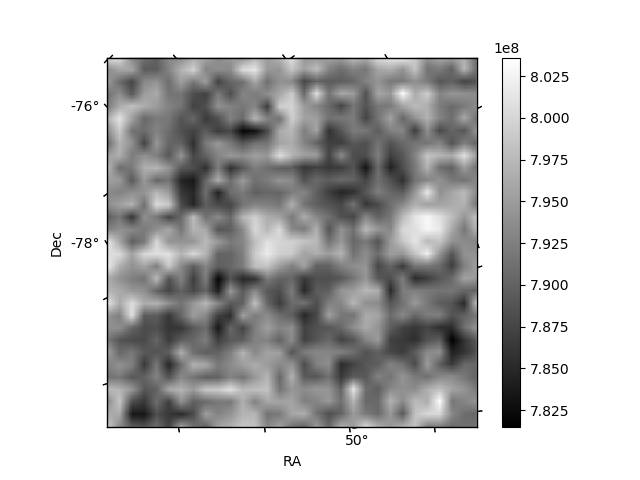
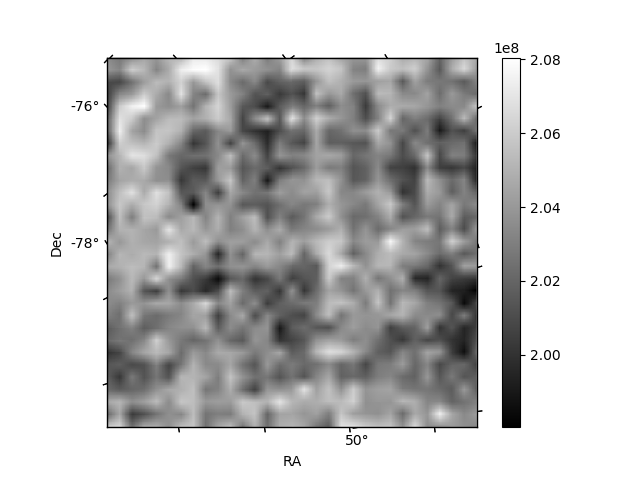
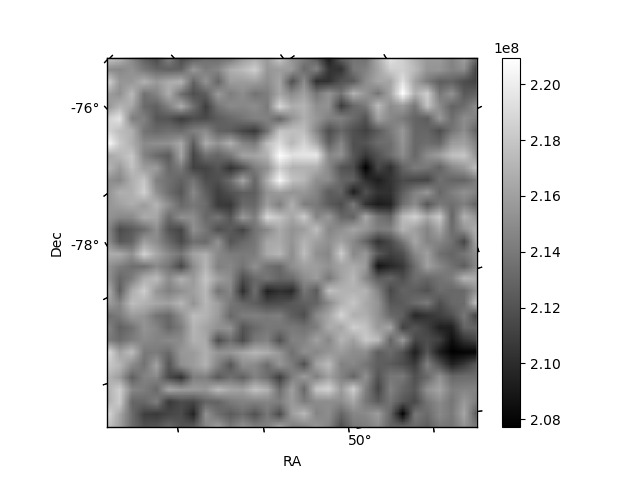
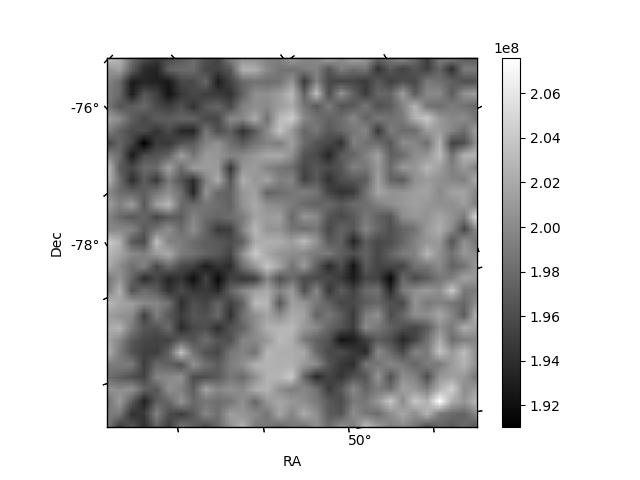
Histogram calculated using DETX and DETY for each event in the final _common_clean file
| Quadrant A |  |
 |
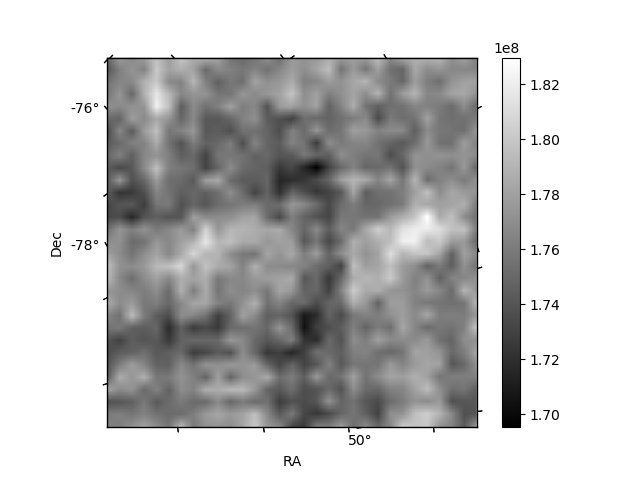
Quadrant B |
|---|---|---|---|
| Quadrant D | 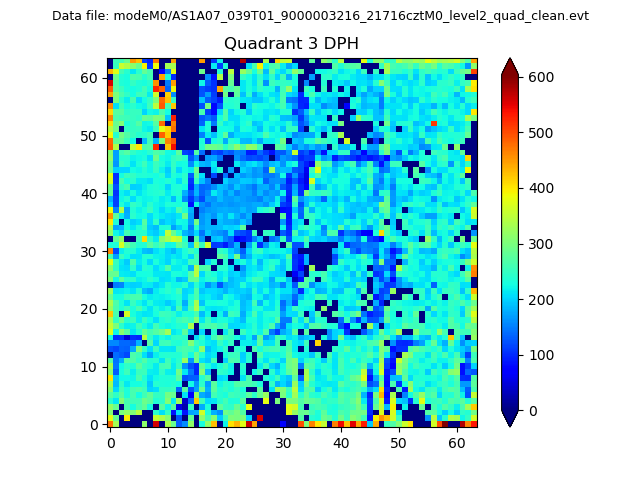 |
 |
Quadrant C |
| Plot type | Count rate plots | Images |
|---|---|---|
| Comparison with Poisson distribution Blue bars denote a histogram of data divided into 1 sec bins. Red curve is a Poisson curve with rate = median count rate of data. |
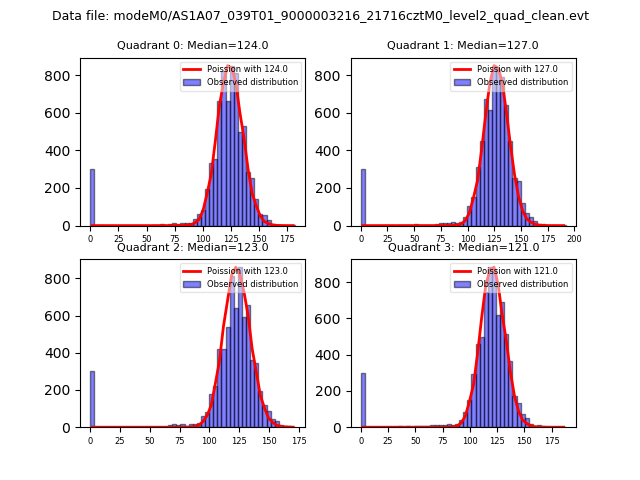 |
 |
| Quadrant-wise count rates Data is divided into 100 sec bins |
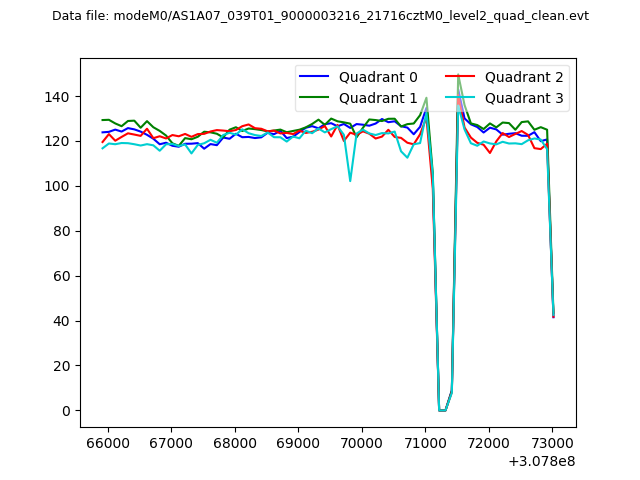 |
|
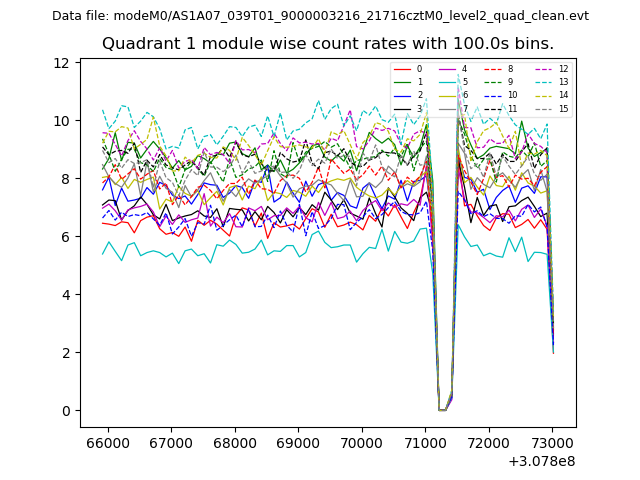
| Module-wise count rates for Quadrant A Data is divided into 100 sec bins |
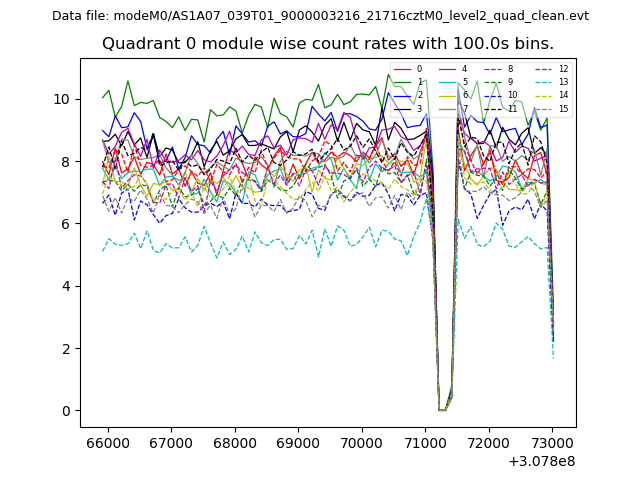 |
 |
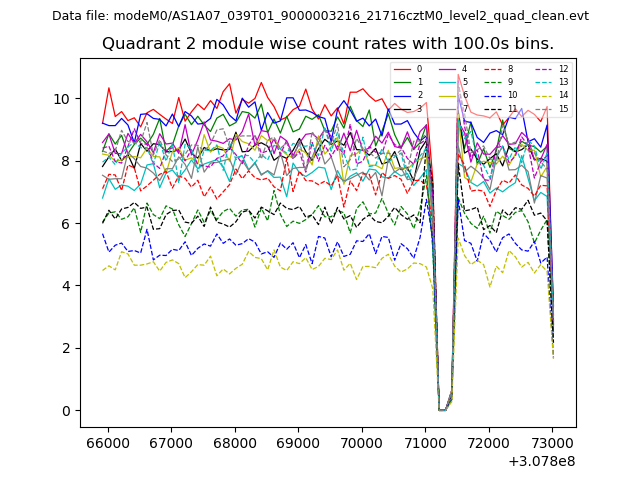
| Module-wise count rates for Quadrant B Data is divided into 100 sec bins |
 |
 |
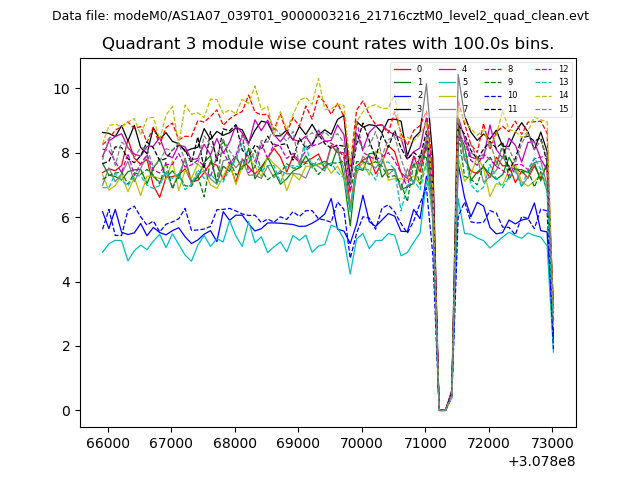
| Module-wise count rates for Quadrant C Data is divided into 100 sec bins |
 |
 |
| Module-wise count rates for Quadrant D Data is divided into 100 sec bins |
 |
 |
| Parameter | Plot |
|---|---|
| CZT HV Monitor | 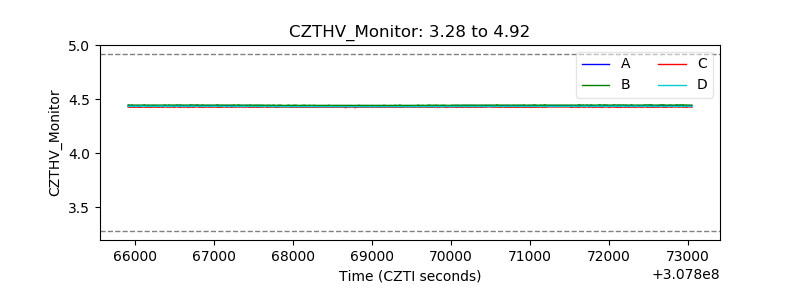 |
| D_VDD | 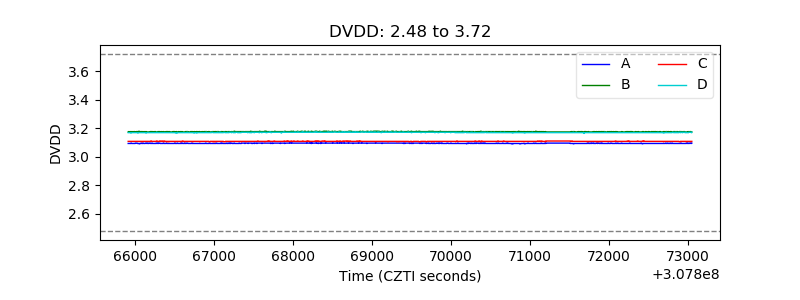 |
| Temperature 1 |  |
| Veto HV Monitor | 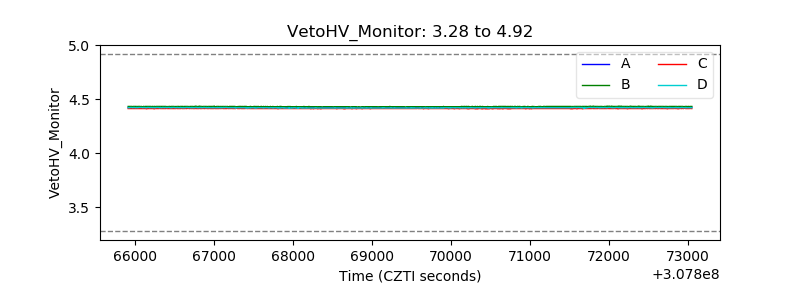 |
| Veto LLD | 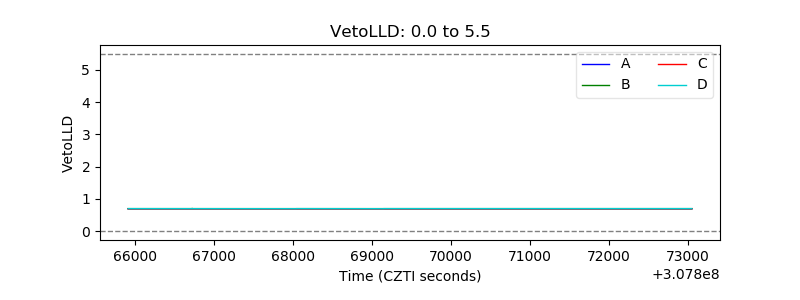 |
| Alpha Counter | 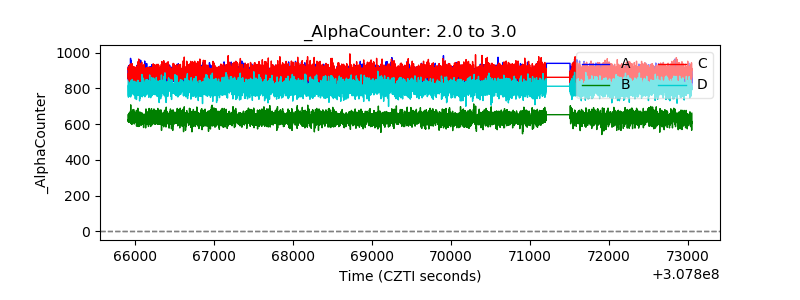 |
| _CPM_Rate | 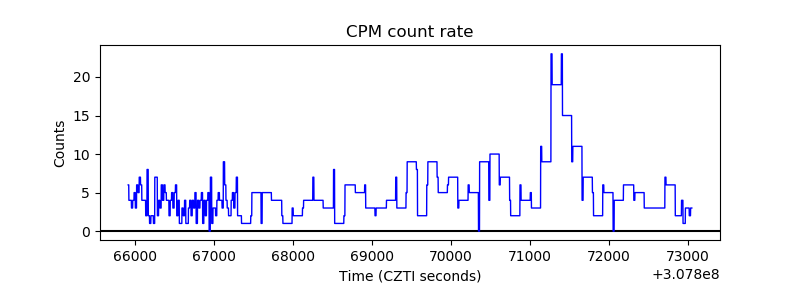 |
| CZT Counter | 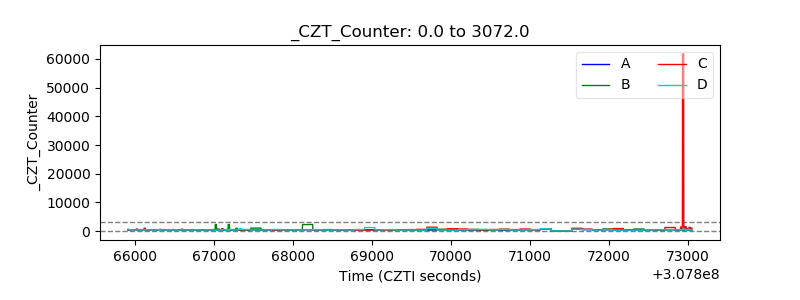 |
| +2.5 Volts monitor | 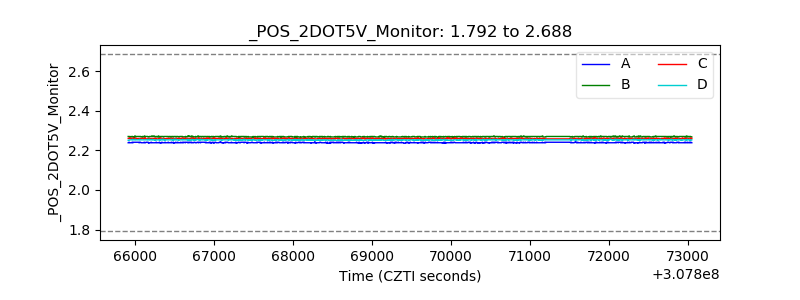 |
| +5 Volts monitor |  |
| _ROLL_ROT | 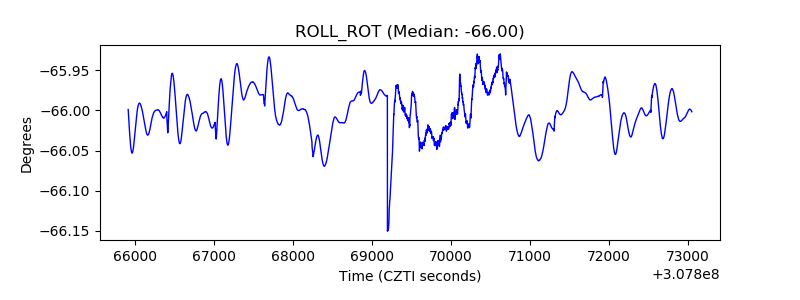 |
| _Roll_DEC | 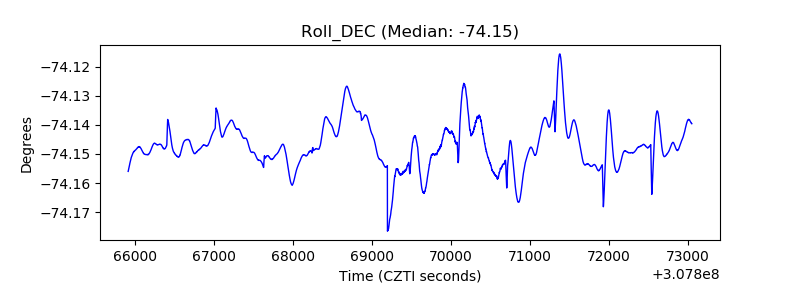 |
| _Roll_RA | 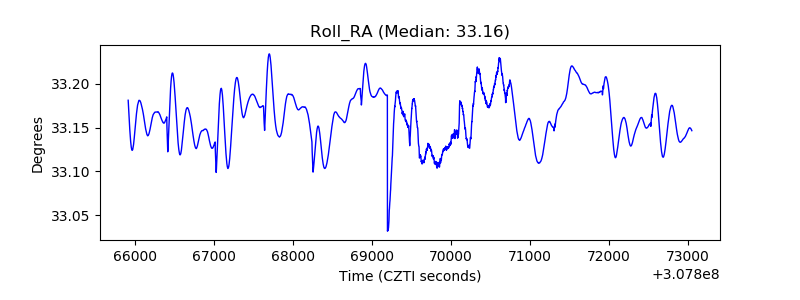 |
| Veto Counter | 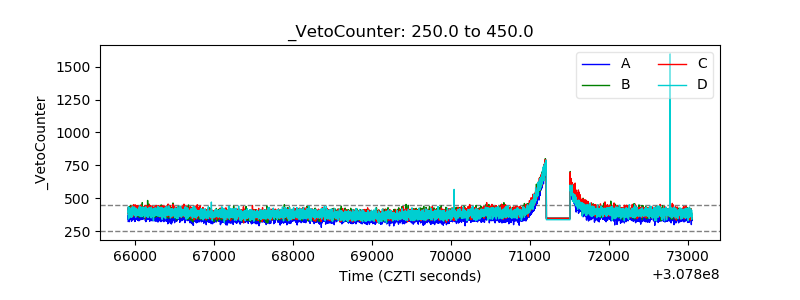 |