| Param | Original file | Final file |
|---|---|---|
| Filename | modeM0/AS1A07_039T01_9000003216_21720cztM0_level2.evt | modeM0/AS1A07_039T01_9000003216_21720cztM0_level2_quad_clean.evt |
| Size (bytes) | 1,568,854,080 | 380,698,560 |
| Size | 1.5 GB | 363.1 MB |
| Events in quadrant A | 9,723,249 | 2,533,971 |
| Events in quadrant B | 10,445,511 | 2,593,528 |
| Events in quadrant C | 13,166,385 | 2,515,237 |
| Events in quadrant D | 12,764,526 | 2,447,841 |
| Mode M0 | |||
|---|---|---|---|
| Quadrant | BADHDUFLAG | Total packets | Discarded packets |
| A | 0 | 43660 | 3 |
| B | 0 | 44873 | 3 |
| C | 0 | 53279 | 3 |
| D | 0 | 52073 | 3 |
| Mode M9 | |||
|---|---|---|---|
| Quadrant | BADHDUFLAG | Total packets | Discarded packets |
| A | 0 | 12 | 0 |
| B | 0 | 12 | 0 |
| C | 0 | 12 | 0 |
| D | 0 | 12 | 0 |
| Mode SS | |||
|---|---|---|---|
| Quadrant | BADHDUFLAG | Total packets | Discarded packets |
| A | 0 | 424 | 0 |
| B | 0 | 424 | 0 |
| C | 0 | 424 | 0 |
| D | 0 | 424 | 0 |
| Quadrant | Total seconds | Saturated seconds | Saturation percentage |
|---|---|---|---|
| A | 20918 | 539 | 2.576728% |
| B | 20918 | 512 | 2.447653% |
| C | 20919 | 1212 | 5.793776% |
| D | 20919 | 895 | 4.278407% |
Noise dominated data is calculated using 1-second bins in cleaned event files. If a bin has >2000 counts, and if more than 50% of those come from <1% of pixels, then it is considered to be noise-dominated and hence unusable.
| Quadrant | # 1 sec bins | Bins with >0 counts | Bins with >2000 counts | High rate bins dominated by noise | Noise dominated (total time) | Noise dominated (detector-on time) | Marked lightcurve |
|---|---|---|---|---|---|---|---|
| A | 22148 | 20920 | 158 | 158 | 0.71% | 0.76% | 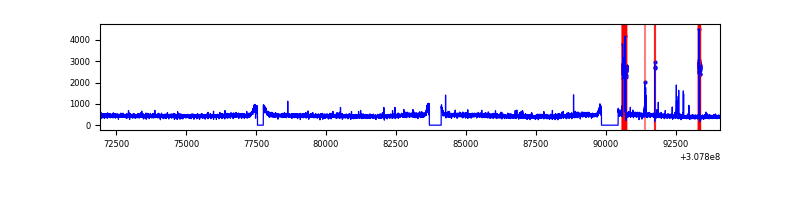 |
| B | 22148 | 20921 | 72 | 72 | 0.33% | 0.34% | 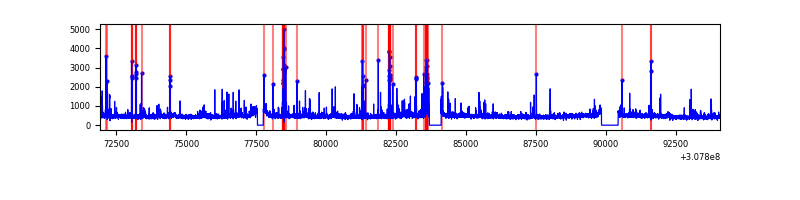 |
| C | 22149 | 20921 | 609 | 609 | 2.75% | 2.91% | 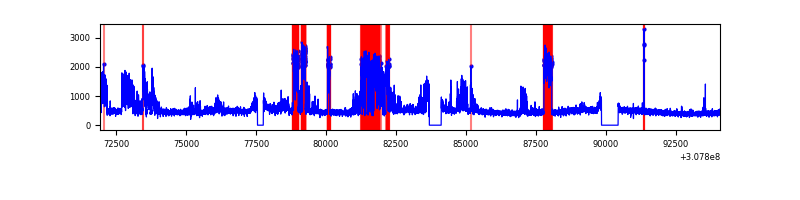 |
| D | 22149 | 20922 | 458 | 458 | 2.07% | 2.19% | 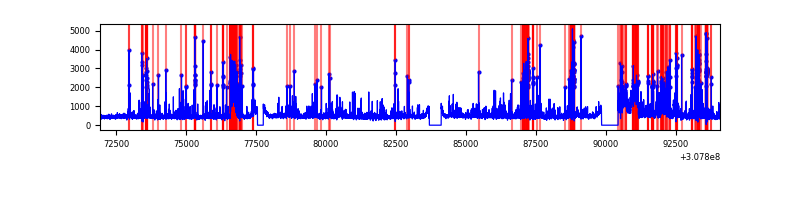 |
Top three noisy pixels from each quadrant. If the there are fewer than three noisy pixels in the level2.evt file, extra rows are filled as -1
| Pixel properties | Quadrant properties | ||||||
|---|---|---|---|---|---|---|---|
| Quadrant | DetID | PixID | Counts | Sigma | Mean | Median | Sigma |
| A | 15 | 236 | 407596 | 843.97 | 2407 | 2352 | 480.2 |
| A | 13 | 254 | 35393 | 68.81 | 2407 | 2352 | 480.2 |
| A | 10 | 253 | 22257 | 41.45 | 2407 | 2352 | 480.2 |
| B | 3 | 64 | 571661 | 1242.66 | 2417 | 2350 | 458.1 |
| B | 0 | 230 | 115186 | 246.29 | 2417 | 2350 | 458.1 |
| B | 0 | 197 | 96534 | 205.58 | 2417 | 2350 | 458.1 |
| C | 8 | 208 | 3658396 | 6764.18 | 2329 | 2336 | 540.5 |
| C | 14 | 238 | 365414 | 671.74 | 2329 | 2336 | 540.5 |
| C | 10 | 23 | 29706 | 50.64 | 2329 | 2336 | 540.5 |
| D | 1 | 52 | 1691169 | 2992.82 | 2351 | 2282 | 564.3 |
| D | 13 | 153 | 675969 | 1193.82 | 2351 | 2282 | 564.3 |
| D | 1 | 20 | 546819 | 964.96 | 2351 | 2282 | 564.3 |
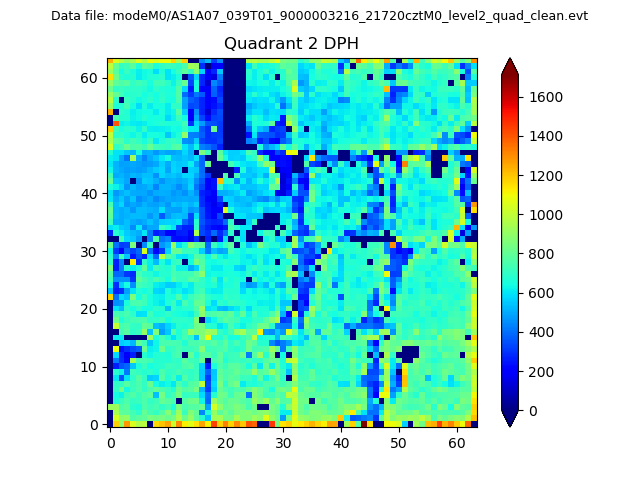
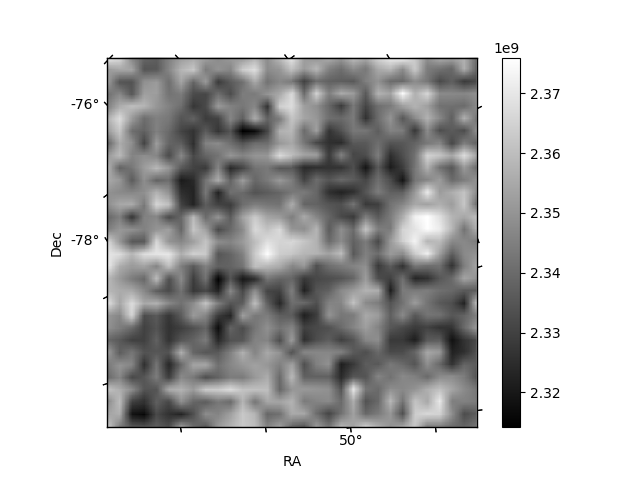
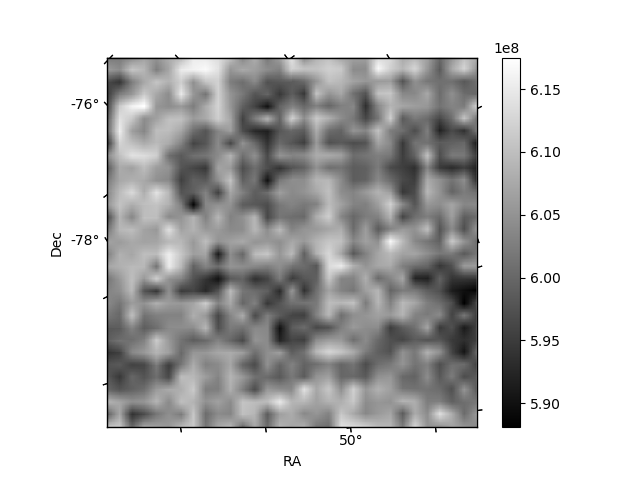
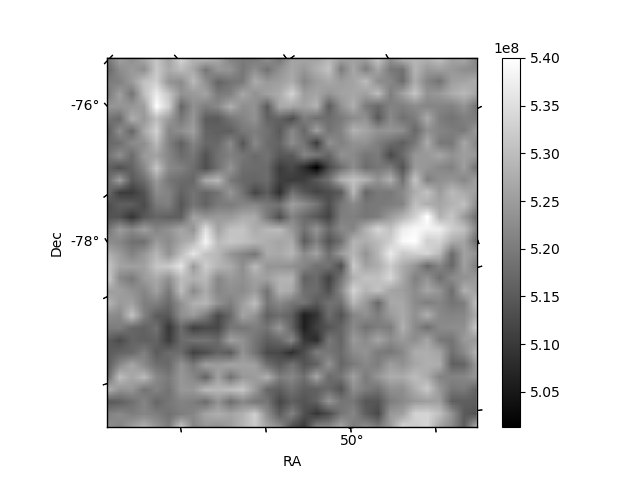
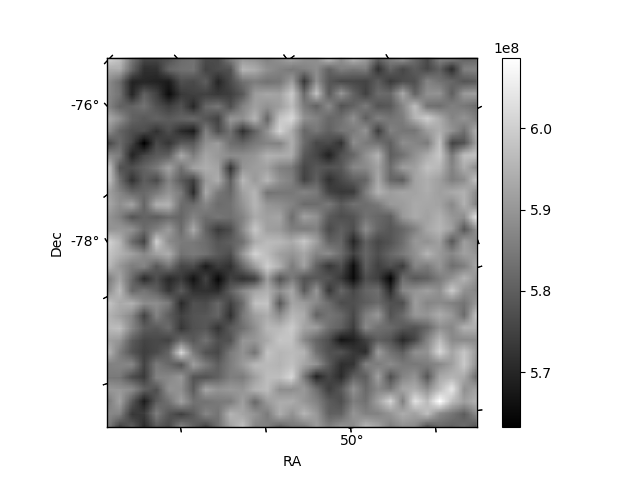
Histogram calculated using DETX and DETY for each event in the final _common_clean file
| Quadrant A | 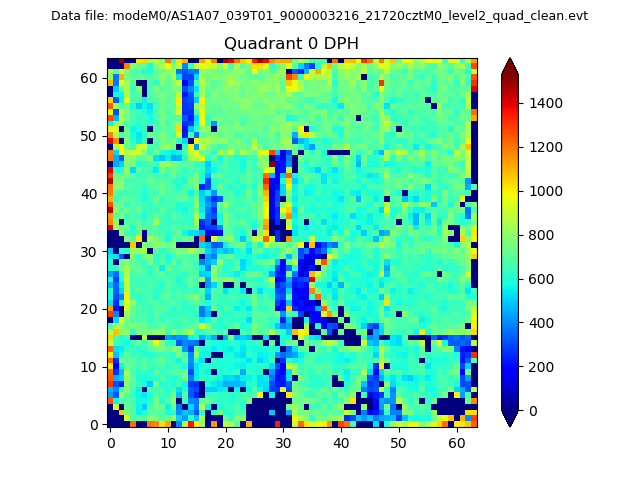 |
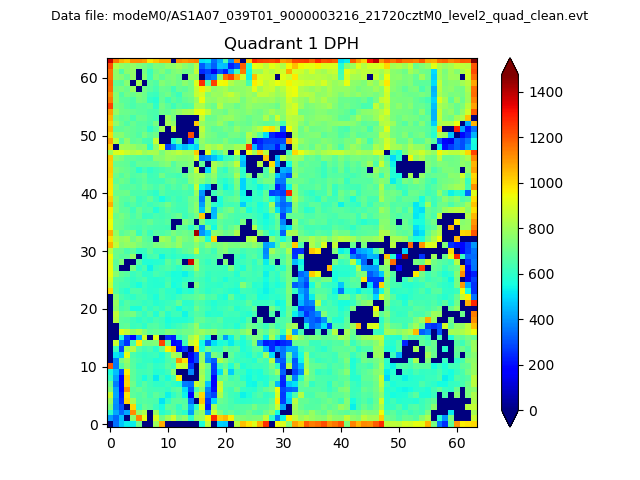 |
Quadrant B |
|---|---|---|---|
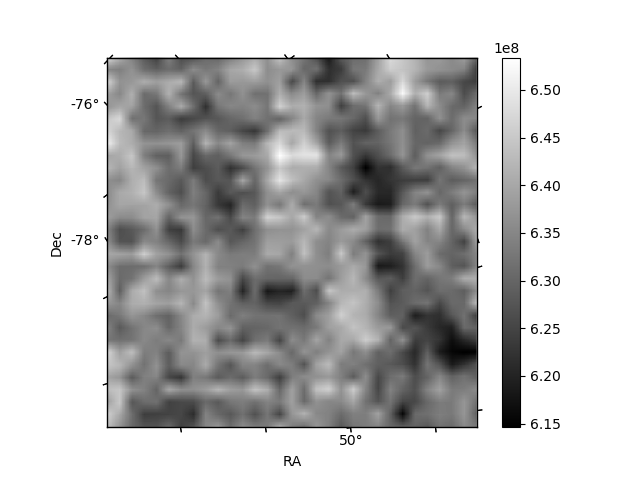
| Quadrant D | 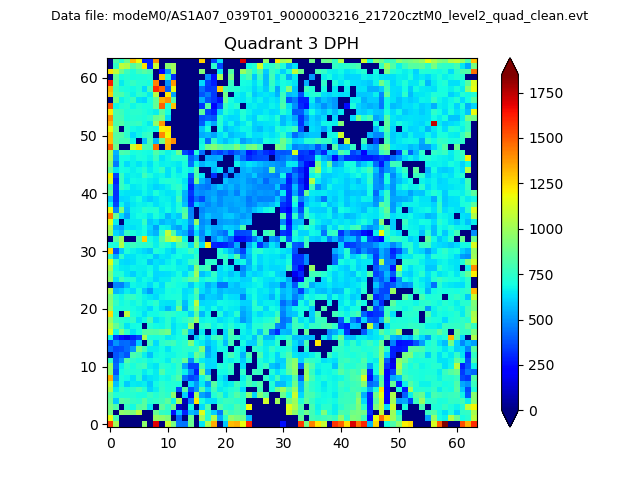 |
 |
Quadrant C |
| Plot type | Count rate plots | Images |
|---|---|---|
| Comparison with Poisson distribution Blue bars denote a histogram of data divided into 1 sec bins. Red curve is a Poisson curve with rate = median count rate of data. |
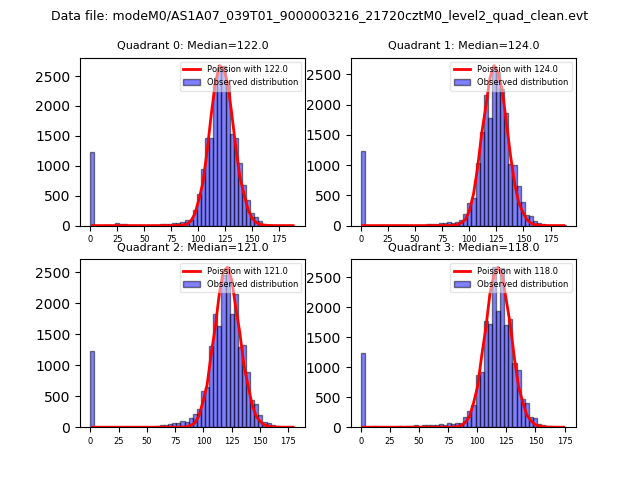 |
 |
| Quadrant-wise count rates Data is divided into 100 sec bins |
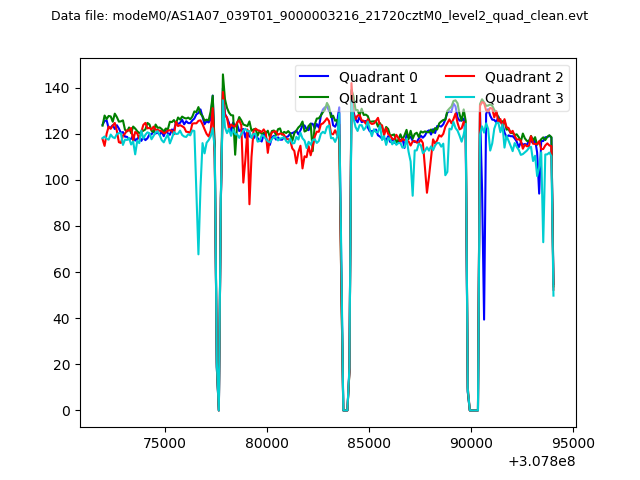 |
|
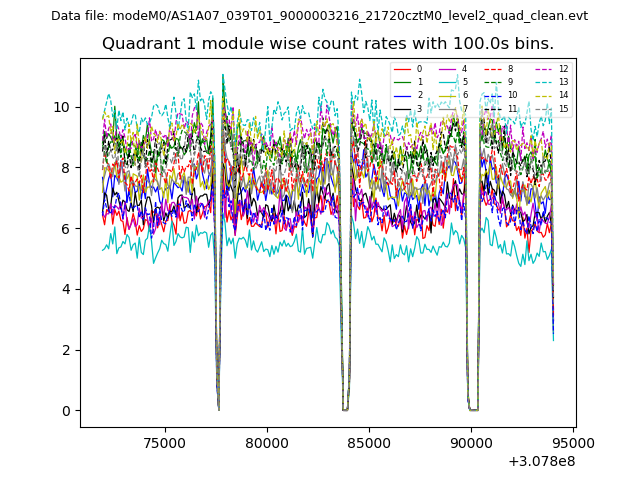
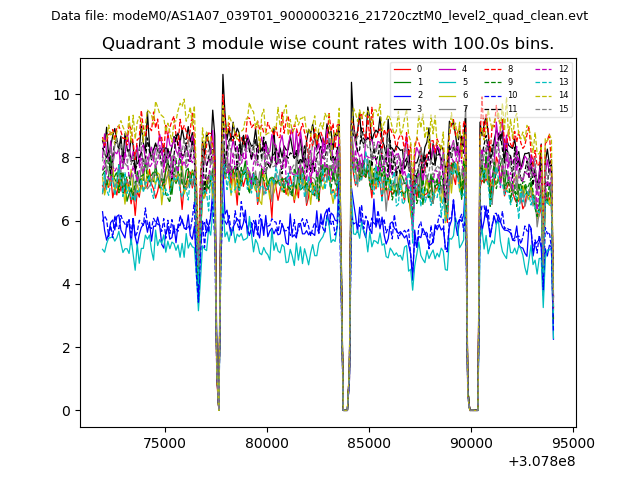
| Module-wise count rates for Quadrant A Data is divided into 100 sec bins |
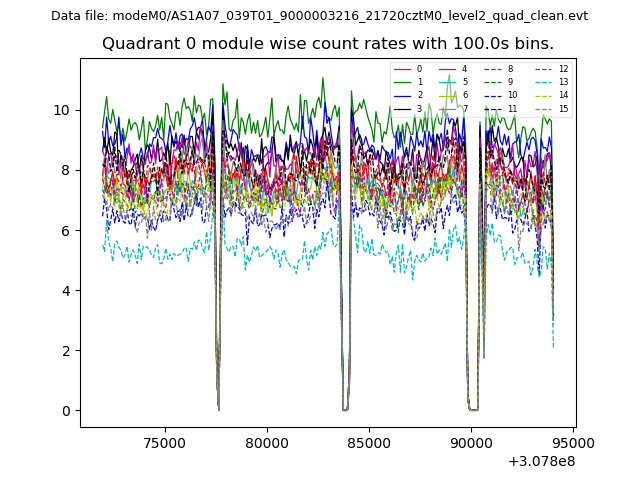 |
 |
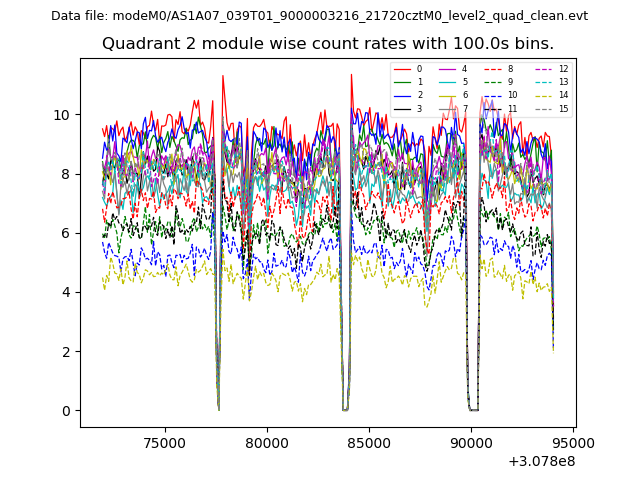
| Module-wise count rates for Quadrant B Data is divided into 100 sec bins |
 |
 |
| Module-wise count rates for Quadrant C Data is divided into 100 sec bins |
 |
 |
| Module-wise count rates for Quadrant D Data is divided into 100 sec bins |
 |
 |
| Parameter | Plot |
|---|---|
| CZT HV Monitor | 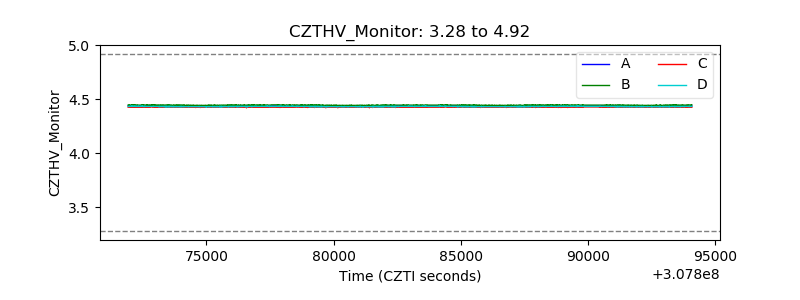 |
| D_VDD | 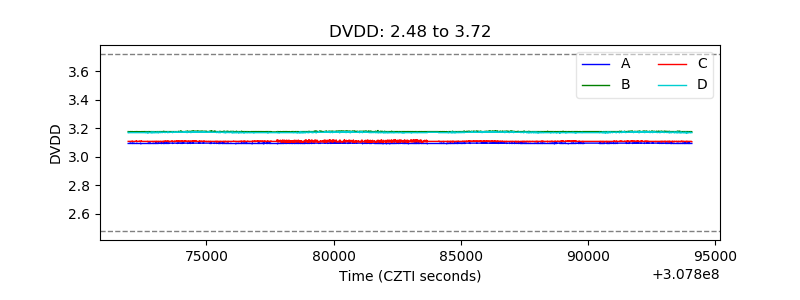 |
| Temperature 1 | 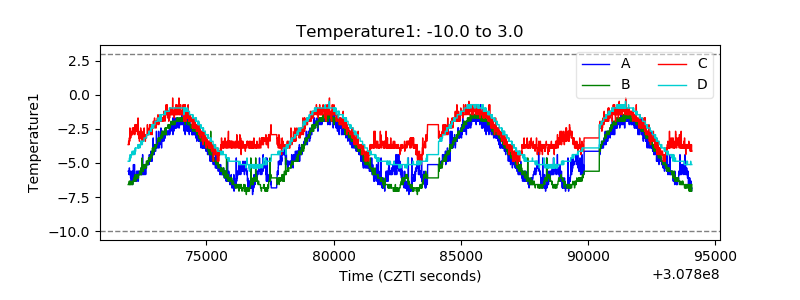 |
| Veto HV Monitor | 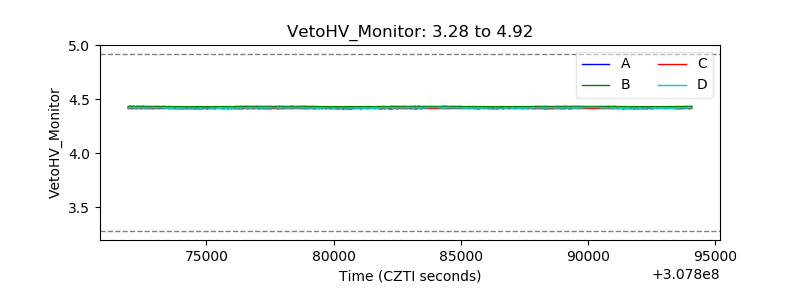 |
| Veto LLD | 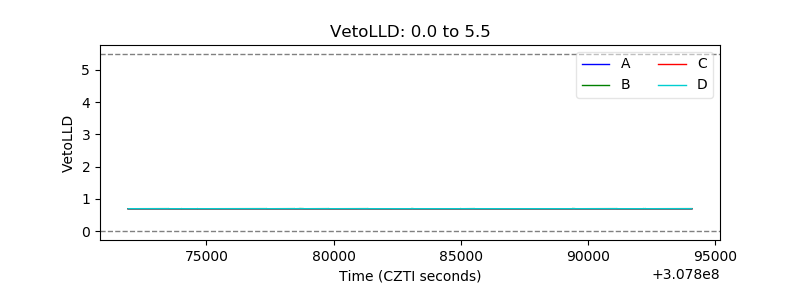 |
| Alpha Counter | 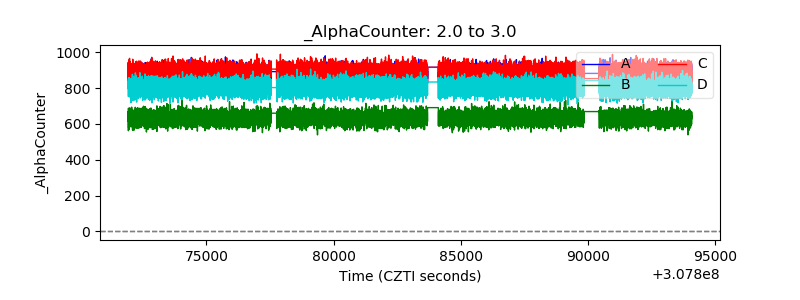 |
| _CPM_Rate | 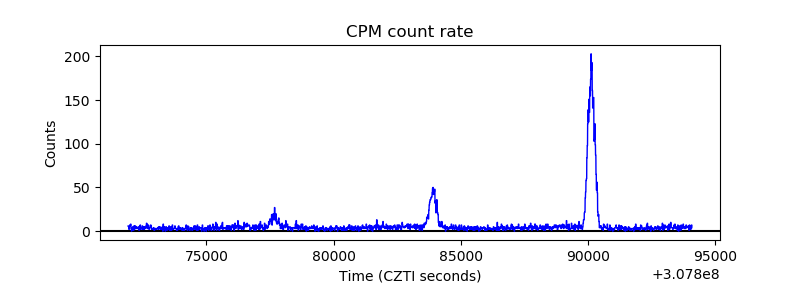 |
| CZT Counter | 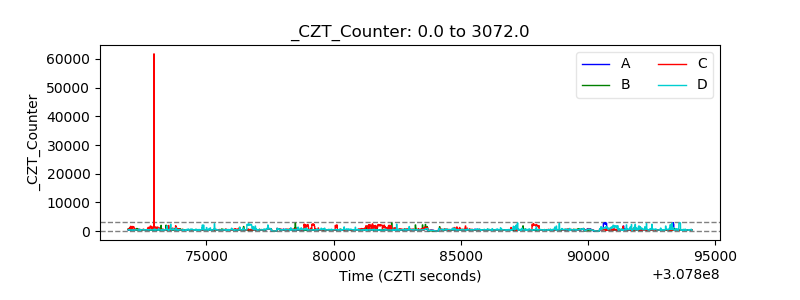 |
| +2.5 Volts monitor |  |
| +5 Volts monitor | 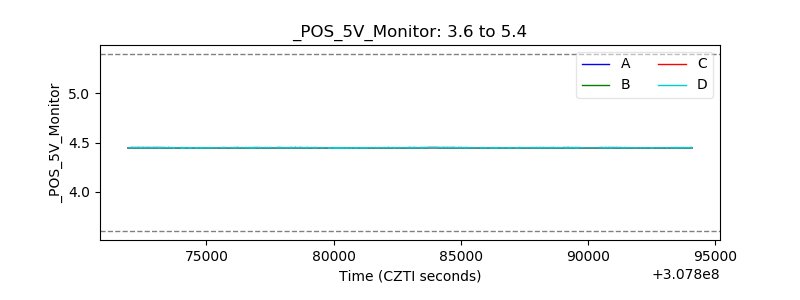 |
| _ROLL_ROT | 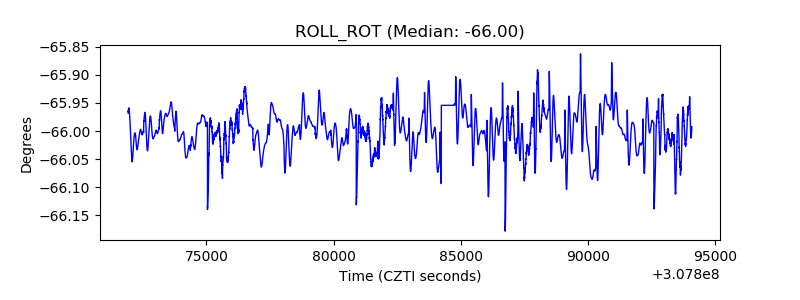 |
| _Roll_DEC | 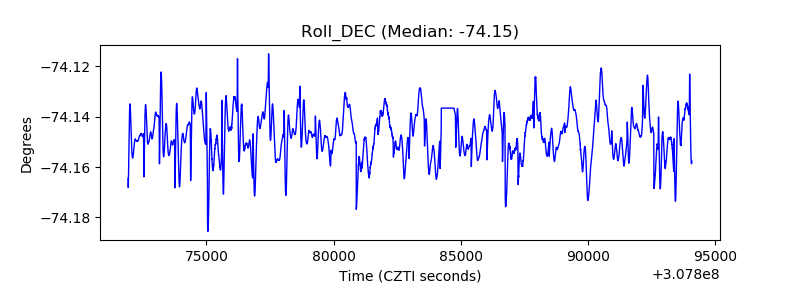 |
| _Roll_RA | 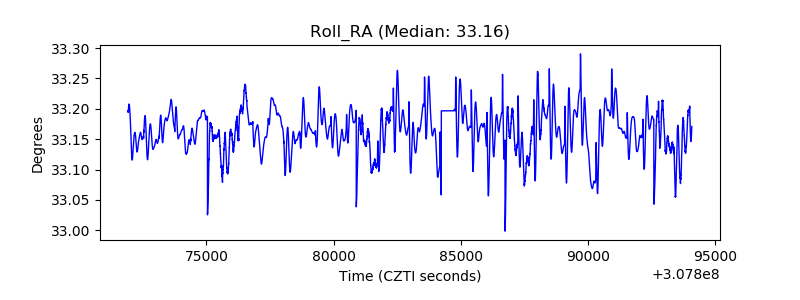 |
| Veto Counter | 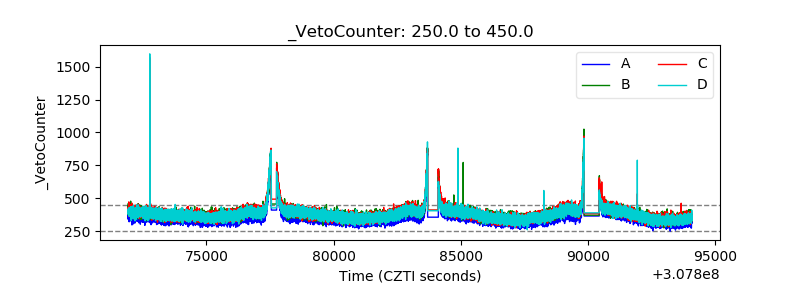 |