| Param | Original file | Final file |
|---|---|---|
| Filename | modeM0/AS1A07_039T03_9000003214cztM0_level2.fits | modeM0/AS1A07_039T03_9000003214cztM0_level2_quad_clean.evt |
| Size (bytes) | 318,110,400 | 412,525,440 |
| Size | 303.4 MB | 393.4 MB |
| Events in quadrant A | 1,882,194 | 2,600,166 |
| Events in quadrant B | 1,903,638 | 2,728,784 |
| Events in quadrant C | 1,885,238 | 2,504,645 |
| Events in quadrant D | 1,681,150 | 2,379,789 |
| Mode M0 | |||
|---|---|---|---|
| Quadrant | BADHDUFLAG | Total packets | Discarded packets |
| A | 0 | 117517 | 0 |
| B | 0 | 71586 | 0 |
| C | 0 | 109993 | 0 |
| D | 0 | 75296 | 0 |
| Mode M9 | |||
|---|---|---|---|
| Quadrant | BADHDUFLAG | Total packets | Discarded packets |
| A | 0 | 68 | 0 |
| B | 0 | 68 | 0 |
| C | 0 | 68 | 0 |
| D | 0 | 68 | 0 |
| Mode SS | |||
|---|---|---|---|
| Quadrant | BADHDUFLAG | Total packets | Discarded packets |
| A | 0 | 678 | 0 |
| B | 0 | 678 | 0 |
| C | 0 | 678 | 0 |
| D | 0 | 678 | 0 |
| Quadrant | Total seconds | Saturated seconds | Saturation percentage |
|---|---|---|---|
| A | 33158 | 1893 | 5.709029% |
| B | 33191 | 364 | 1.096683% |
| C | 33179 | 2061 | 6.211760% |
| D | 33197 | 428 | 1.289273% |
Noise dominated data is calculated using 1-second bins in cleaned event files. If a bin has >2000 counts, and if more than 50% of those come from <1% of pixels, then it is considered to be noise-dominated and hence unusable.
| Quadrant | # 1 sec bins | Bins with >0 counts | Bins with >2000 counts | High rate bins dominated by noise | Noise dominated (total time) | Noise dominated (detector-on time) | Marked lightcurve |
|---|---|---|---|---|---|---|---|
| A | 40273 | 33203 | 0 | 0 | 0.00% | 0.00% |  |
| B | 40273 | 33223 | 0 | 0 | 0.00% | 0.00% |  |
| C | 40273 | 33214 | 0 | 0 | 0.00% | 0.00% |  |
| D | 40273 | 33226 | 0 | 0 | 0.00% | 0.00% |  |
Top three noisy pixels from each quadrant. If the there are fewer than three noisy pixels in the level2.evt file, extra rows are filled as -1
| Pixel properties | Quadrant properties | ||||||
|---|---|---|---|---|---|---|---|
| Quadrant | DetID | PixID | Counts | Sigma | Mean | Median | Sigma |
| A | 0 | 29 | 1823 | 11.32 | 489 | 461 | 120.3 |
| A | 7 | 110 | 1572 | 9.24 | 489 | 461 | 120.3 |
| A | 0 | 30 | 1419 | 7.97 | 489 | 461 | 120.3 |
| B | 2 | 9 | 1517 | 10.39 | 503 | 481 | 99.7 |
| B | 2 | 8 | 1274 | 7.96 | 503 | 481 | 99.7 |
| B | 14 | 254 | 1269 | 7.91 | 503 | 481 | 99.7 |
| C | 1 | 81 | 1421 | 7.44 | 497 | 467 | 128.2 |
| C | 1 | 80 | 1398 | 7.26 | 497 | 467 | 128.2 |
| C | 3 | 234 | 1307 | 6.55 | 497 | 467 | 128.2 |
| D | 10 | 189 | 1215 | 6.05 | 479 | 435 | 129.0 |
| D | 3 | 14 | 1199 | 5.92 | 479 | 435 | 129.0 |
| D | 7 | 3 | 1198 | 5.92 | 479 | 435 | 129.0 |
Histogram calculated using DETX and DETY for each event in the final _common_clean file
| Quadrant A |  |
 |
Quadrant B |
|---|---|---|---|
| Quadrant D |  |
 |
Quadrant C |
| Plot type | Count rate plots | Images |
|---|---|---|
| Comparison with Poisson distribution Blue bars denote a histogram of data divided into 1 sec bins. Red curve is a Poisson curve with rate = median count rate of data. |
 |
 |
| Quadrant-wise count rates Data is divided into 100 sec bins |
 |
|
| Module-wise count rates for Quadrant A Data is divided into 100 sec bins |
 |
 |
| Module-wise count rates for Quadrant B Data is divided into 100 sec bins |
 |
 |
| Module-wise count rates for Quadrant C Data is divided into 100 sec bins |
 |
 |
| Module-wise count rates for Quadrant D Data is divided into 100 sec bins |
 |
 |
| Parameter | Plot |
|---|---|
| CZT HV Monitor |  |
| D_VDD | 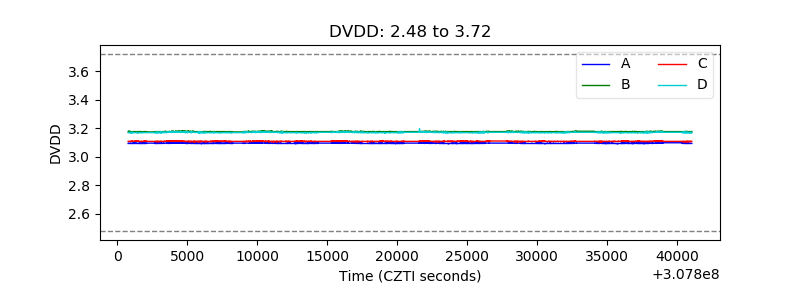 |
| Temperature 1 |  |
| Veto HV Monitor |  |
| Veto LLD |  |
| Alpha Counter |  |
| _CPM_Rate |  |
| CZT Counter |  |
| +2.5 Volts monitor |  |
| +5 Volts monitor |  |
| _ROLL_ROT |  |
| _Roll_DEC |  |
| _Roll_RA | 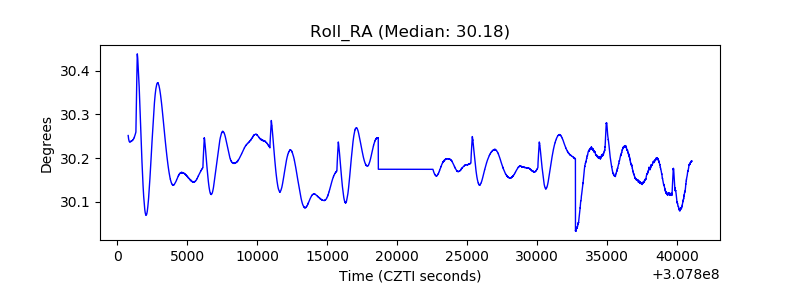 |
| Veto Counter |  |