| Param | Original file | Final file |
|---|---|---|
| Filename | modeM0/AS1A07_039T03_9000003214_21706cztM0_level2.evt | modeM0/AS1A07_039T03_9000003214_21706cztM0_level2_quad_clean.evt |
| Size (bytes) | 1,392,436,800 | 256,512,960 |
| Size | 1.3 GB | 244.6 MB |
| Events in quadrant A | 13,802,699 | 1,682,520 |
| Events in quadrant B | 7,032,630 | 1,775,423 |
| Events in quadrant C | 12,945,881 | 1,669,195 |
| Events in quadrant D | 7,451,129 | 1,678,669 |
| Mode M0 | |||
|---|---|---|---|
| Quadrant | BADHDUFLAG | Total packets | Discarded packets |
| A | 0 | 51034 | 150 |
| B | 0 | 30003 | 65 |
| C | 0 | 48043 | 80 |
| D | 0 | 31601 | 41 |
| Mode M9 | |||
|---|---|---|---|
| Quadrant | BADHDUFLAG | Total packets | Discarded packets |
| A | 0 | 21 | 0 |
| B | 0 | 21 | 0 |
| C | 0 | 21 | 0 |
| D | 0 | 21 | 0 |
| Mode SS | |||
|---|---|---|---|
| Quadrant | BADHDUFLAG | Total packets | Discarded packets |
| A | 0 | 286 | 0 |
| B | 0 | 286 | 0 |
| C | 0 | 286 | 0 |
| D | 0 | 286 | 0 |
| Quadrant | Total seconds | Saturated seconds | Saturation percentage |
|---|---|---|---|
| A | 13936 | 458 | 3.286452% |
| B | 13948 | 215 | 1.541440% |
| C | 13951 | 1104 | 7.913411% |
| D | 13958 | 283 | 2.027511% |
Noise dominated data is calculated using 1-second bins in cleaned event files. If a bin has >2000 counts, and if more than 50% of those come from <1% of pixels, then it is considered to be noise-dominated and hence unusable.
| Quadrant | # 1 sec bins | Bins with >0 counts | Bins with >2000 counts | High rate bins dominated by noise | Noise dominated (total time) | Noise dominated (detector-on time) | Marked lightcurve |
|---|---|---|---|---|---|---|---|
| A | 16071 | 13966 | 52 | 52 | 0.32% | 0.37% | 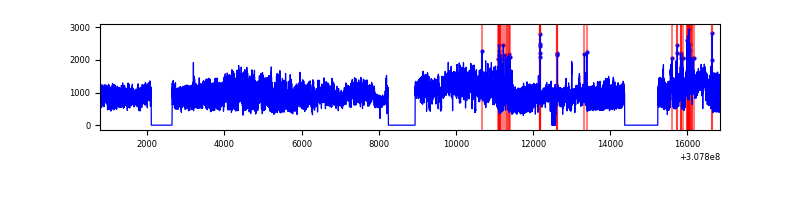 |
| B | 16071 | 13976 | 23 | 23 | 0.14% | 0.16% | 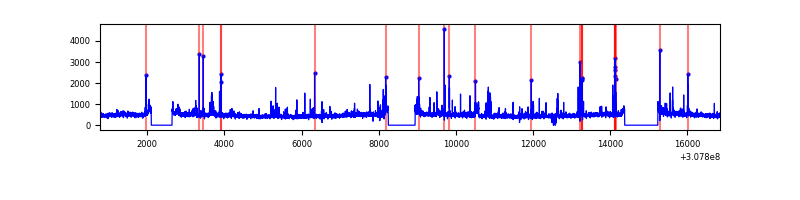 |
| C | 16071 | 13974 | 136 | 136 | 0.85% | 0.97% | 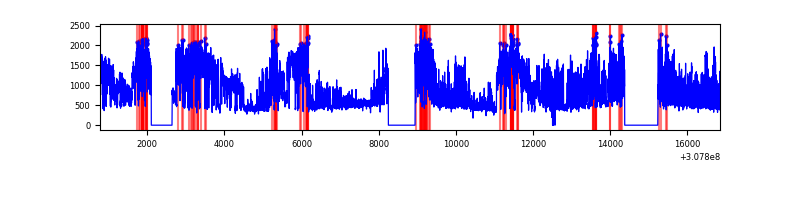 |
| D | 16071 | 13979 | 136 | 136 | 0.85% | 0.97% |  |
Top three noisy pixels from each quadrant. If the there are fewer than three noisy pixels in the level2.evt file, extra rows are filled as -1
| Pixel properties | Quadrant properties | ||||||
|---|---|---|---|---|---|---|---|
| Quadrant | DetID | PixID | Counts | Sigma | Mean | Median | Sigma |
| A | 15 | 236 | 7474077 | 22799.68 | 1636 | 1598 | 327.7 |
| A | 13 | 254 | 26063 | 74.65 | 1636 | 1598 | 327.7 |
| A | 0 | 226 | 14064 | 38.04 | 1636 | 1598 | 327.7 |
| B | 3 | 64 | 343209 | 1091.55 | 1655 | 1611 | 312.9 |
| B | 0 | 230 | 80829 | 253.14 | 1655 | 1611 | 312.9 |
| B | 0 | 229 | 52380 | 162.23 | 1655 | 1611 | 312.9 |
| C | 8 | 208 | 6557401 | 17945.71 | 1572 | 1579 | 365.3 |
| C | 14 | 238 | 243976 | 663.53 | 1572 | 1579 | 365.3 |
| C | 10 | 22 | 15678 | 38.59 | 1572 | 1579 | 365.3 |
| D | 12 | 235 | 571211 | 1465.02 | 1609 | 1561 | 388.8 |
| D | 13 | 104 | 275768 | 705.2 | 1609 | 1561 | 388.8 |
| D | 2 | 136 | 209187 | 533.97 | 1609 | 1561 | 388.8 |
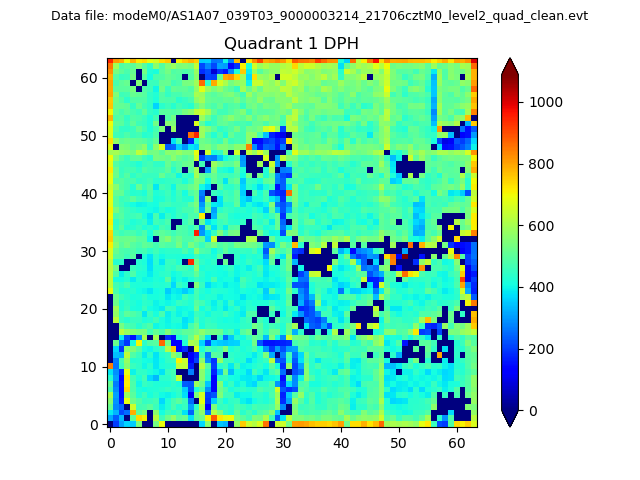
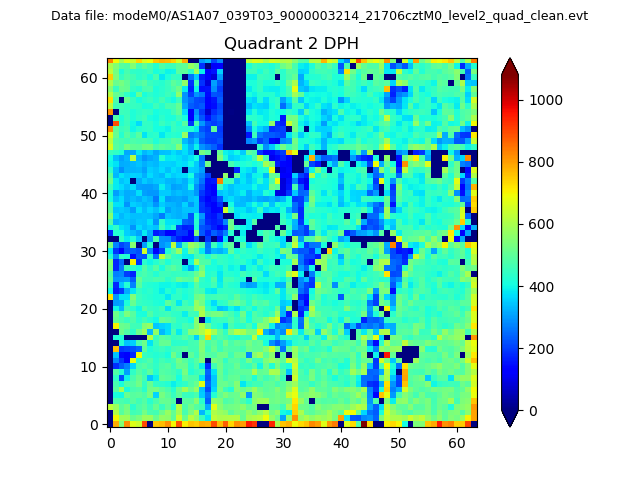
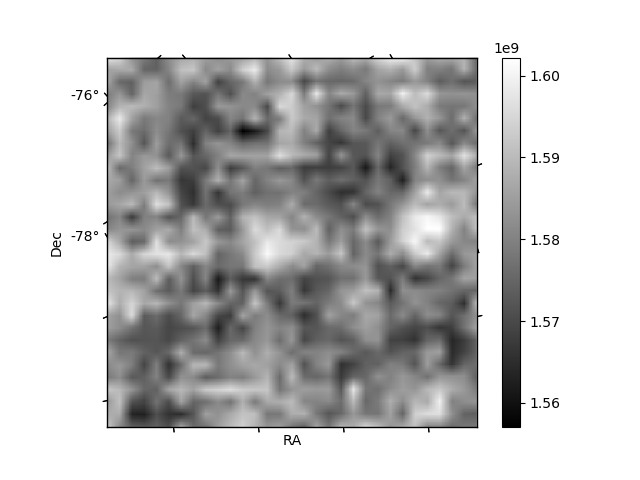
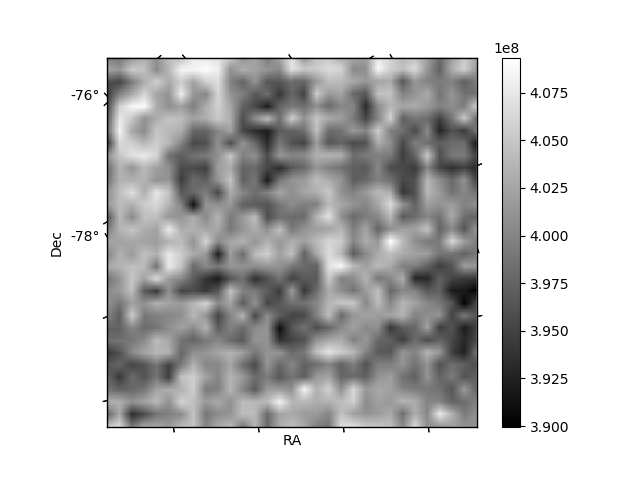
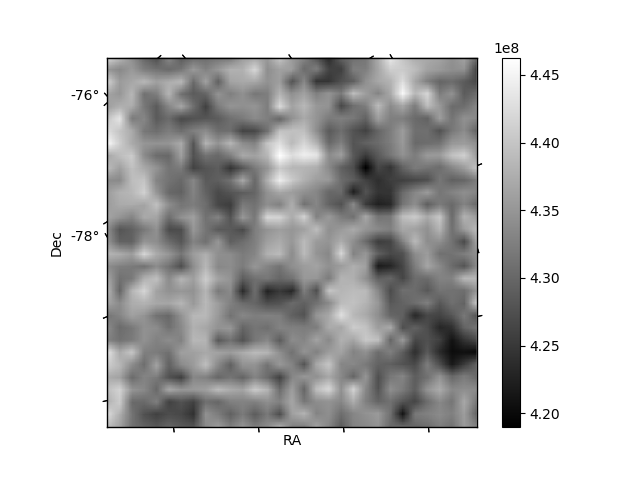
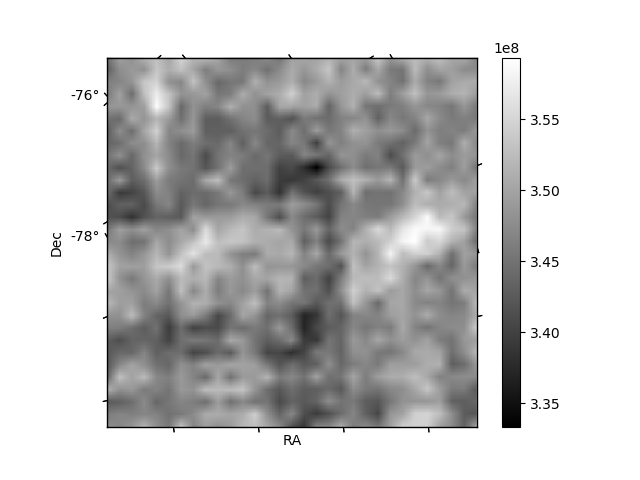
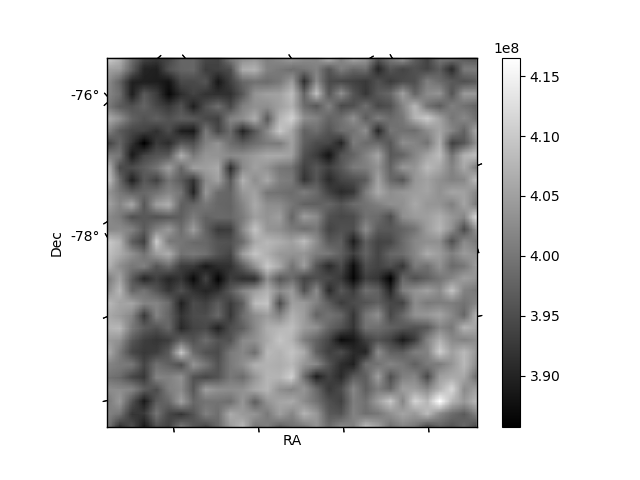
Histogram calculated using DETX and DETY for each event in the final _common_clean file
| Quadrant A | 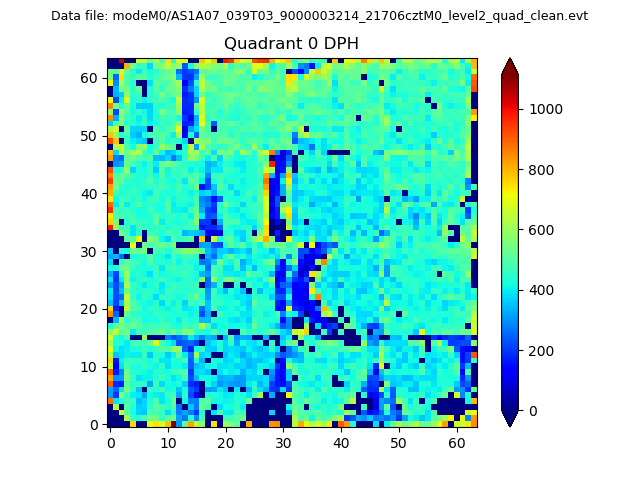 |
 |
Quadrant B |
|---|---|---|---|
| Quadrant D | 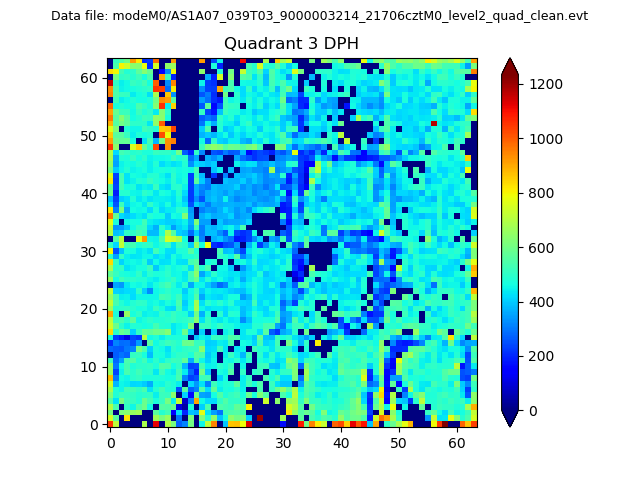 |
 |
Quadrant C |
| Plot type | Count rate plots | Images |
|---|---|---|
| Comparison with Poisson distribution Blue bars denote a histogram of data divided into 1 sec bins. Red curve is a Poisson curve with rate = median count rate of data. |
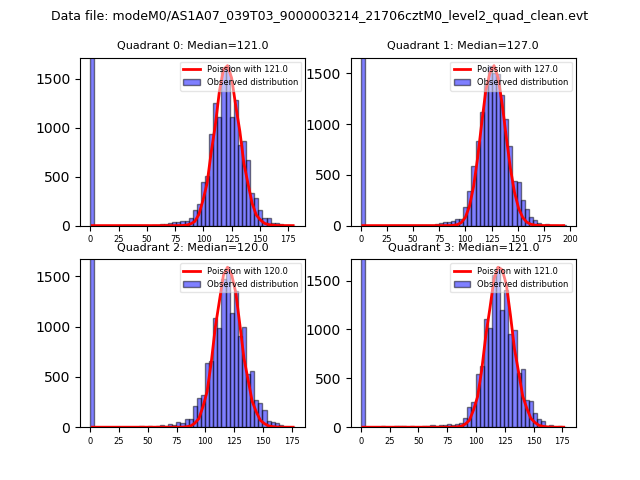 |
 |
| Quadrant-wise count rates Data is divided into 100 sec bins |
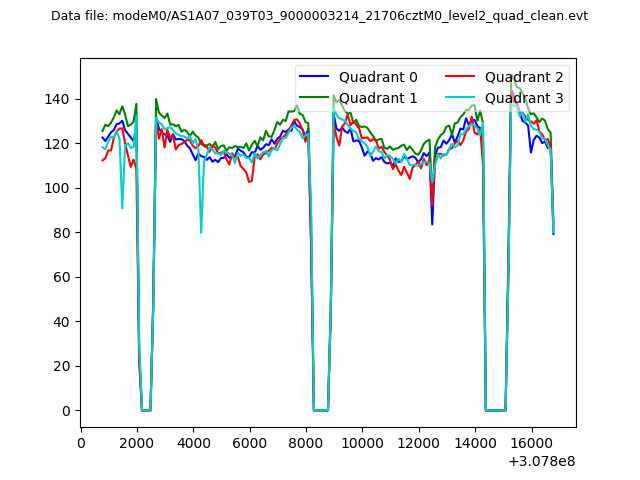 |
|
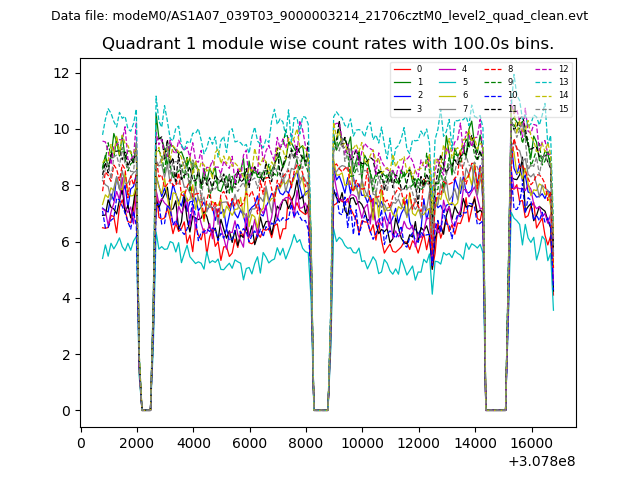
| Module-wise count rates for Quadrant A Data is divided into 100 sec bins |
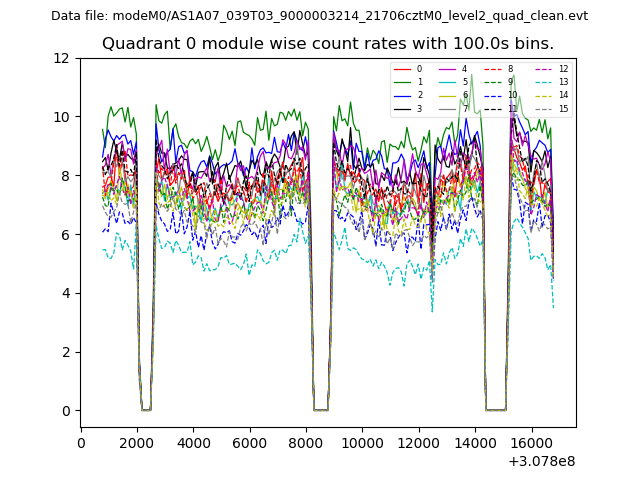 |
 |
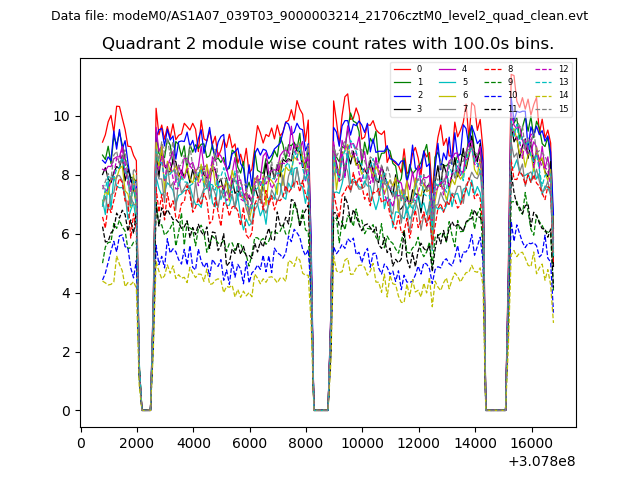
| Module-wise count rates for Quadrant B Data is divided into 100 sec bins |
 |
 |
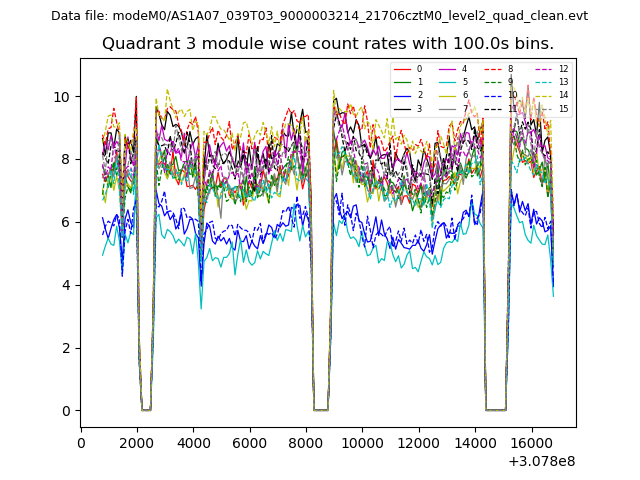
| Module-wise count rates for Quadrant C Data is divided into 100 sec bins |
 |
 |
| Module-wise count rates for Quadrant D Data is divided into 100 sec bins |
 |
 |
| Parameter | Plot |
|---|---|
| CZT HV Monitor | 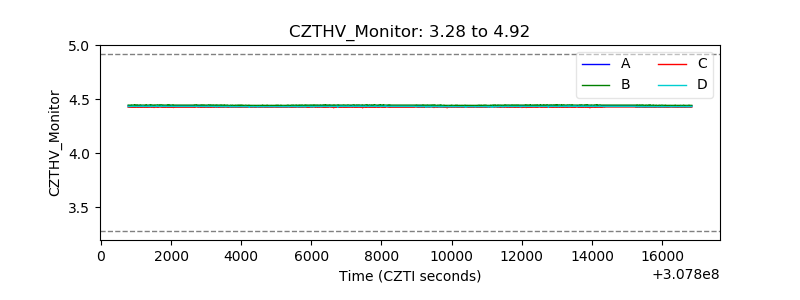 |
| D_VDD | 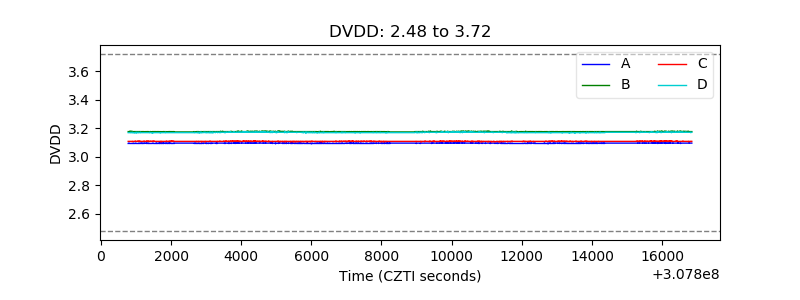 |
| Temperature 1 | 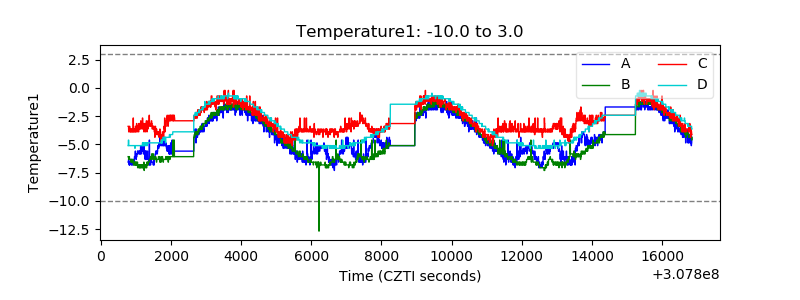 |
| Veto HV Monitor | 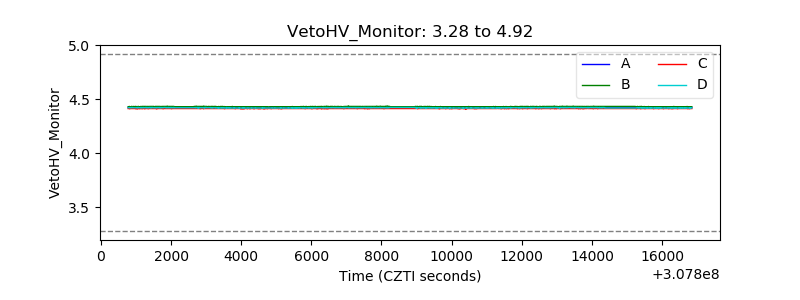 |
| Veto LLD |  |
| Alpha Counter | 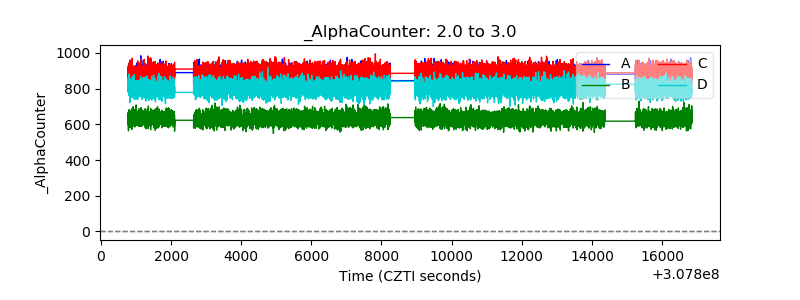 |
| _CPM_Rate | 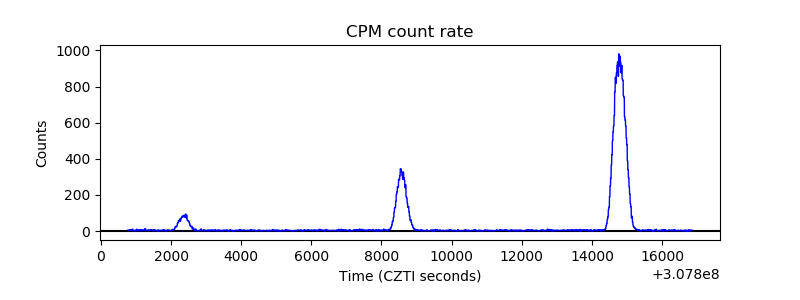 |
| CZT Counter | 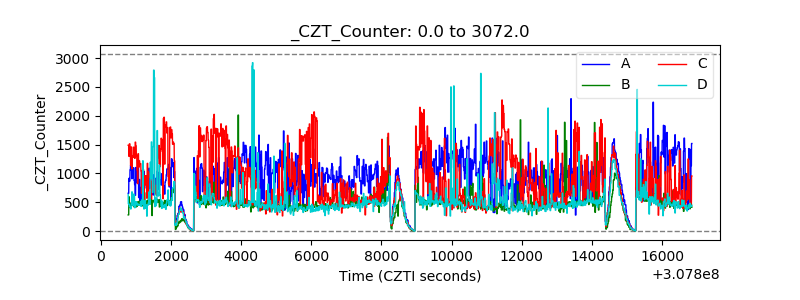 |
| +2.5 Volts monitor |  |
| +5 Volts monitor |  |
| _ROLL_ROT | 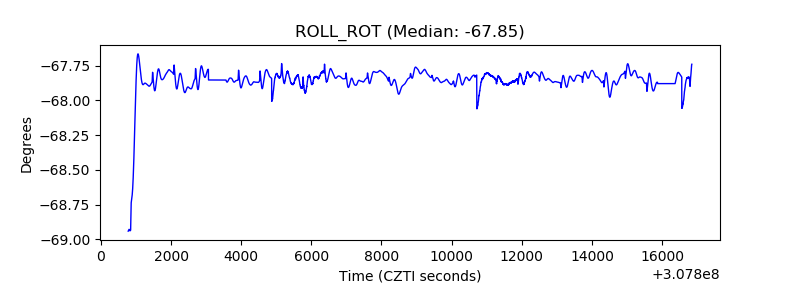 |
| _Roll_DEC | 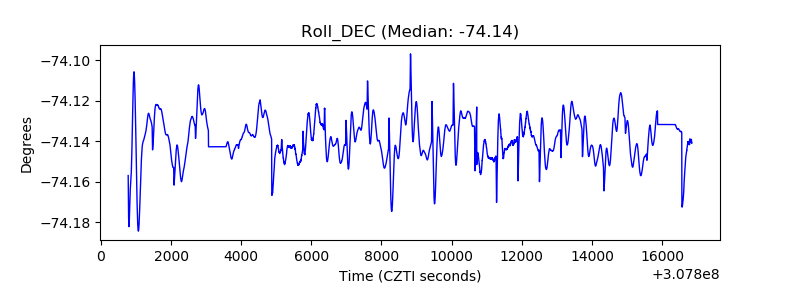 |
| _Roll_RA | 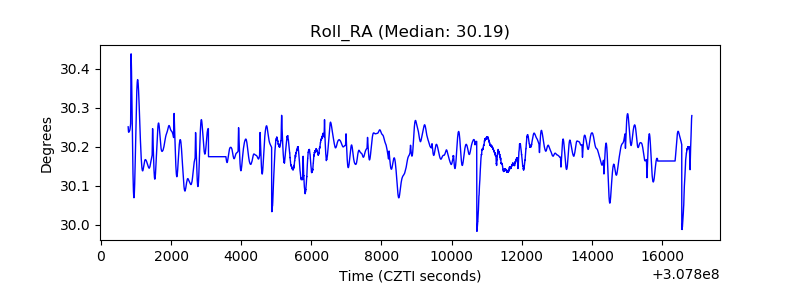 |
| Veto Counter | 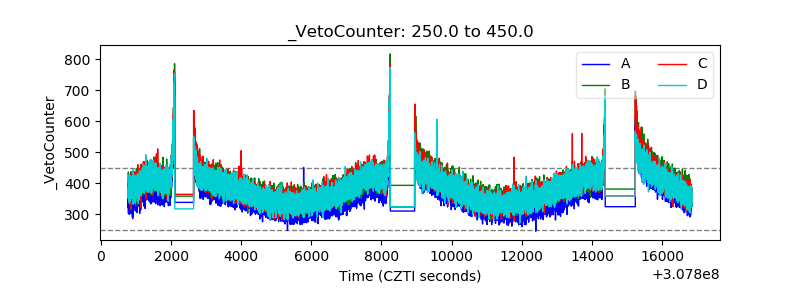 |