| Param | Original file | Final file |
|---|---|---|
| Filename | modeM0/AS1A07_039T03_9000003214_21707cztM0_level2.evt | modeM0/AS1A07_039T03_9000003214_21707cztM0_level2_quad_clean.evt |
| Size (bytes) | 659,880,000 | 117,377,280 |
| Size | 629.3 MB | 111.9 MB |
| Events in quadrant A | 6,671,364 | 769,115 |
| Events in quadrant B | 3,182,793 | 824,573 |
| Events in quadrant C | 6,533,061 | 757,241 |
| Events in quadrant D | 3,178,724 | 770,471 |
| Mode M0 | |||
|---|---|---|---|
| Quadrant | BADHDUFLAG | Total packets | Discarded packets |
| A | 0 | 25116 | 996 |
| B | 0 | 13798 | 349 |
| C | 0 | 24298 | 571 |
| D | 0 | 14066 | 405 |
| Mode M9 | |||
|---|---|---|---|
| Quadrant | BADHDUFLAG | Total packets | Discarded packets |
| A | 0 | 10 | 0 |
| B | 0 | 10 | 0 |
| C | 0 | 10 | 0 |
| D | 0 | 10 | 0 |
| Mode SS | |||
|---|---|---|---|
| Quadrant | BADHDUFLAG | Total packets | Discarded packets |
| A | 0 | 130 | 4 |
| B | 0 | 130 | 4 |
| C | 0 | 129 | 5 |
| D | 0 | 128 | 2 |
| Quadrant | Total seconds | Saturated seconds | Saturation percentage |
|---|---|---|---|
| A | 6195 | 410 | 6.618241% |
| B | 6225 | 62 | 0.995984% |
| C | 6205 | 557 | 8.976632% |
| D | 6221 | 68 | 1.093072% |
Noise dominated data is calculated using 1-second bins in cleaned event files. If a bin has >2000 counts, and if more than 50% of those come from <1% of pixels, then it is considered to be noise-dominated and hence unusable.
| Quadrant | # 1 sec bins | Bins with >0 counts | Bins with >2000 counts | High rate bins dominated by noise | Noise dominated (total time) | Noise dominated (detector-on time) | Marked lightcurve |
|---|---|---|---|---|---|---|---|
| A | 7438 | 6224 | 233 | 233 | 3.13% | 3.74% | 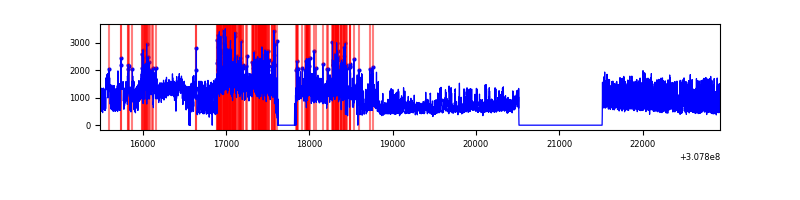 |
| B | 7439 | 6240 | 19 | 19 | 0.26% | 0.30% | 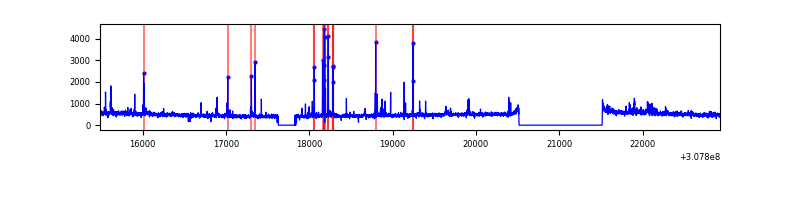 |
| C | 7438 | 6231 | 83 | 83 | 1.12% | 1.33% | 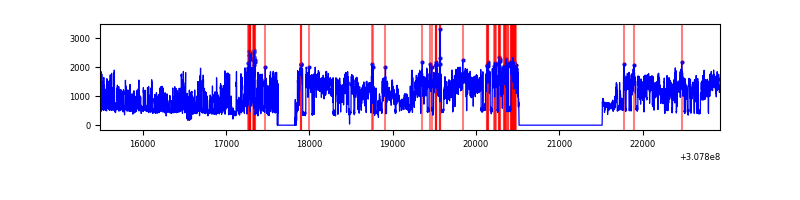 |
| D | 7438 | 6239 | 31 | 31 | 0.42% | 0.50% | 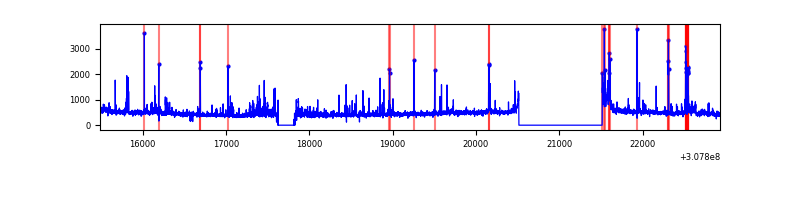 |
Top three noisy pixels from each quadrant. If the there are fewer than three noisy pixels in the level2.evt file, extra rows are filled as -1
| Pixel properties | Quadrant properties | ||||||
|---|---|---|---|---|---|---|---|
| Quadrant | DetID | PixID | Counts | Sigma | Mean | Median | Sigma |
| A | 15 | 236 | 3803955 | 25750.45 | 730 | 716 | 147.7 |
| A | 10 | 253 | 27947 | 184.37 | 730 | 716 | 147.7 |
| A | 6 | 16 | 13659 | 87.63 | 730 | 716 | 147.7 |
| B | 3 | 64 | 167151 | 1179.33 | 746 | 727 | 141.1 |
| B | 0 | 189 | 33348 | 231.16 | 746 | 727 | 141.1 |
| B | 0 | 230 | 24277 | 166.88 | 746 | 727 | 141.1 |
| C | 8 | 208 | 3679993 | 22773.87 | 698 | 702 | 161.6 |
| C | 14 | 238 | 109362 | 672.58 | 698 | 702 | 161.6 |
| C | 10 | 23 | 19539 | 116.6 | 698 | 702 | 161.6 |
| D | 1 | 52 | 156044 | 902.45 | 716 | 694 | 172.1 |
| D | 12 | 235 | 147806 | 854.59 | 716 | 694 | 172.1 |
| D | 2 | 136 | 55494 | 318.34 | 716 | 694 | 172.1 |
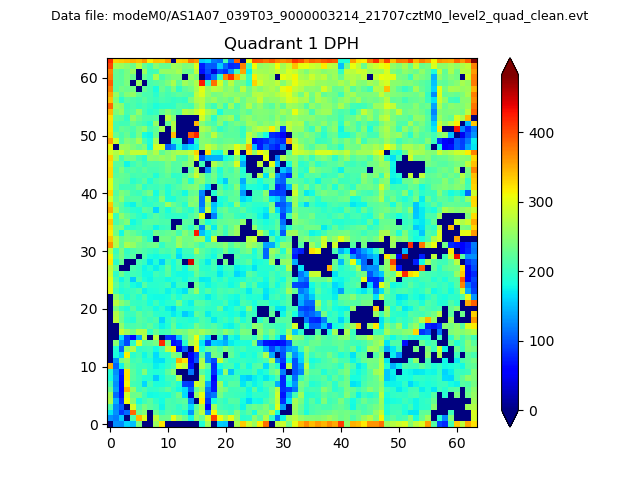
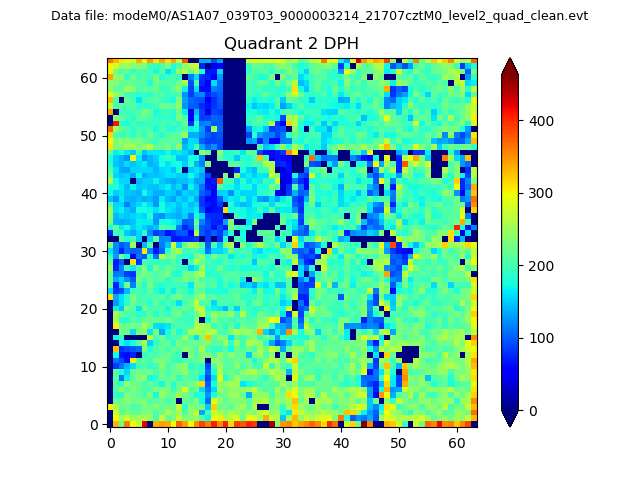
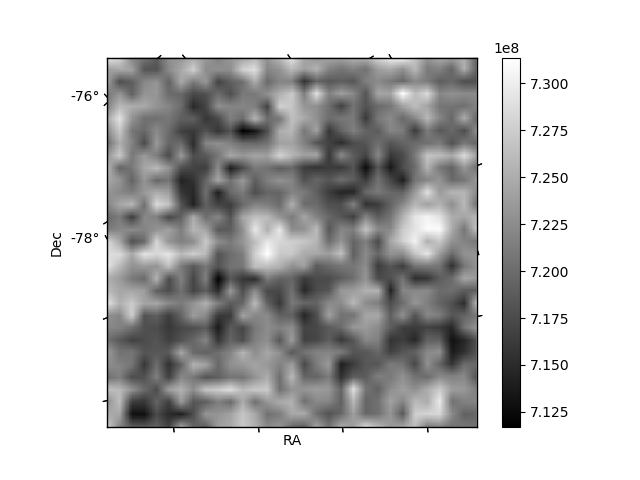
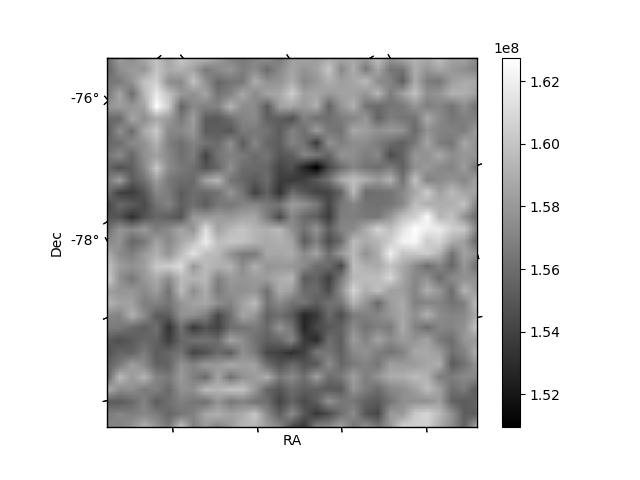
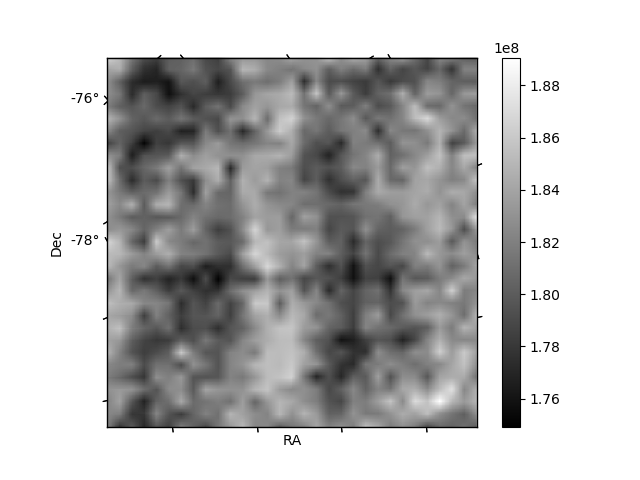
Histogram calculated using DETX and DETY for each event in the final _common_clean file
| Quadrant A |  |
 |
Quadrant B |
|---|---|---|---|
| Quadrant D | 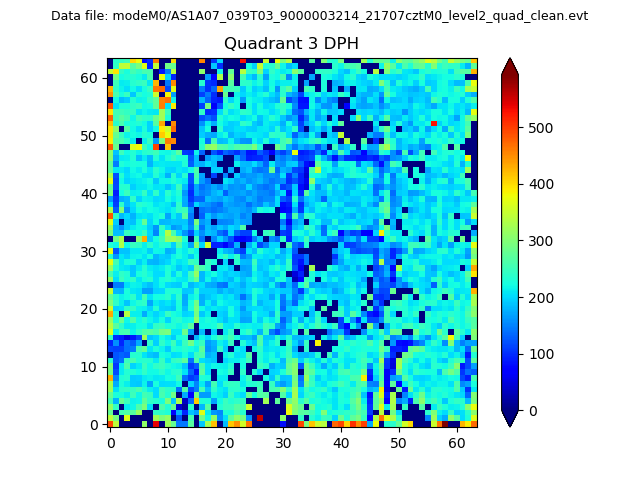 |
 |
Quadrant C |
| Plot type | Count rate plots | Images |
|---|---|---|
| Comparison with Poisson distribution Blue bars denote a histogram of data divided into 1 sec bins. Red curve is a Poisson curve with rate = median count rate of data. |
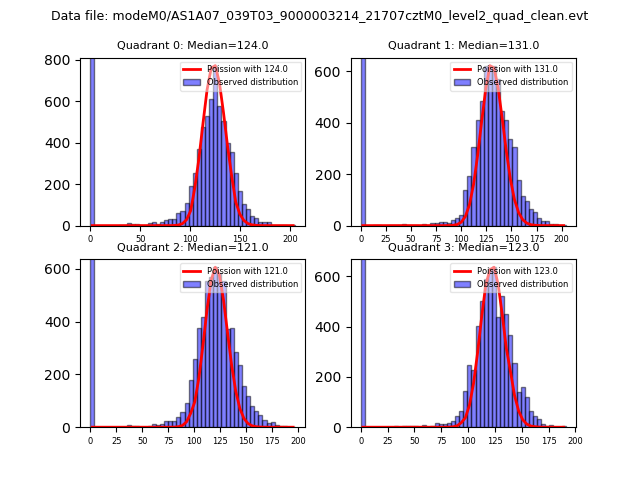 |
 |
| Quadrant-wise count rates Data is divided into 100 sec bins |
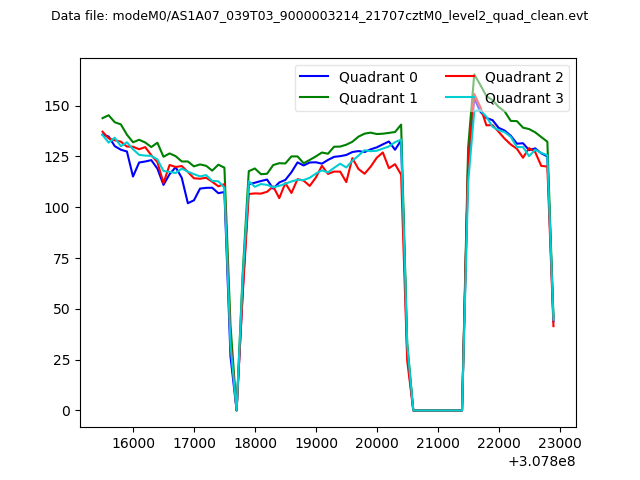 |
|
| Module-wise count rates for Quadrant A Data is divided into 100 sec bins |
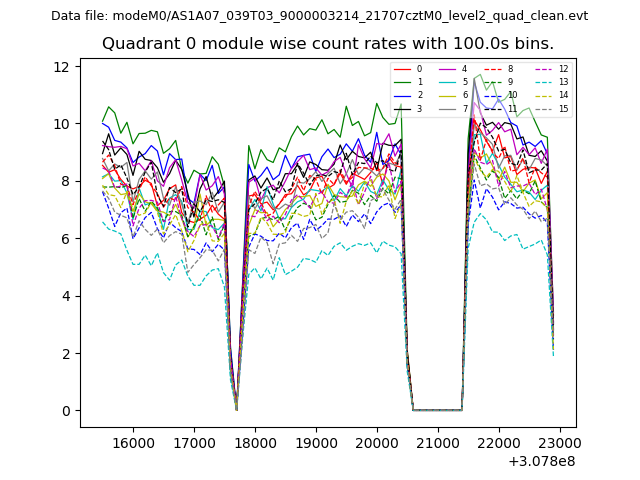 |
 |
| Module-wise count rates for Quadrant B Data is divided into 100 sec bins |
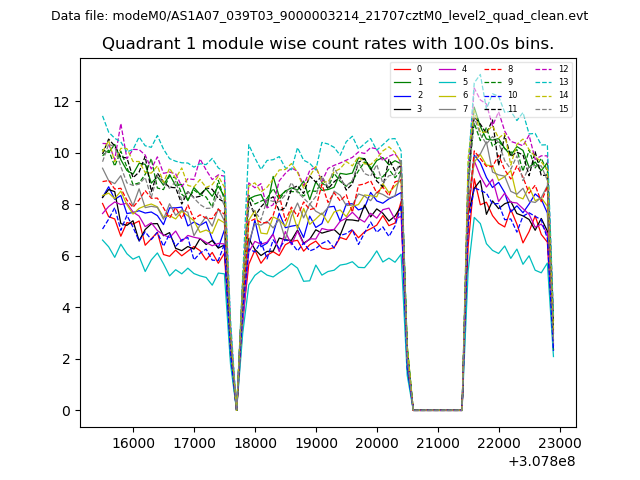 |
 |
| Module-wise count rates for Quadrant C Data is divided into 100 sec bins |
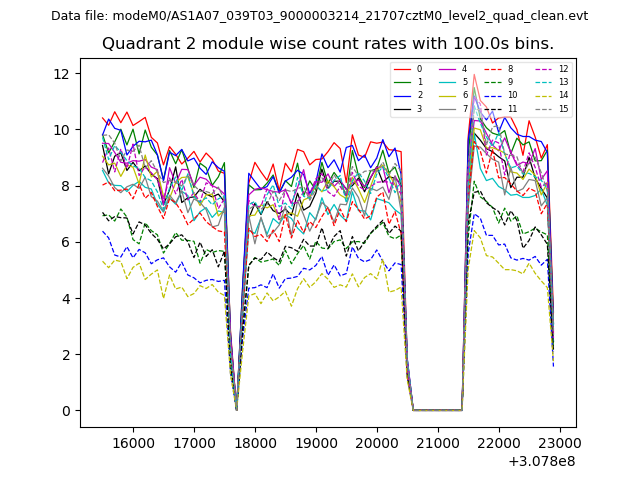 |
 |
| Module-wise count rates for Quadrant D Data is divided into 100 sec bins |
 |
 |
| Parameter | Plot |
|---|---|
| CZT HV Monitor | 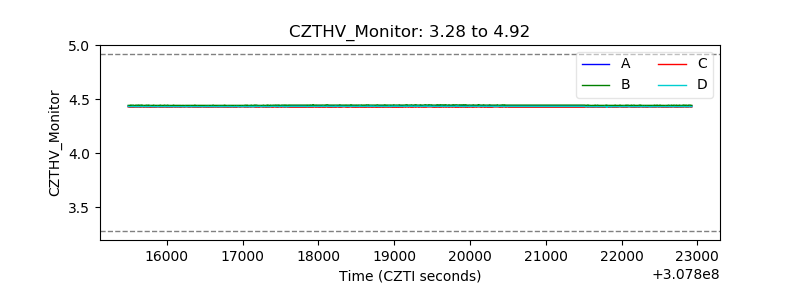 |
| D_VDD | 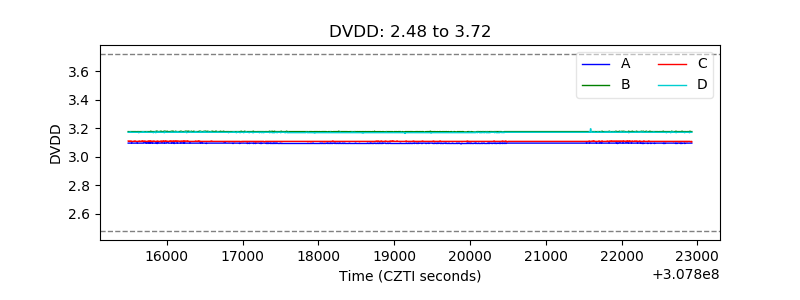 |
| Temperature 1 | 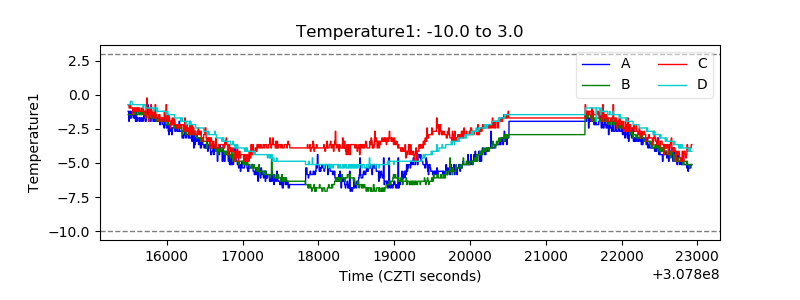 |
| Veto HV Monitor | 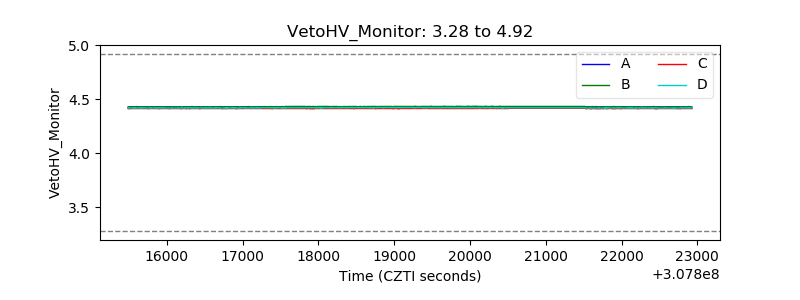 |
| Veto LLD | 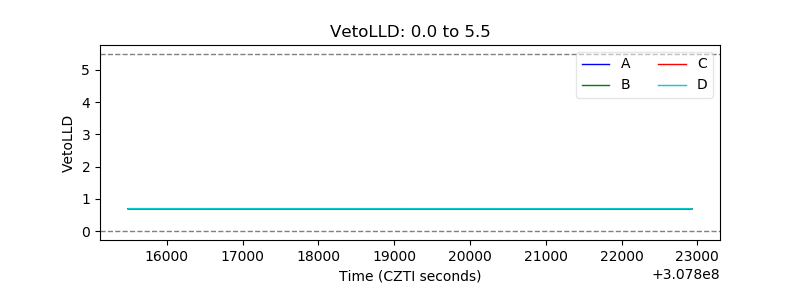 |
| Alpha Counter | 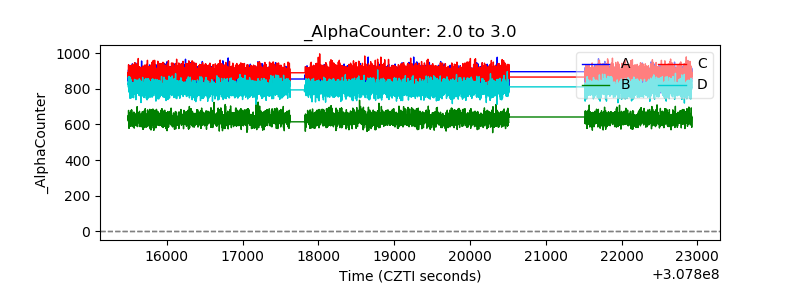 |
| _CPM_Rate | 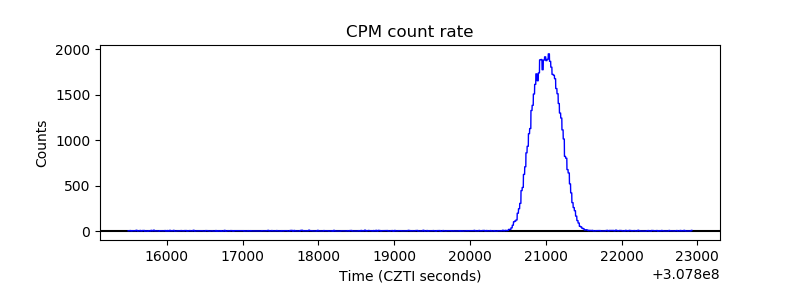 |
| CZT Counter | 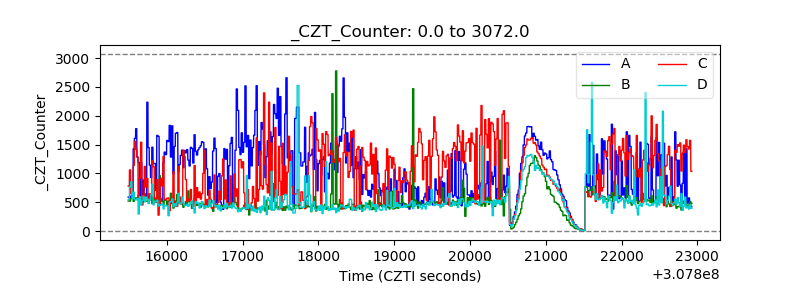 |
| +2.5 Volts monitor | 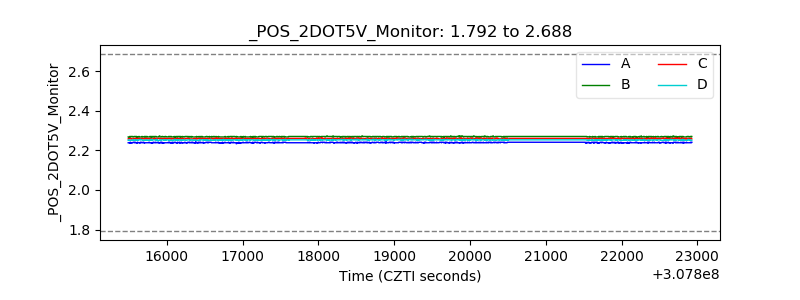 |
| +5 Volts monitor | 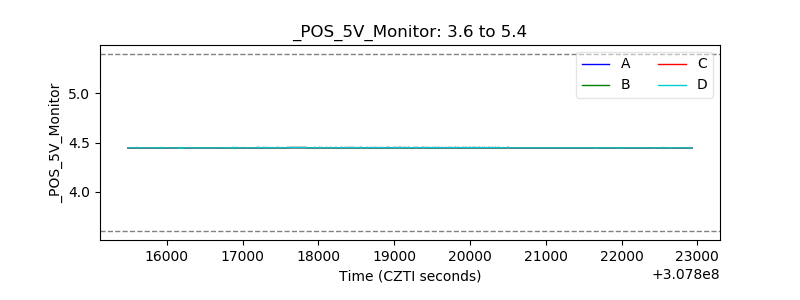 |
| _ROLL_ROT | 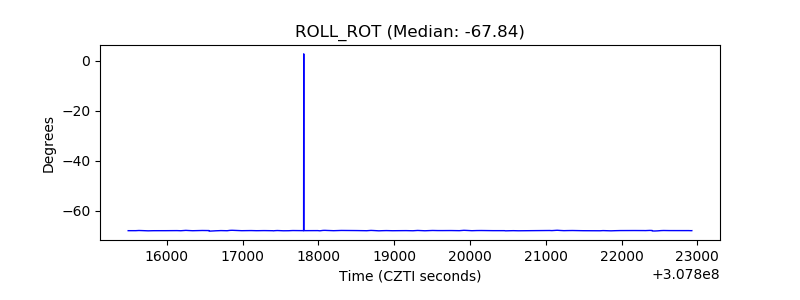 |
| _Roll_DEC | 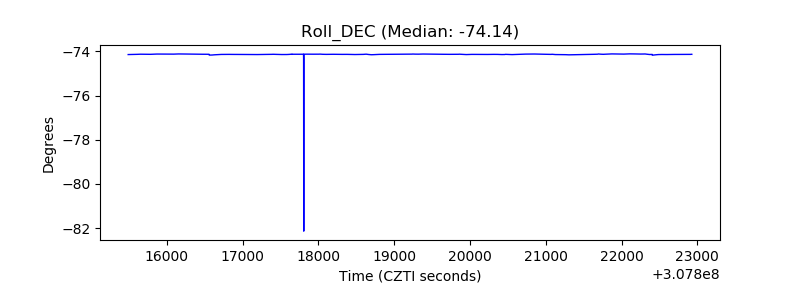 |
| _Roll_RA | 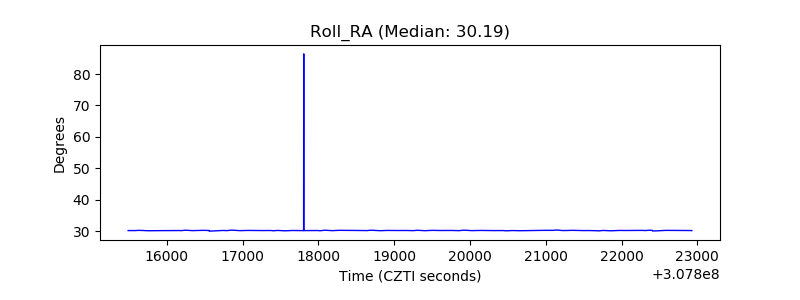 |
| Veto Counter | 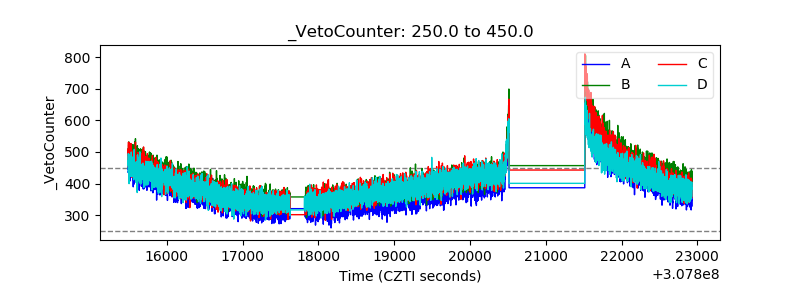 |