| Param | Original file | Final file |
|---|---|---|
| Filename | modeM0/AS1A07_039T03_9000003214_21709cztM0_level2.evt | modeM0/AS1A07_039T03_9000003214_21709cztM0_level2_quad_clean.evt |
| Size (bytes) | 689,204,160 | 126,132,480 |
| Size | 657.3 MB | 120.3 MB |
| Events in quadrant A | 6,951,201 | 820,119 |
| Events in quadrant B | 3,271,087 | 897,388 |
| Events in quadrant C | 6,727,055 | 824,785 |
| Events in quadrant D | 3,486,999 | 826,400 |
| Mode M0 | |||
|---|---|---|---|
| Quadrant | BADHDUFLAG | Total packets | Discarded packets |
| A | 0 | 25189 | 2 |
| B | 0 | 13974 | 2 |
| C | 0 | 24518 | 2 |
| D | 0 | 14788 | 2 |
| Mode M9 | |||
|---|---|---|---|
| Quadrant | BADHDUFLAG | Total packets | Discarded packets |
| A | 0 | 14 | 0 |
| B | 0 | 15 | 0 |
| C | 0 | 15 | 0 |
| D | 0 | 15 | 0 |
| Mode SS | |||
|---|---|---|---|
| Quadrant | BADHDUFLAG | Total packets | Discarded packets |
| A | 0 | 130 | 0 |
| B | 0 | 130 | 0 |
| C | 0 | 130 | 0 |
| D | 0 | 130 | 0 |
| Quadrant | Total seconds | Saturated seconds | Saturation percentage |
|---|---|---|---|
| A | 6472 | 813 | 12.561805% |
| B | 6472 | 31 | 0.478986% |
| C | 6472 | 379 | 5.855995% |
| D | 6472 | 72 | 1.112485% |
Noise dominated data is calculated using 1-second bins in cleaned event files. If a bin has >2000 counts, and if more than 50% of those come from <1% of pixels, then it is considered to be noise-dominated and hence unusable.
| Quadrant | # 1 sec bins | Bins with >0 counts | Bins with >2000 counts | High rate bins dominated by noise | Noise dominated (total time) | Noise dominated (detector-on time) | Marked lightcurve |
|---|---|---|---|---|---|---|---|
| A | 7632 | 6473 | 479 | 479 | 6.28% | 7.40% |  |
| B | 7632 | 6473 | 2 | 2 | 0.03% | 0.03% |  |
| C | 7632 | 6473 | 25 | 25 | 0.33% | 0.39% | 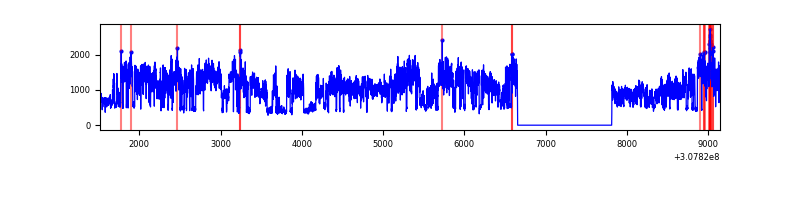 |
| D | 7632 | 6473 | 44 | 44 | 0.58% | 0.68% |  |
Top three noisy pixels from each quadrant. If the there are fewer than three noisy pixels in the level2.evt file, extra rows are filled as -1
| Pixel properties | Quadrant properties | ||||||
|---|---|---|---|---|---|---|---|
| Quadrant | DetID | PixID | Counts | Sigma | Mean | Median | Sigma |
| A | 15 | 236 | 3993383 | 26195.79 | 760 | 744 | 152.4 |
| A | 6 | 16 | 25397 | 161.75 | 760 | 744 | 152.4 |
| A | 13 | 254 | 11864 | 72.96 | 760 | 744 | 152.4 |
| B | 3 | 64 | 62445 | 414.02 | 791 | 773 | 149.0 |
| B | 0 | 230 | 40525 | 266.86 | 791 | 773 | 149.0 |
| B | 0 | 189 | 28067 | 183.23 | 791 | 773 | 149.0 |
| C | 8 | 208 | 3684256 | 21424.46 | 745 | 750 | 171.9 |
| C | 14 | 238 | 117457 | 678.81 | 745 | 750 | 171.9 |
| C | 10 | 23 | 17553 | 97.73 | 745 | 750 | 171.9 |
| D | 1 | 52 | 226072 | 1238.32 | 752 | 732 | 182.0 |
| D | 12 | 227 | 88108 | 480.16 | 752 | 732 | 182.0 |
| D | 13 | 104 | 86881 | 473.42 | 752 | 732 | 182.0 |
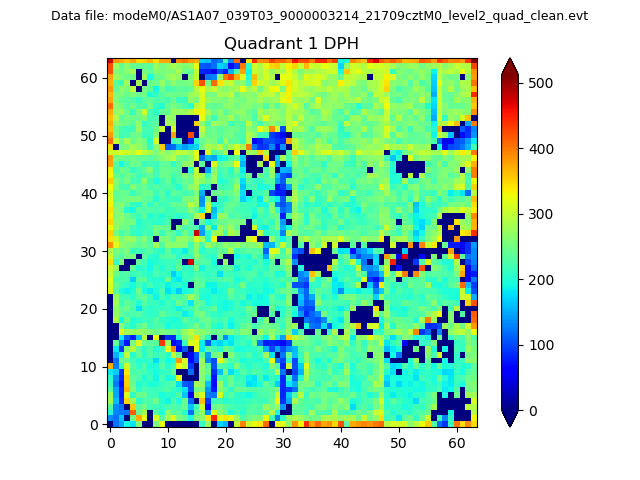
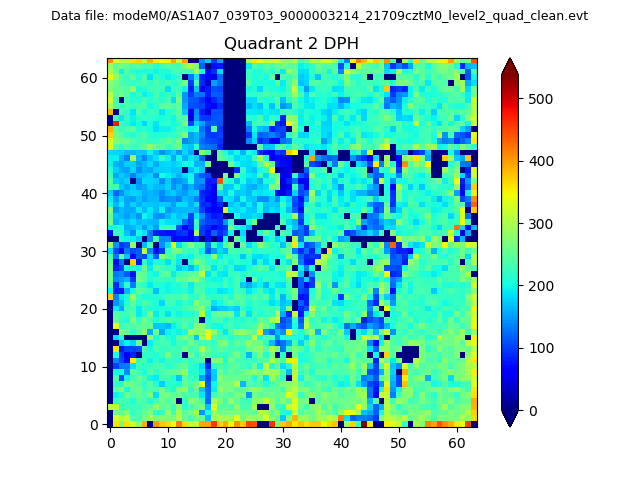
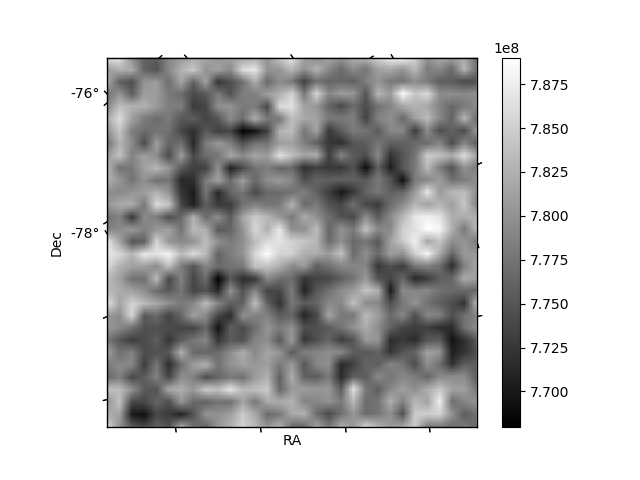
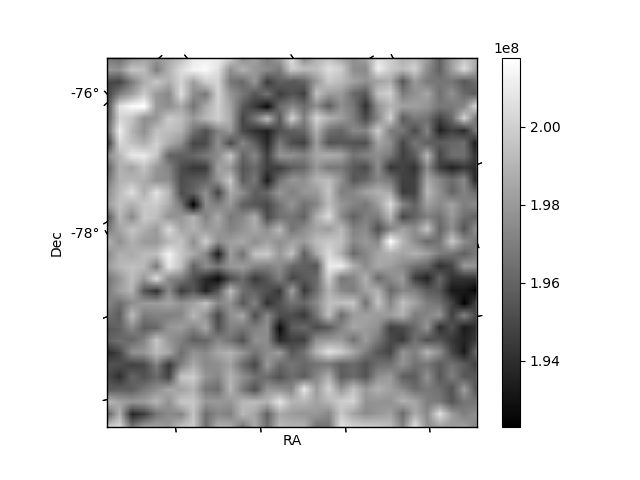
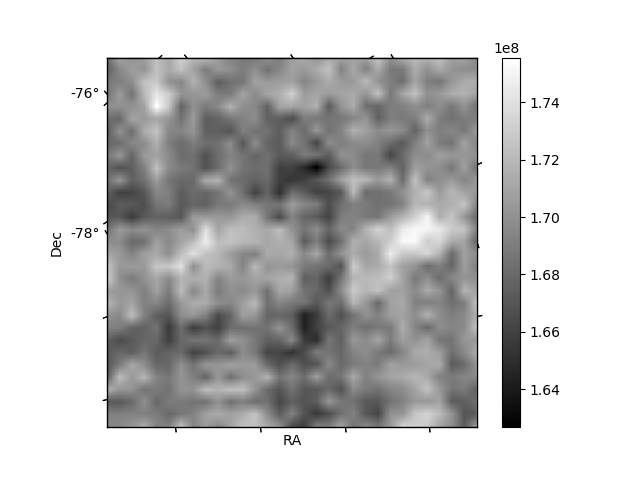
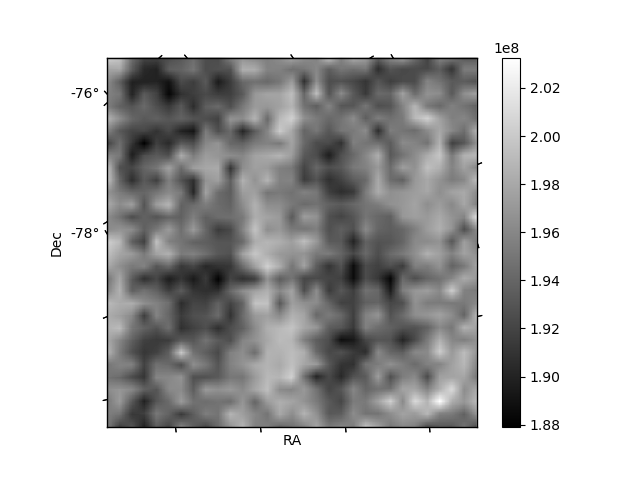
Histogram calculated using DETX and DETY for each event in the final _common_clean file
| Quadrant A |  |
 |
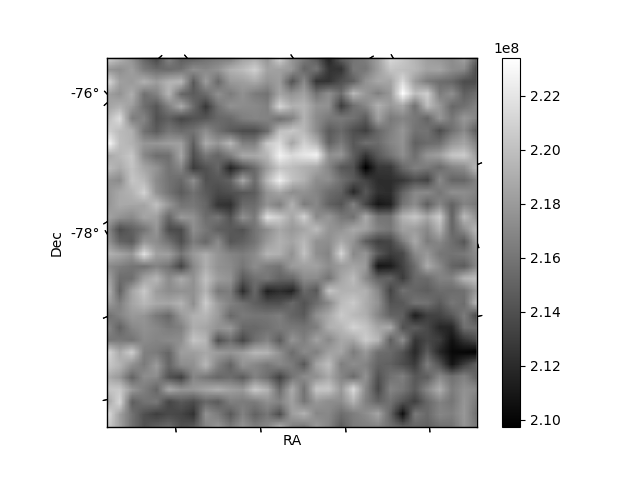
Quadrant B |
|---|---|---|---|
| Quadrant D | 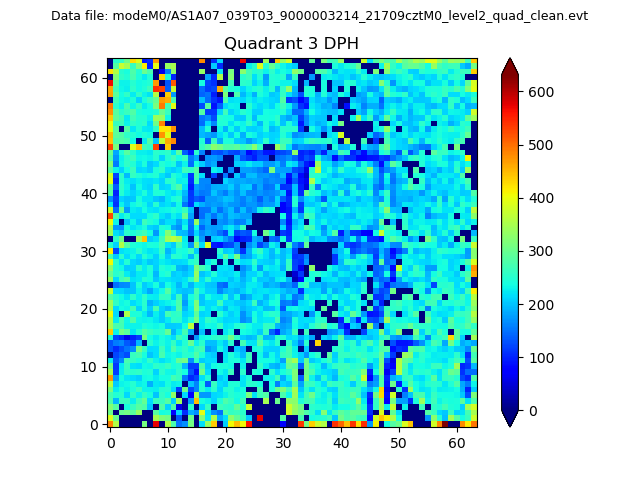 |
 |
Quadrant C |
| Plot type | Count rate plots | Images |
|---|---|---|
| Comparison with Poisson distribution Blue bars denote a histogram of data divided into 1 sec bins. Red curve is a Poisson curve with rate = median count rate of data. |
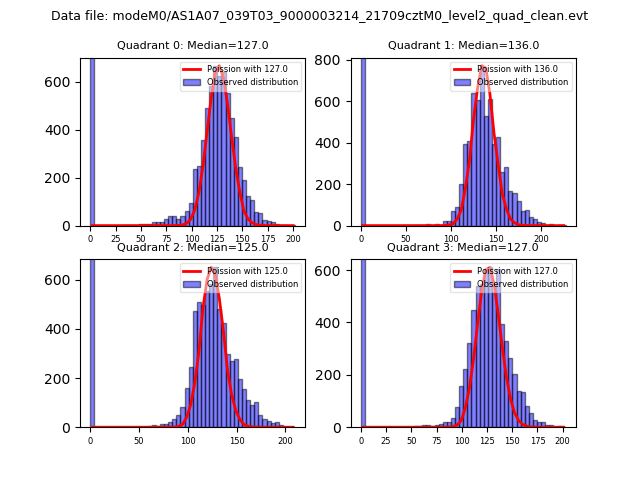 |
 |
| Quadrant-wise count rates Data is divided into 100 sec bins |
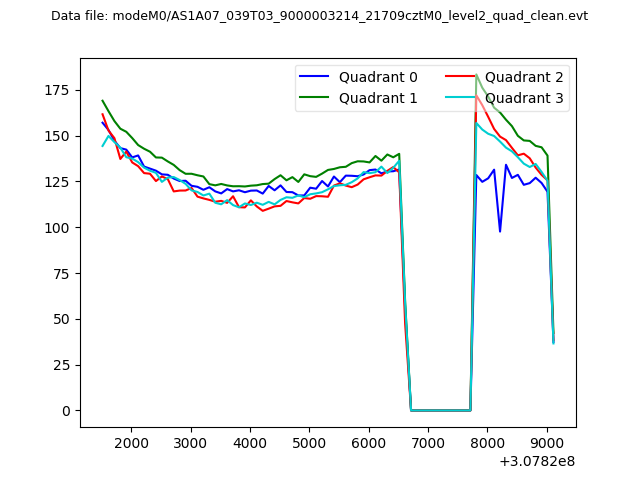 |
|
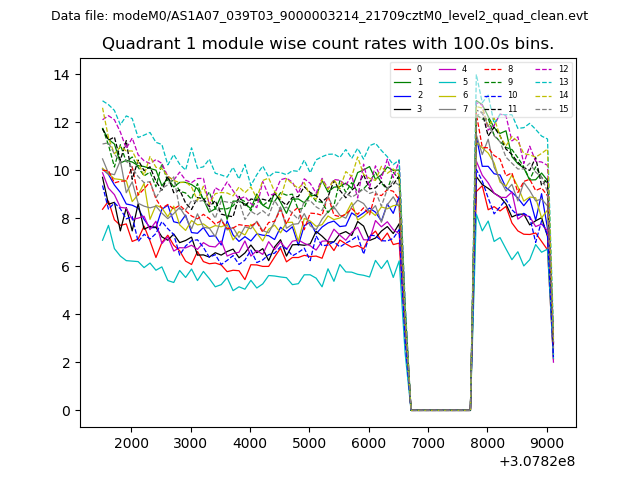
| Module-wise count rates for Quadrant A Data is divided into 100 sec bins |
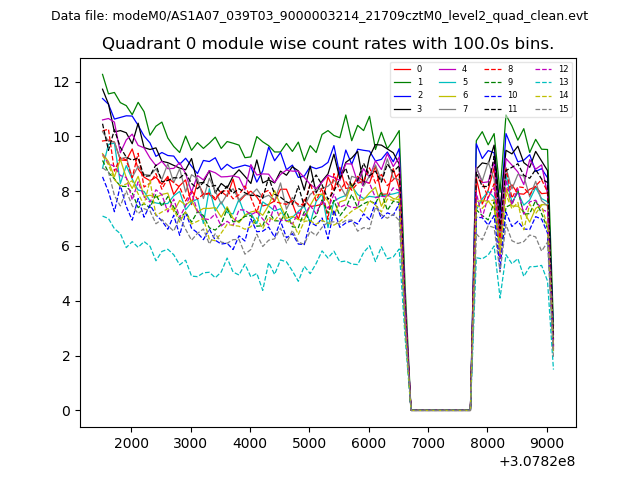 |
 |
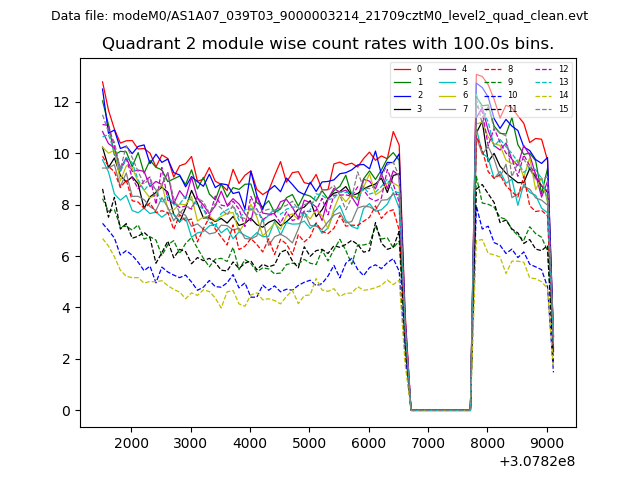
| Module-wise count rates for Quadrant B Data is divided into 100 sec bins |
 |
 |
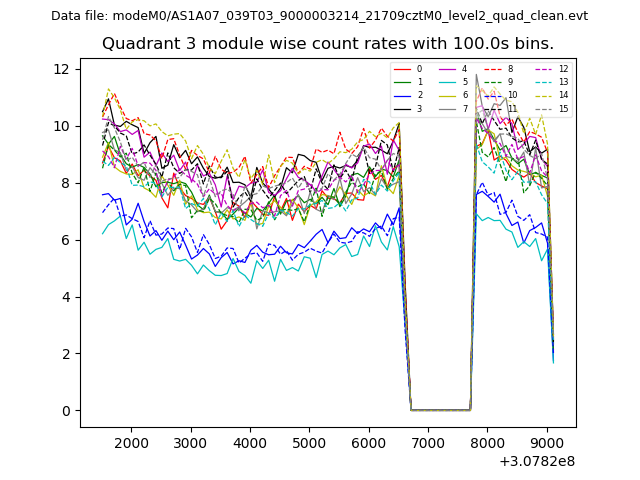
| Module-wise count rates for Quadrant C Data is divided into 100 sec bins |
 |
 |
| Module-wise count rates for Quadrant D Data is divided into 100 sec bins |
 |
 |
| Parameter | Plot |
|---|---|
| CZT HV Monitor | 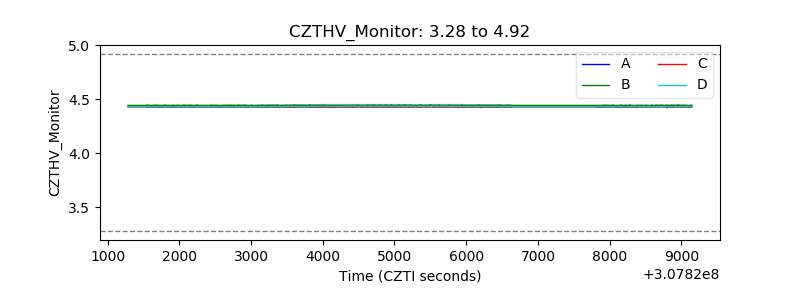 |
| D_VDD | 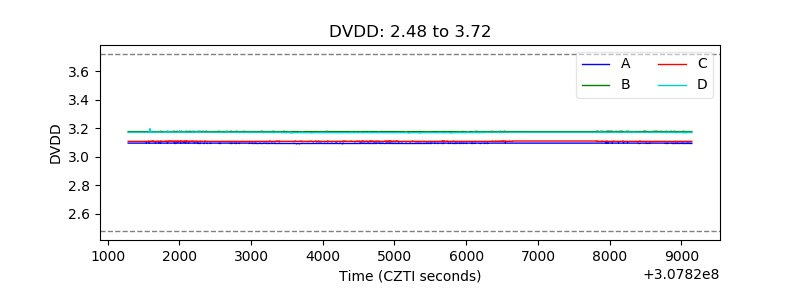 |
| Temperature 1 | 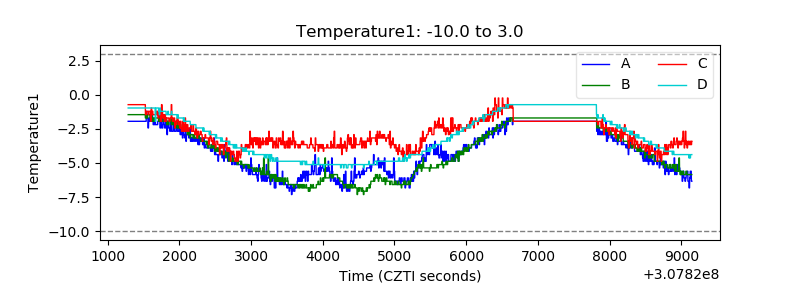 |
| Veto HV Monitor | 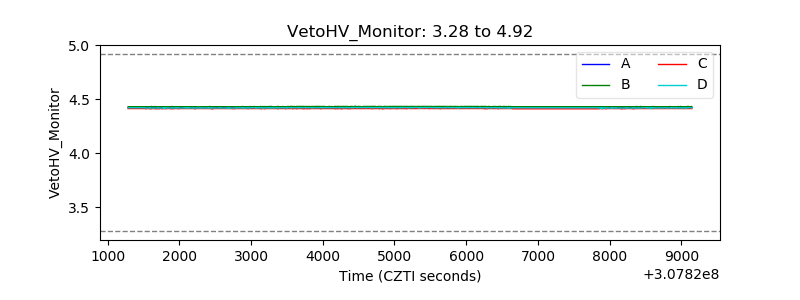 |
| Veto LLD |  |
| Alpha Counter | 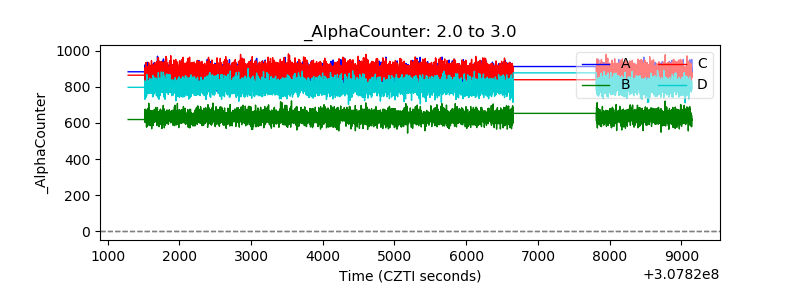 |
| _CPM_Rate | 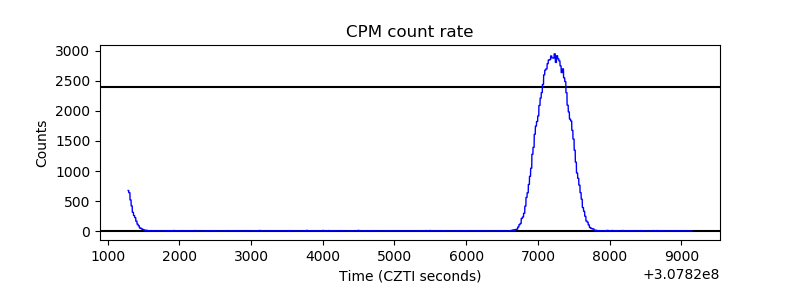 |
| CZT Counter | 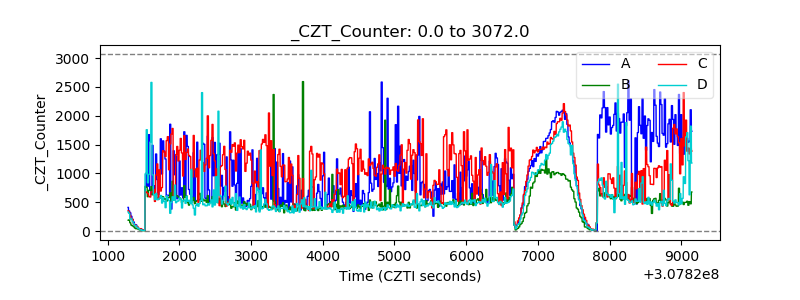 |
| +2.5 Volts monitor |  |
| +5 Volts monitor |  |
| _ROLL_ROT | 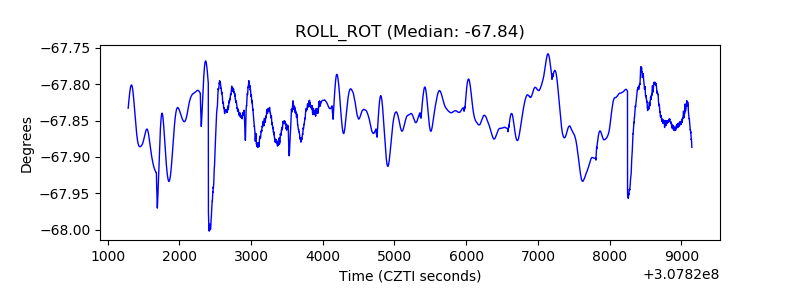 |
| _Roll_DEC | 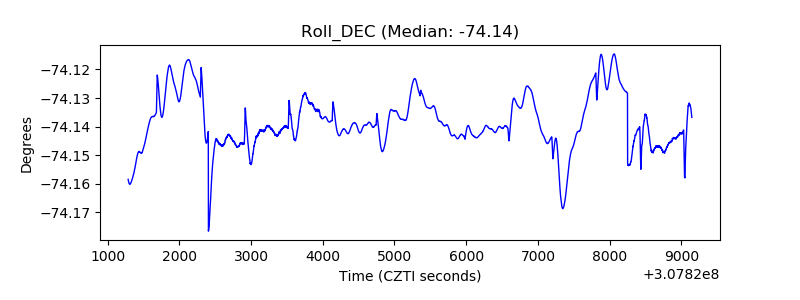 |
| _Roll_RA | 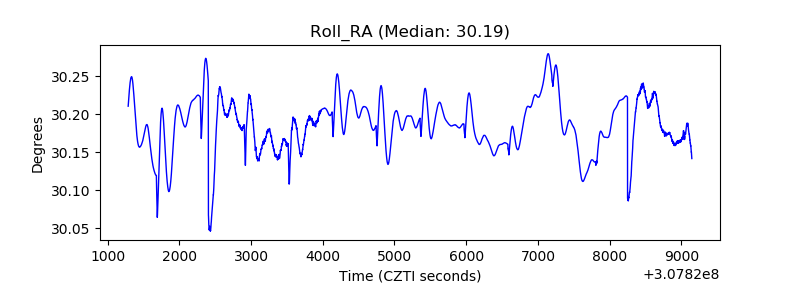 |
| Veto Counter | 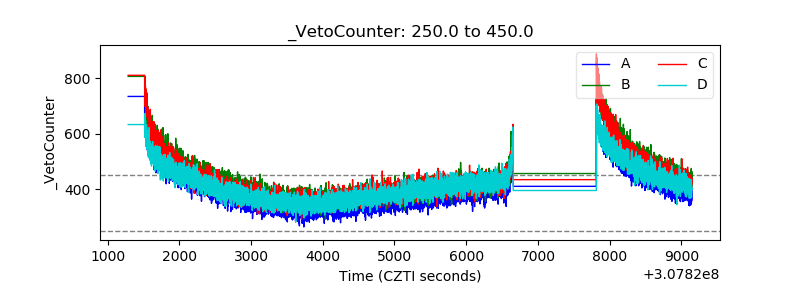 |