| Param | Original file | Final file |
|---|---|---|
| Filename | modeM0/AS1A07_039T03_9000003214_21711cztM0_level2.evt | modeM0/AS1A07_039T03_9000003214_21711cztM0_level2_quad_clean.evt |
| Size (bytes) | 497,387,520 | 120,384,000 |
| Size | 474.3 MB | 114.8 MB |
| Events in quadrant A | 5,598,956 | 791,066 |
| Events in quadrant B | 3,025,276 | 854,735 |
| Events in quadrant C | 2,952,641 | 820,314 |
| Events in quadrant D | 3,103,451 | 784,747 |
| Mode M0 | |||
|---|---|---|---|
| Quadrant | BADHDUFLAG | Total packets | Discarded packets |
| A | 0 | 20542 | 2 |
| B | 0 | 12638 | 2 |
| C | 0 | 12281 | 2 |
| D | 0 | 13069 | 2 |
| Mode M9 | |||
|---|---|---|---|
| Quadrant | BADHDUFLAG | Total packets | Discarded packets |
| A | 0 | 24 | 0 |
| B | 0 | 25 | 0 |
| C | 0 | 25 | 0 |
| D | 0 | 25 | 0 |
| Mode SS | |||
|---|---|---|---|
| Quadrant | BADHDUFLAG | Total packets | Discarded packets |
| A | 0 | 116 | 0 |
| B | 0 | 116 | 0 |
| C | 0 | 116 | 0 |
| D | 0 | 116 | 0 |
| Quadrant | Total seconds | Saturated seconds | Saturation percentage |
|---|---|---|---|
| A | 5649 | 391 | 6.921579% |
| B | 5649 | 52 | 0.920517% |
| C | 5649 | 58 | 1.026730% |
| D | 5649 | 37 | 0.654983% |
Noise dominated data is calculated using 1-second bins in cleaned event files. If a bin has >2000 counts, and if more than 50% of those come from <1% of pixels, then it is considered to be noise-dominated and hence unusable.
| Quadrant | # 1 sec bins | Bins with >0 counts | Bins with >2000 counts | High rate bins dominated by noise | Noise dominated (total time) | Noise dominated (detector-on time) | Marked lightcurve |
|---|---|---|---|---|---|---|---|
| A | 6979 | 5650 | 151 | 151 | 2.16% | 2.67% | 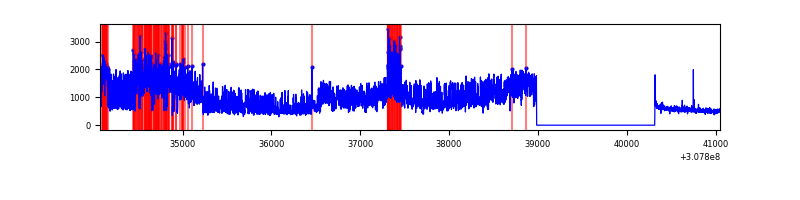 |
| B | 6979 | 5650 | 20 | 20 | 0.29% | 0.35% |  |
| C | 6979 | 5650 | 0 | 0 | 0.00% | 0.00% | 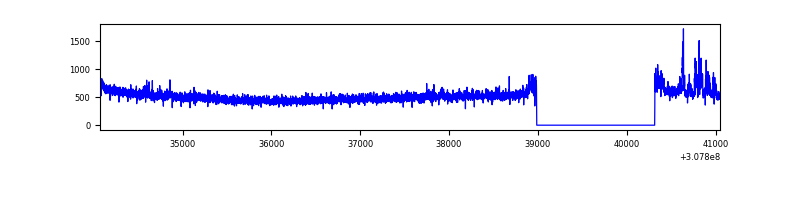 |
| D | 6979 | 5650 | 13 | 13 | 0.19% | 0.23% | 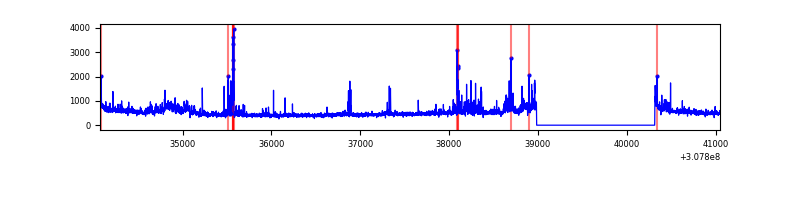 |
Top three noisy pixels from each quadrant. If the there are fewer than three noisy pixels in the level2.evt file, extra rows are filled as -1
| Pixel properties | Quadrant properties | ||||||
|---|---|---|---|---|---|---|---|
| Quadrant | DetID | PixID | Counts | Sigma | Mean | Median | Sigma |
| A | 15 | 236 | 2881535 | 20513.24 | 700 | 686 | 140.4 |
| A | 13 | 254 | 9620 | 63.62 | 700 | 686 | 140.4 |
| A | 10 | 253 | 9462 | 62.49 | 700 | 686 | 140.4 |
| B | 3 | 64 | 61927 | 459.28 | 721 | 704 | 133.3 |
| B | 0 | 230 | 54484 | 403.45 | 721 | 704 | 133.3 |
| B | 4 | 190 | 38851 | 286.17 | 721 | 704 | 133.3 |
| C | 14 | 238 | 112793 | 688.01 | 700 | 705 | 162.9 |
| C | 8 | 208 | 104195 | 635.23 | 700 | 705 | 162.9 |
| C | 13 | 61 | 4905 | 25.78 | 700 | 705 | 162.9 |
| D | 2 | 136 | 132873 | 797.59 | 693 | 672 | 165.7 |
| D | 12 | 227 | 110312 | 661.48 | 693 | 672 | 165.7 |
| D | 1 | 52 | 91592 | 548.54 | 693 | 672 | 165.7 |
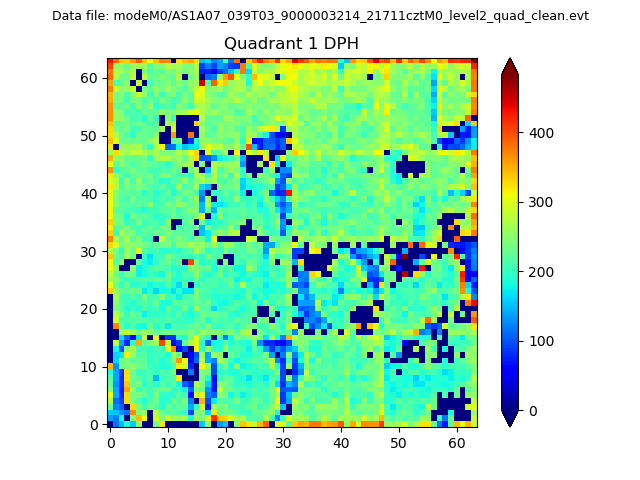
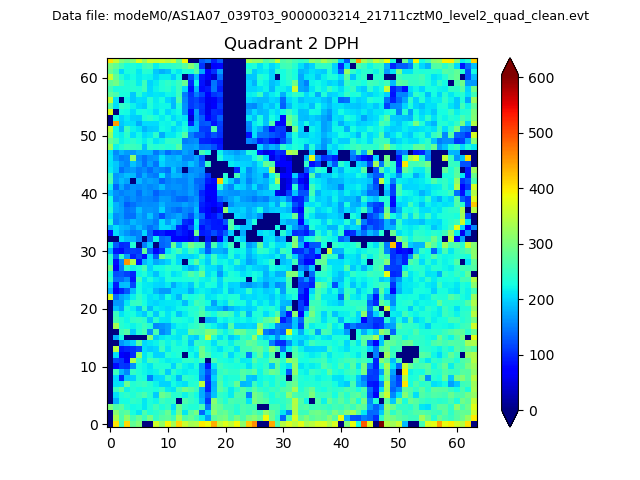
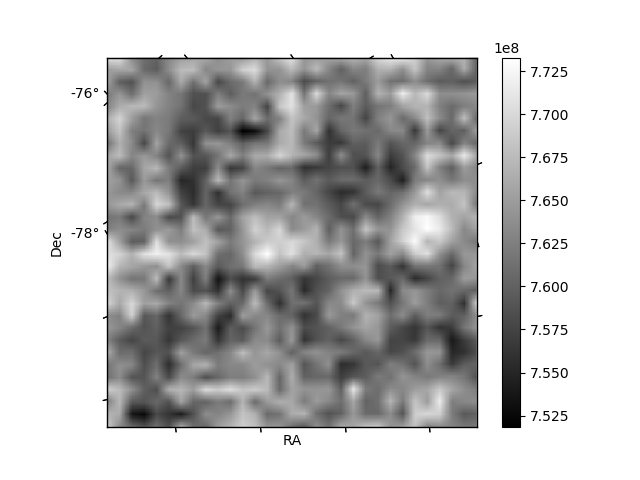
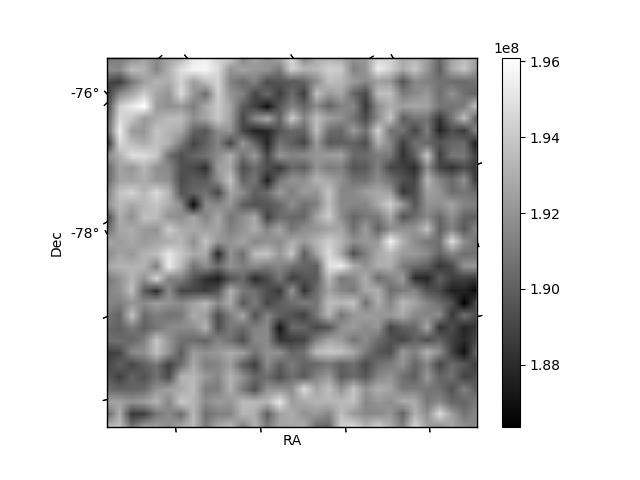
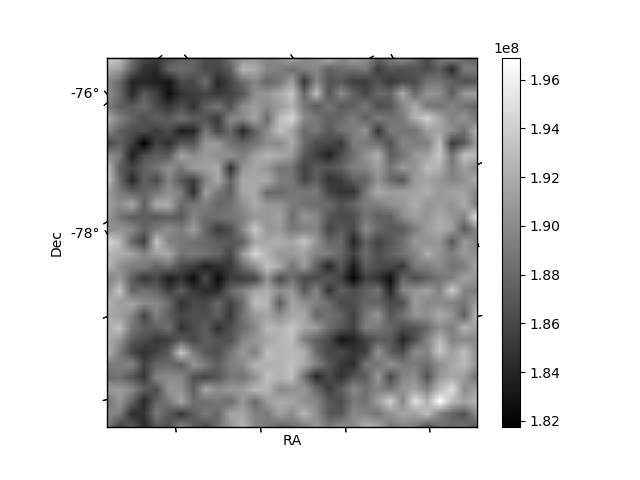
Histogram calculated using DETX and DETY for each event in the final _common_clean file
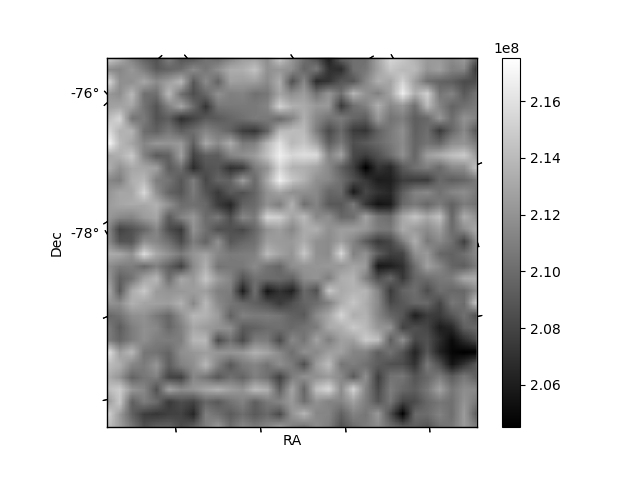
| Quadrant A | 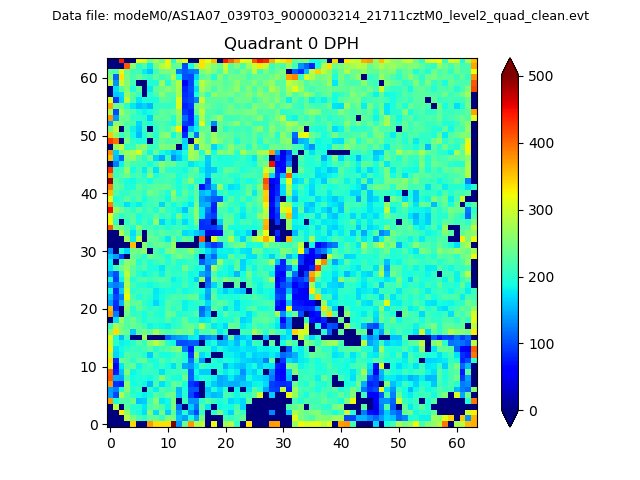 |
 |
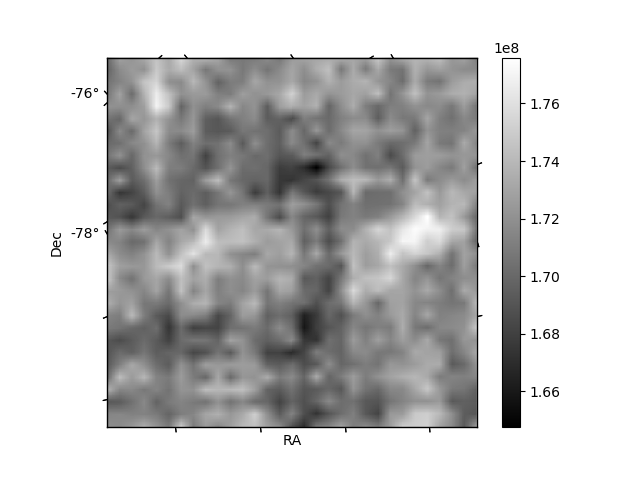
Quadrant B |
|---|---|---|---|
| Quadrant D | 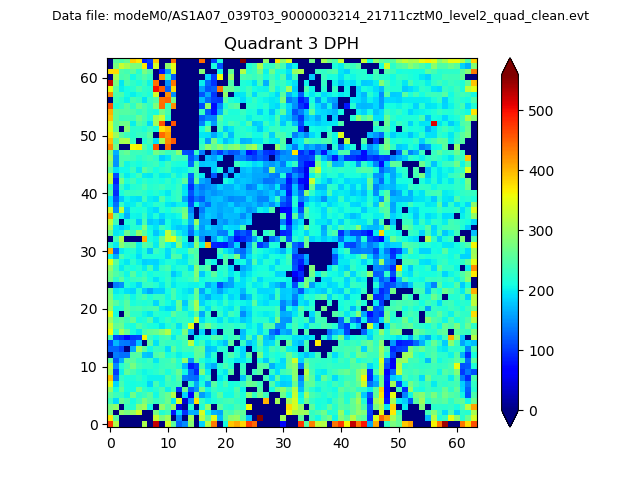 |
 |
Quadrant C |
| Plot type | Count rate plots | Images |
|---|---|---|
| Comparison with Poisson distribution Blue bars denote a histogram of data divided into 1 sec bins. Red curve is a Poisson curve with rate = median count rate of data. |
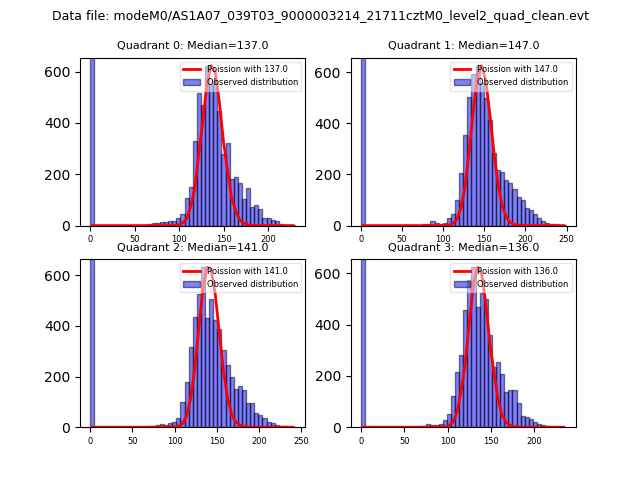 |
 |
| Quadrant-wise count rates Data is divided into 100 sec bins |
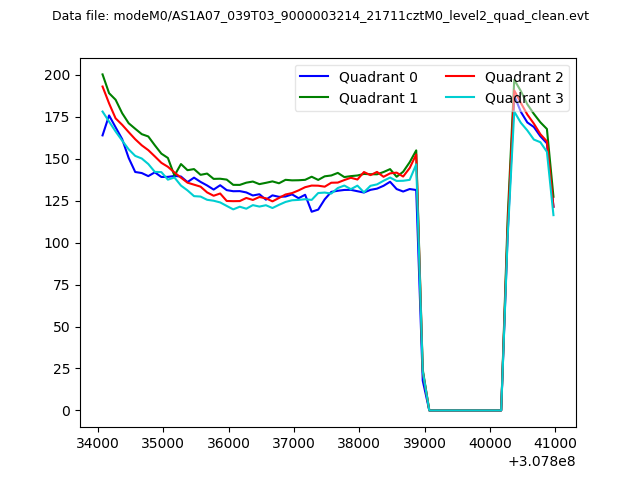 |
|
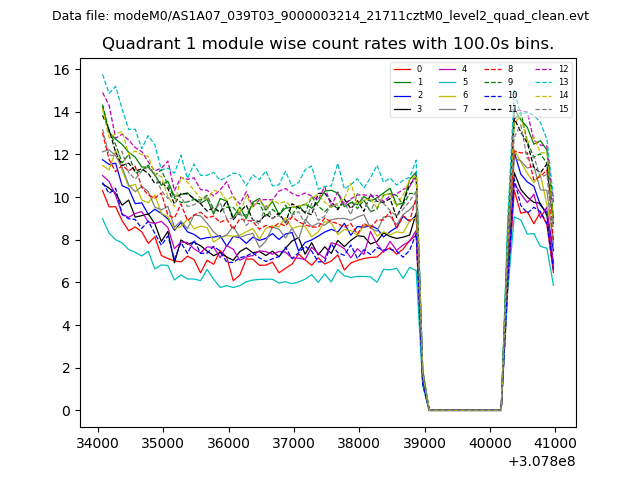
| Module-wise count rates for Quadrant A Data is divided into 100 sec bins |
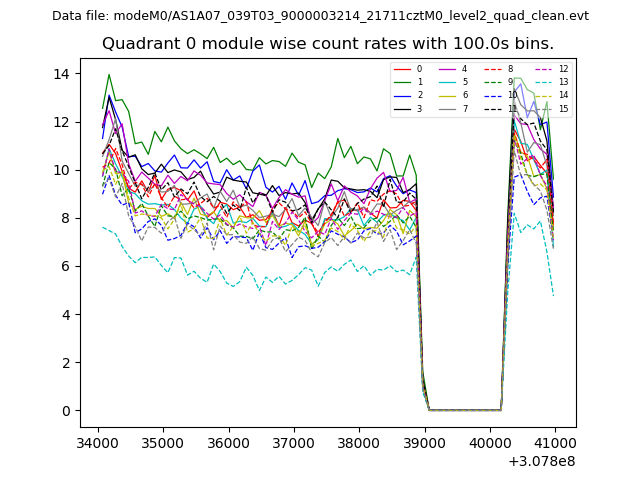 |
 |
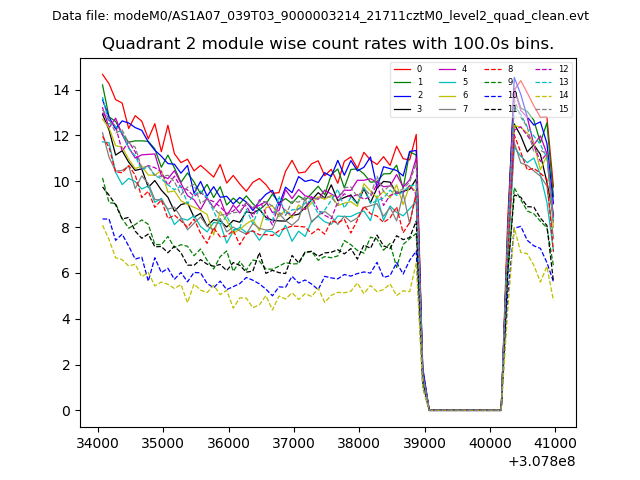
| Module-wise count rates for Quadrant B Data is divided into 100 sec bins |
 |
 |
| Module-wise count rates for Quadrant C Data is divided into 100 sec bins |
 |
 |
| Module-wise count rates for Quadrant D Data is divided into 100 sec bins |
 |
 |
| Parameter | Plot |
|---|---|
| CZT HV Monitor | 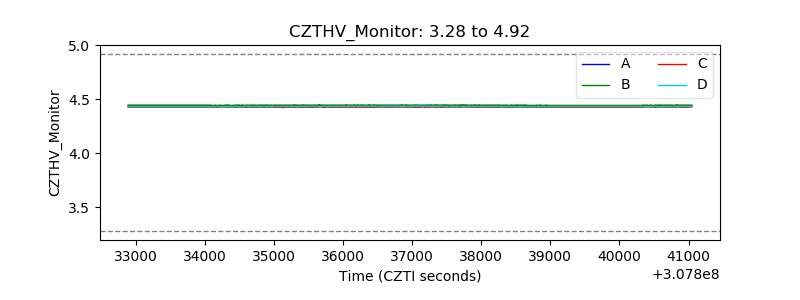 |
| D_VDD | 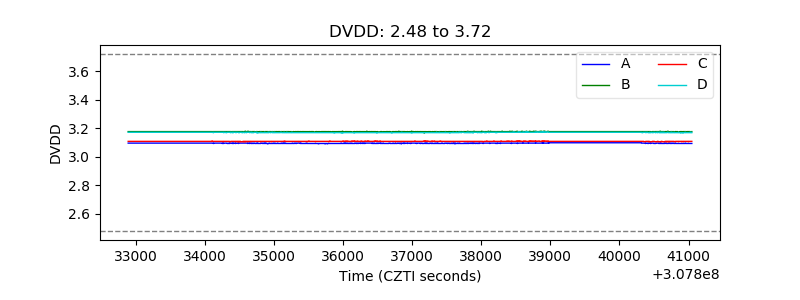 |
| Temperature 1 | 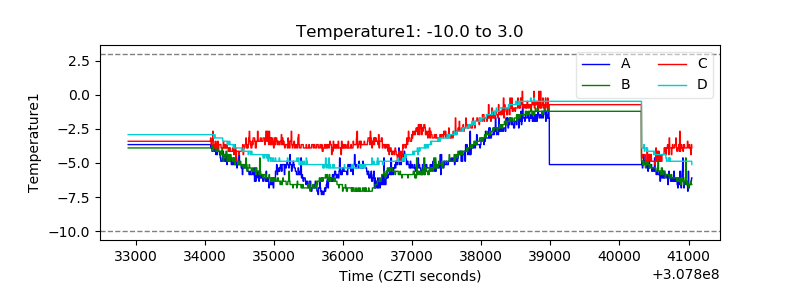 |
| Veto HV Monitor | 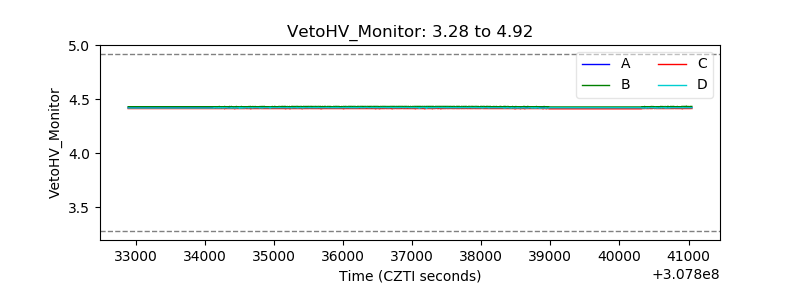 |
| Veto LLD |  |
| Alpha Counter | 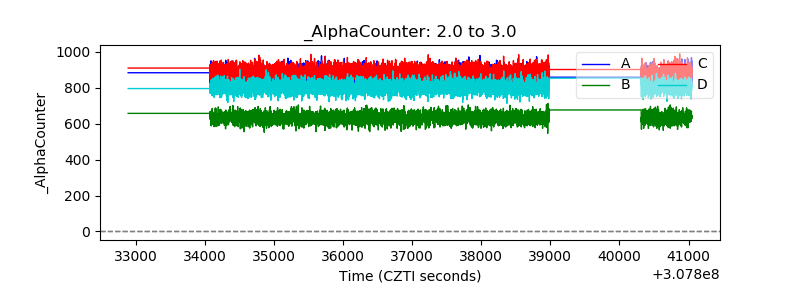 |
| _CPM_Rate | 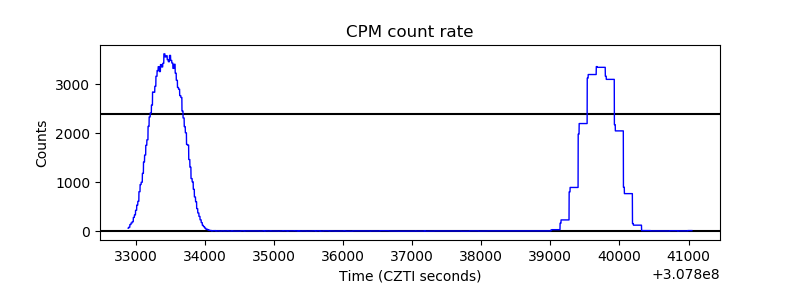 |
| CZT Counter | 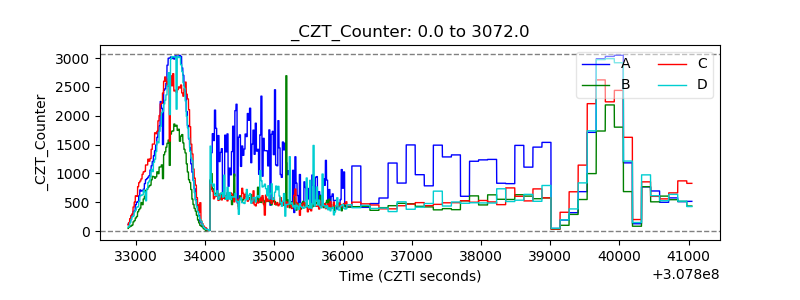 |
| +2.5 Volts monitor |  |
| +5 Volts monitor |  |
| _ROLL_ROT | 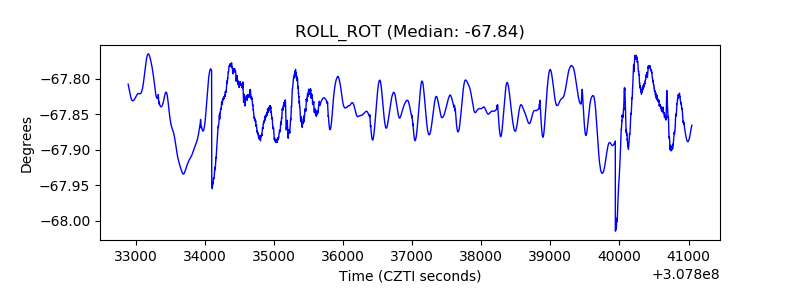 |
| _Roll_DEC | 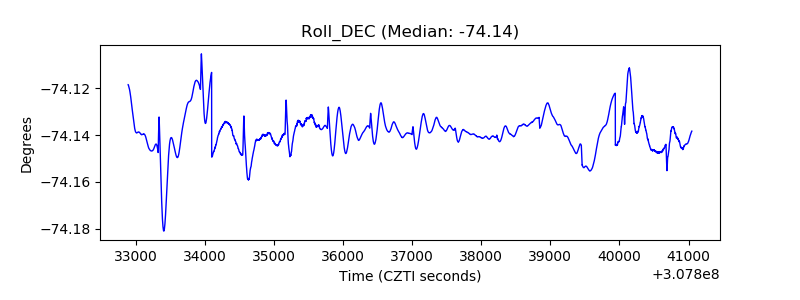 |
| _Roll_RA | 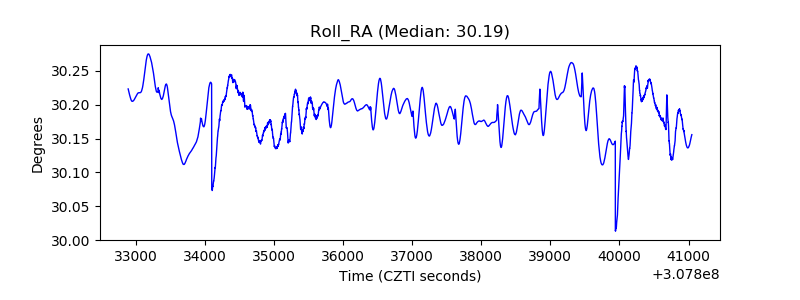 |
| Veto Counter | 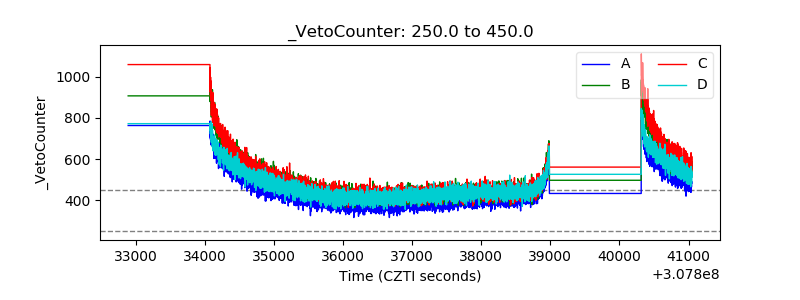 |