| Param | Original file | Final file |
|---|---|---|
| Filename | modeM0/AS1A07_039T03_9000003214_21712cztM0_level2.evt | modeM0/AS1A07_039T03_9000003214_21712cztM0_level2_quad_clean.evt |
| Size (bytes) | 61,505,280 | 18,737,280 |
| Size | 58.7 MB | 17.9 MB |
| Events in quadrant A | 411,647 | 125,497 |
| Events in quadrant B | 471,660 | 133,507 |
| Events in quadrant C | 495,263 | 127,761 |
| Events in quadrant D | 431,168 | 121,625 |
| Mode M0 | |||
|---|---|---|---|
| Quadrant | BADHDUFLAG | Total packets | Discarded packets |
| A | 0 | 1657 | 1 |
| B | 0 | 1902 | 1 |
| C | 0 | 1980 | 1 |
| D | 0 | 1727 | 1 |
| Mode M9 | |||
|---|---|---|---|
| Quadrant | BADHDUFLAG | Total packets | Discarded packets |
| A | 0 | 4 | 0 |
| B | 0 | 5 | 0 |
| C | 0 | 5 | 0 |
| D | 0 | 5 | 0 |
| Mode SS | |||
|---|---|---|---|
| Quadrant | BADHDUFLAG | Total packets | Discarded packets |
| A | 0 | 14 | 0 |
| B | 0 | 14 | 0 |
| C | 0 | 14 | 0 |
| D | 0 | 14 | 0 |
| Quadrant | Total seconds | Saturated seconds | Saturation percentage |
|---|---|---|---|
| A | 734 | 7 | 0.953678% |
| B | 734 | 13 | 1.771117% |
| C | 734 | 15 | 2.043597% |
| D | 734 | 2 | 0.272480% |
Noise dominated data is calculated using 1-second bins in cleaned event files. If a bin has >2000 counts, and if more than 50% of those come from <1% of pixels, then it is considered to be noise-dominated and hence unusable.
| Quadrant | # 1 sec bins | Bins with >0 counts | Bins with >2000 counts | High rate bins dominated by noise | Noise dominated (total time) | Noise dominated (detector-on time) | Marked lightcurve |
|---|---|---|---|---|---|---|---|
| A | 734 | 734 | 0 | 0 | 0.00% | 0.00% | 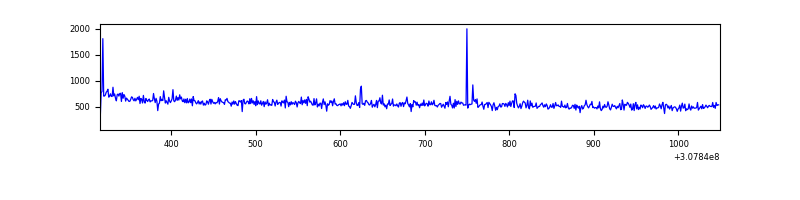 |
| B | 734 | 734 | 4 | 4 | 0.54% | 0.54% | 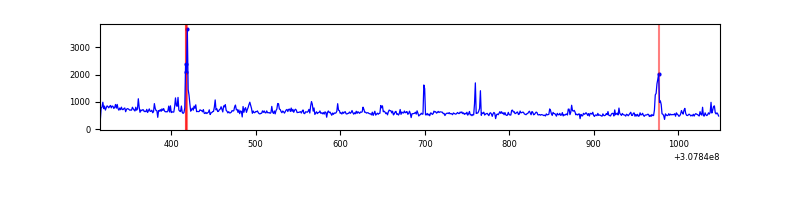 |
| C | 734 | 734 | 0 | 0 | 0.00% | 0.00% | 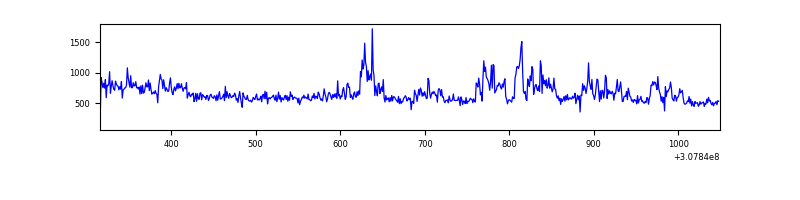 |
| D | 734 | 734 | 1 | 1 | 0.14% | 0.14% | 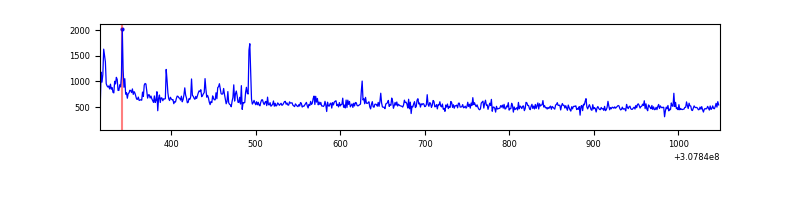 |
Top three noisy pixels from each quadrant. If the there are fewer than three noisy pixels in the level2.evt file, extra rows are filled as -1
| Pixel properties | Quadrant properties | ||||||
|---|---|---|---|---|---|---|---|
| Quadrant | DetID | PixID | Counts | Sigma | Mean | Median | Sigma |
| A | 10 | 253 | 5640 | 241.01 | 104 | 102 | 23.0 |
| A | 15 | 236 | 1442 | 58.32 | 104 | 102 | 23.0 |
| A | 13 | 254 | 1251 | 50.0 | 104 | 102 | 23.0 |
| B | 3 | 64 | 28542 | 1322.12 | 108 | 105 | 21.5 |
| B | 0 | 230 | 8206 | 376.64 | 108 | 105 | 21.5 |
| B | 0 | 245 | 6891 | 315.5 | 108 | 105 | 21.5 |
| C | 8 | 208 | 75672 | 2939.91 | 103 | 103 | 25.7 |
| C | 14 | 238 | 16680 | 644.9 | 103 | 103 | 25.7 |
| C | 0 | 10 | 678 | 22.37 | 103 | 103 | 25.7 |
| D | 1 | 52 | 16080 | 621.17 | 101 | 98 | 25.7 |
| D | 12 | 235 | 11897 | 458.59 | 101 | 98 | 25.7 |
| D | 14 | 35 | 9958 | 383.23 | 101 | 98 | 25.7 |
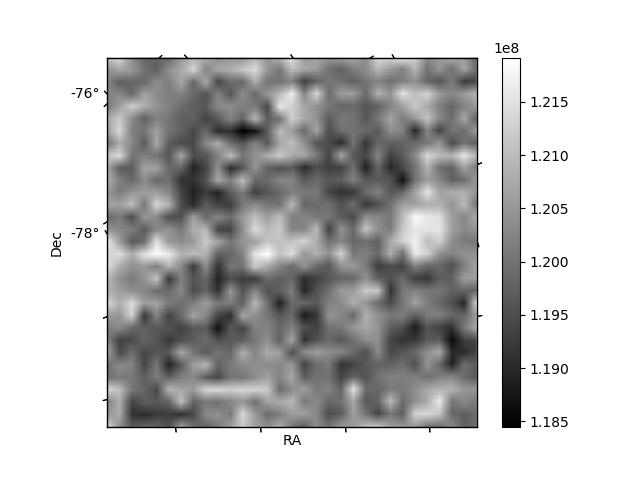
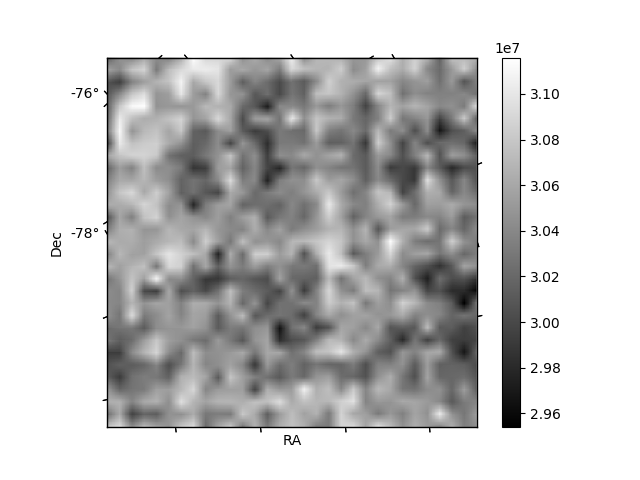
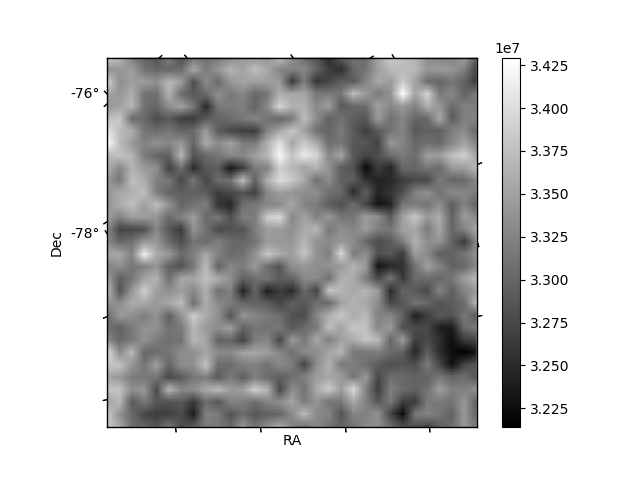
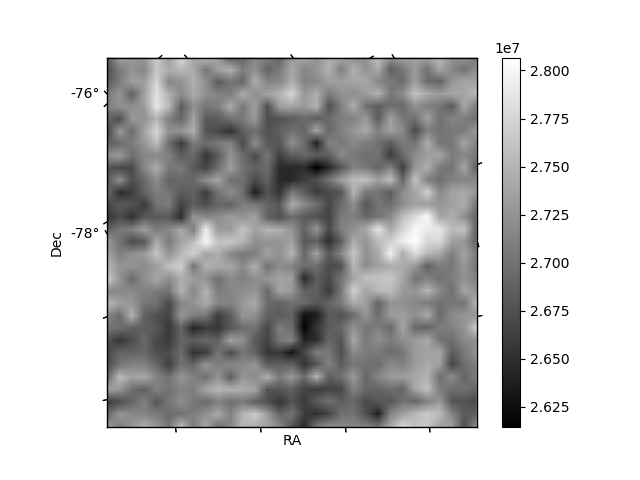
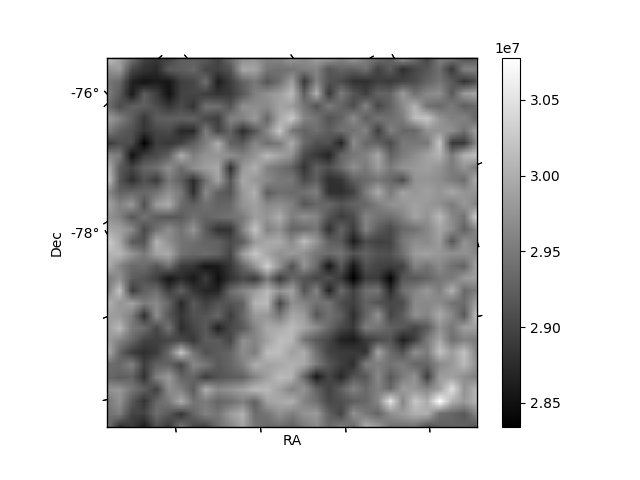
Histogram calculated using DETX and DETY for each event in the final _common_clean file
| Quadrant A | 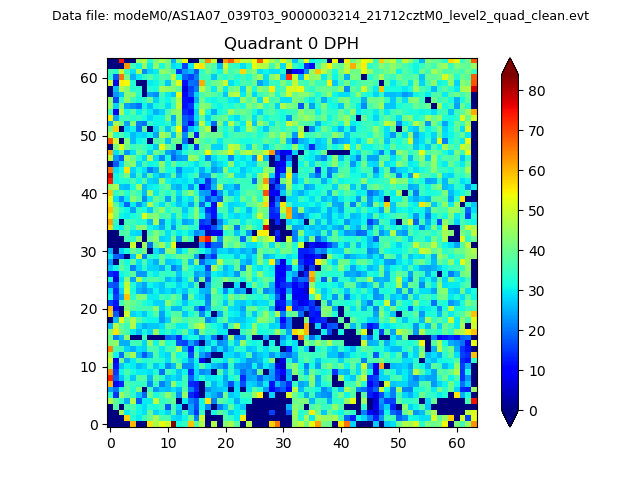 |
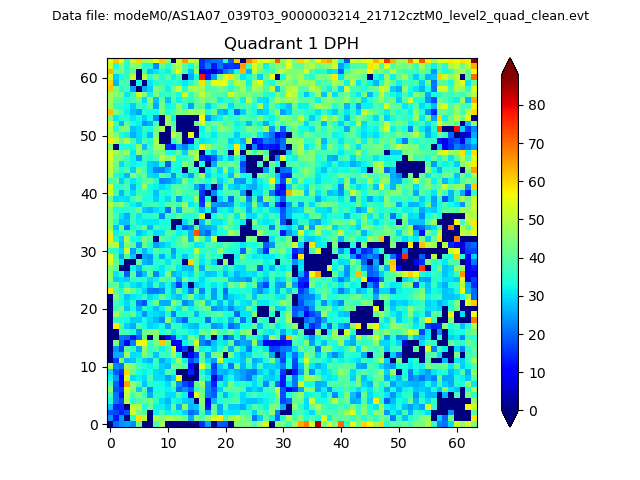 |
Quadrant B |
|---|---|---|---|
| Quadrant D | 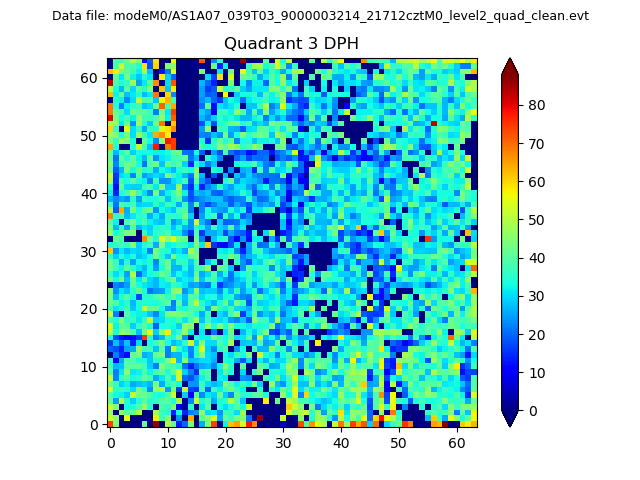 |
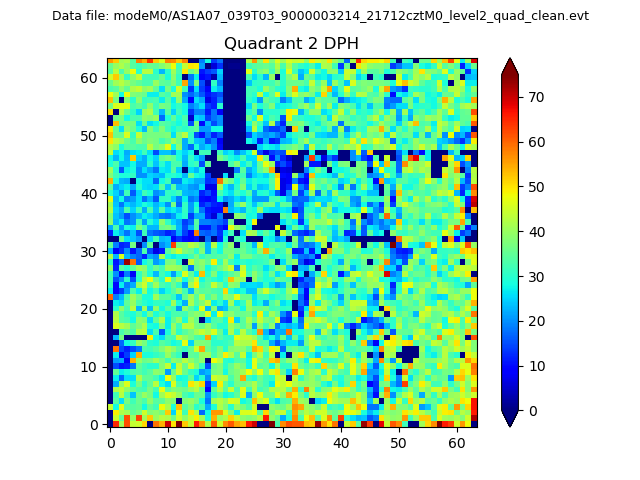 |
Quadrant C |
| Plot type | Count rate plots | Images |
|---|---|---|
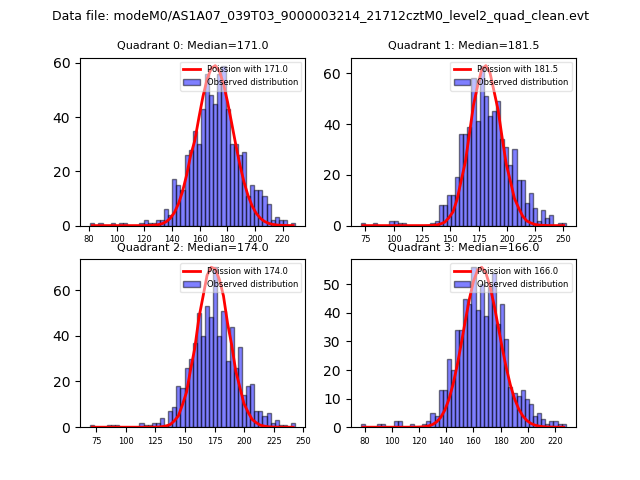
| Comparison with Poisson distribution Blue bars denote a histogram of data divided into 1 sec bins. Red curve is a Poisson curve with rate = median count rate of data. |
 |
 |
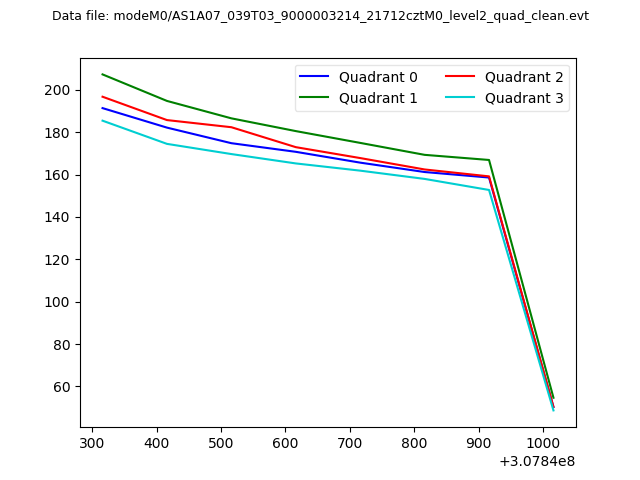
| Quadrant-wise count rates Data is divided into 100 sec bins |
 |
|
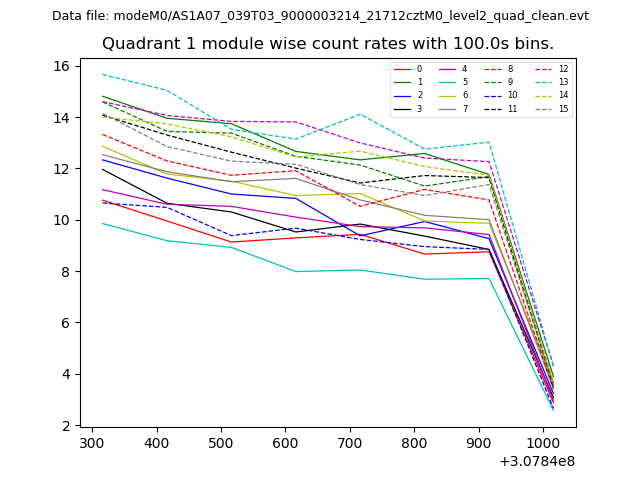
| Module-wise count rates for Quadrant A Data is divided into 100 sec bins |
 |
 |
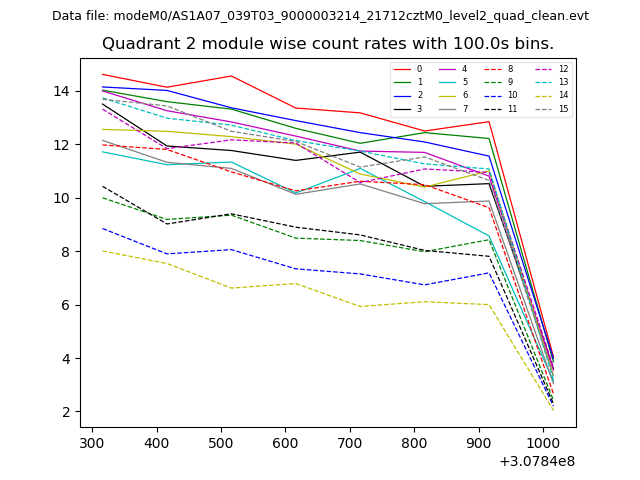
| Module-wise count rates for Quadrant B Data is divided into 100 sec bins |
 |
 |
| Module-wise count rates for Quadrant C Data is divided into 100 sec bins |
 |
 |
| Module-wise count rates for Quadrant D Data is divided into 100 sec bins |
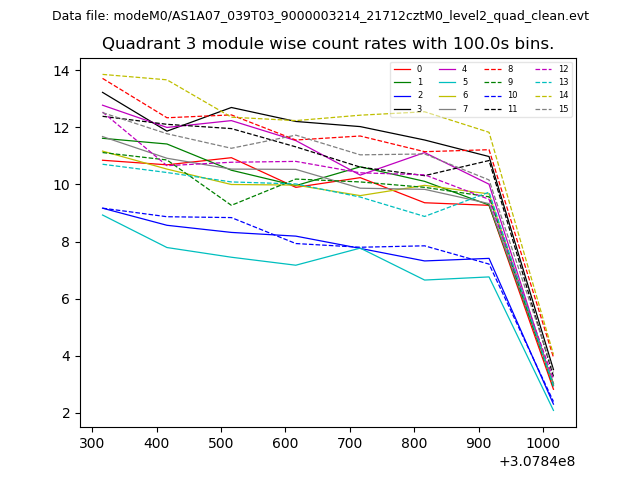 |
 |
| Parameter | Plot |
|---|---|
| CZT HV Monitor |  |
| D_VDD | 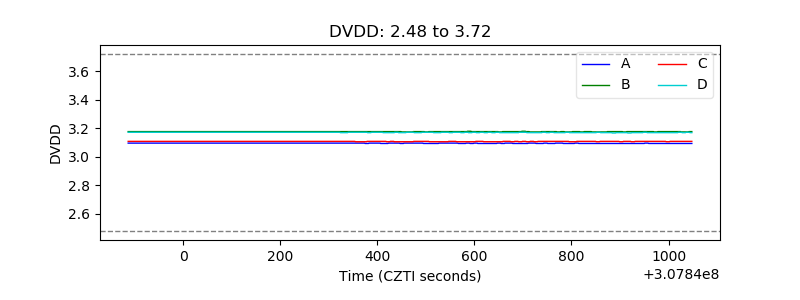 |
| Temperature 1 | 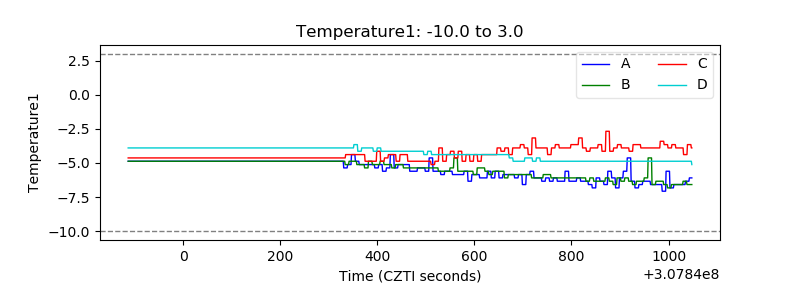 |
| Veto HV Monitor | 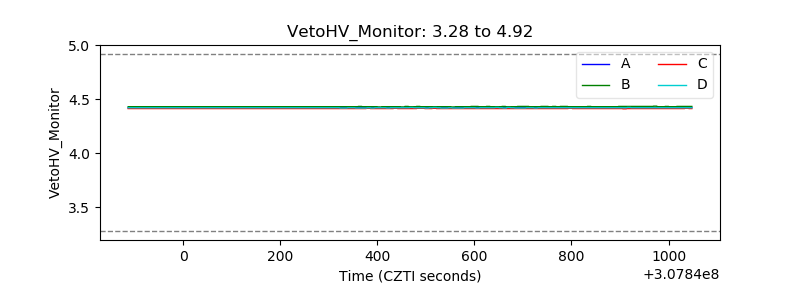 |
| Veto LLD | 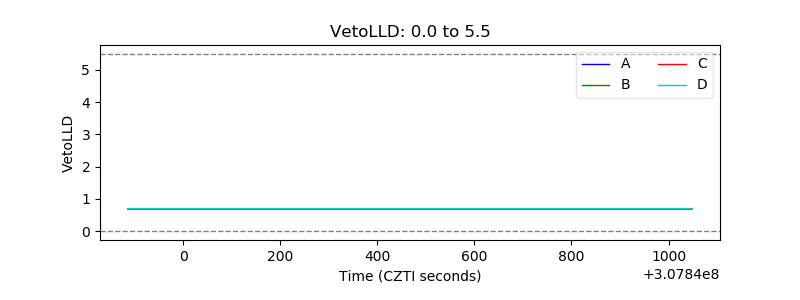 |
| Alpha Counter | 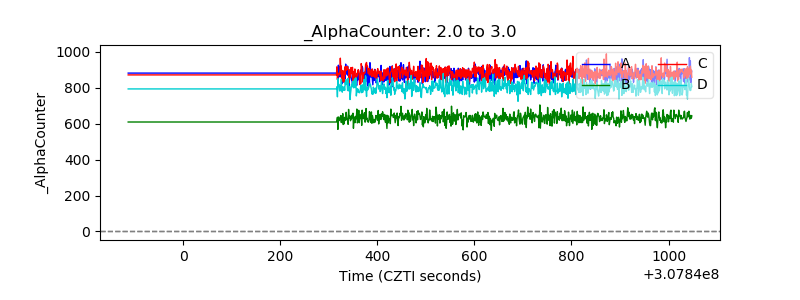 |
| _CPM_Rate | 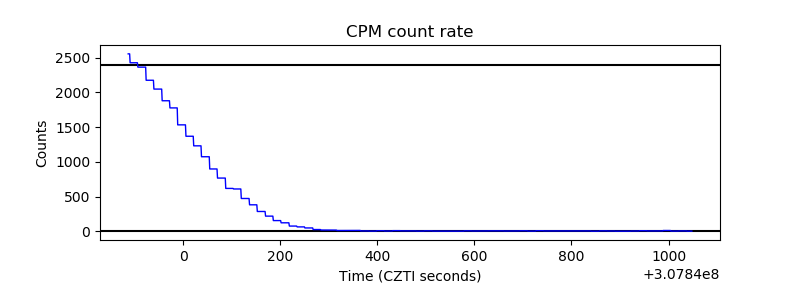 |
| CZT Counter | 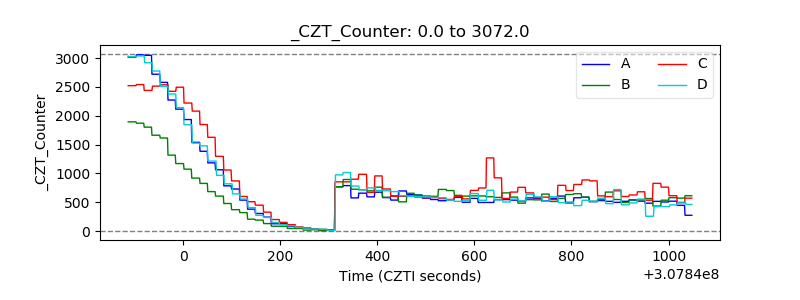 |
| +2.5 Volts monitor |  |
| +5 Volts monitor |  |
| _ROLL_ROT | 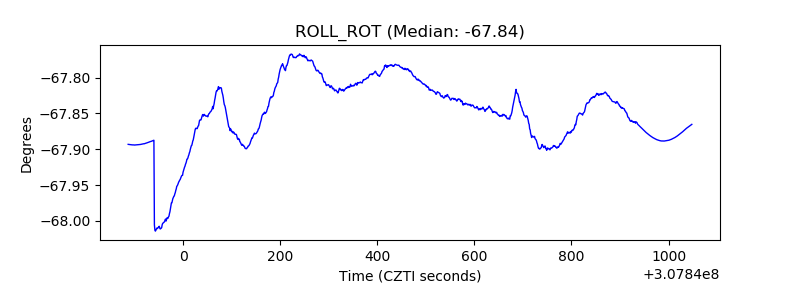 |
| _Roll_DEC | 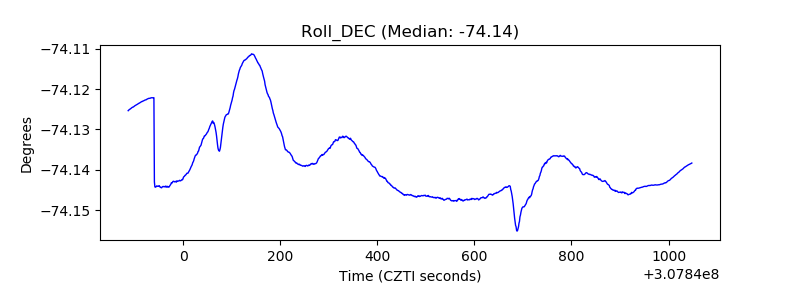 |
| _Roll_RA | 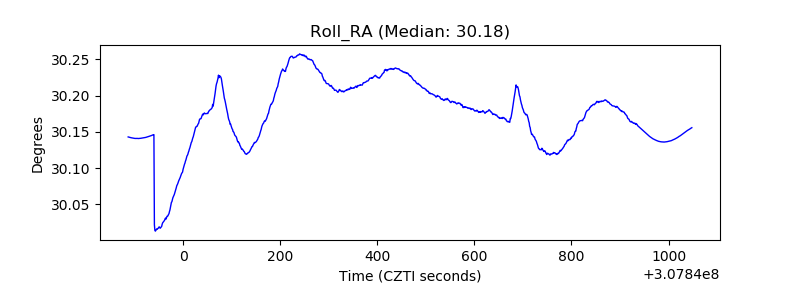 |
| Veto Counter | 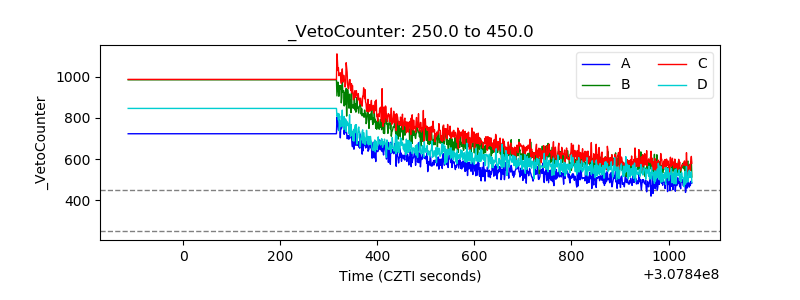 |