| Param | Original file | Final file |
|---|---|---|
| Filename | modeM0/AS1A07_010T04_9000003220cztM0_level2.fits | modeM0/AS1A07_010T04_9000003220cztM0_level2_quad_clean.evt |
| Size (bytes) | 368,176,320 | 325,874,880 |
| Size | 351.1 MB | 310.8 MB |
| Events in quadrant A | 2,186,122 | 1,754,303 |
| Events in quadrant B | 2,222,274 | 2,007,565 |
| Events in quadrant C | 2,303,440 | 1,914,334 |
| Events in quadrant D | 1,848,702 | 1,605,895 |
| Mode SS | |||
|---|---|---|---|
| Quadrant | BADHDUFLAG | Total packets | Discarded packets |
| A | 0 | 766 | 0 |
| B | 0 | 766 | 0 |
| C | 0 | 766 | 0 |
| D | 0 | 766 | 0 |
| Mode M9 | |||
|---|---|---|---|
| Quadrant | BADHDUFLAG | Total packets | Discarded packets |
| A | 0 | 77 | 0 |
| B | 0 | 77 | 0 |
| C | 0 | 77 | 0 |
| D | 0 | 77 | 0 |
| Mode M0 | |||
|---|---|---|---|
| Quadrant | BADHDUFLAG | Total packets | Discarded packets |
| A | 0 | 102942 | 0 |
| B | 0 | 80916 | 0 |
| C | 0 | 78266 | 0 |
| D | 0 | 135075 | 0 |
| Quadrant | Total seconds | Saturated seconds | Saturation percentage |
|---|---|---|---|
| A | 37656 | 3833 | 10.178989% |
| B | 37656 | 436 | 1.157850% |
| C | 37656 | 455 | 1.208307% |
| D | 37656 | 5672 | 15.062673% |
Noise dominated data is calculated using 1-second bins in cleaned event files. If a bin has >2000 counts, and if more than 50% of those come from <1% of pixels, then it is considered to be noise-dominated and hence unusable.
| Quadrant | # 1 sec bins | Bins with >0 counts | Bins with >2000 counts | High rate bins dominated by noise | Noise dominated (total time) | Noise dominated (detector-on time) | Marked lightcurve |
|---|---|---|---|---|---|---|---|
| A | 45281 | 37652 | 0 | 0 | 0.00% | 0.00% |  |
| B | 45281 | 37656 | 0 | 0 | 0.00% | 0.00% |  |
| C | 45281 | 37656 | 0 | 0 | 0.00% | 0.00% |  |
| D | 45281 | 37648 | 0 | 0 | 0.00% | 0.00% |  |
Top three noisy pixels from each quadrant. If the there are fewer than three noisy pixels in the level2.evt file, extra rows are filled as -1
| Pixel properties | Quadrant properties | ||||||
|---|---|---|---|---|---|---|---|
| Quadrant | DetID | PixID | Counts | Sigma | Mean | Median | Sigma |
| A | 0 | 29 | 2011 | 10.37 | 569 | 535 | 142.3 |
| A | 7 | 110 | 1794 | 8.85 | 569 | 535 | 142.3 |
| A | 0 | 30 | 1597 | 7.46 | 569 | 535 | 142.3 |
| B | 2 | 9 | 1747 | 10.17 | 588 | 563 | 116.5 |
| B | 14 | 254 | 1469 | 7.78 | 588 | 563 | 116.5 |
| B | 3 | 17 | 1464 | 7.74 | 588 | 563 | 116.5 |
| C | 3 | 234 | 1606 | 6.63 | 608 | 571 | 156.2 |
| C | 3 | 126 | 1574 | 6.42 | 608 | 571 | 156.2 |
| C | 12 | 241 | 1560 | 6.33 | 608 | 571 | 156.2 |
| D | 6 | 231 | 1370 | 6.3 | 527 | 480 | 141.3 |
| D | 10 | 189 | 1334 | 6.04 | 527 | 480 | 141.3 |
| D | 7 | 3 | 1332 | 6.03 | 527 | 480 | 141.3 |
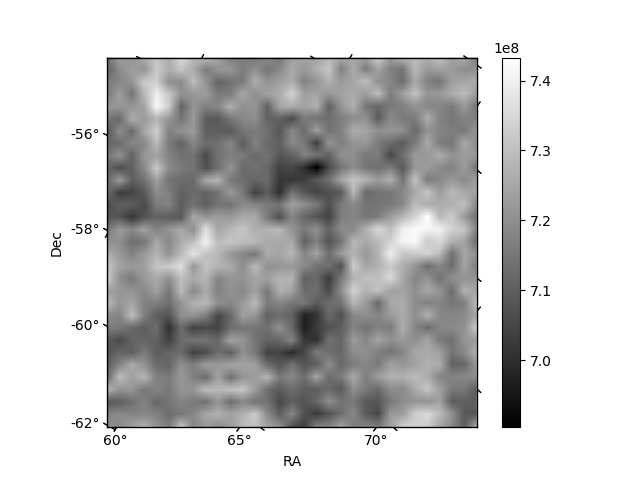
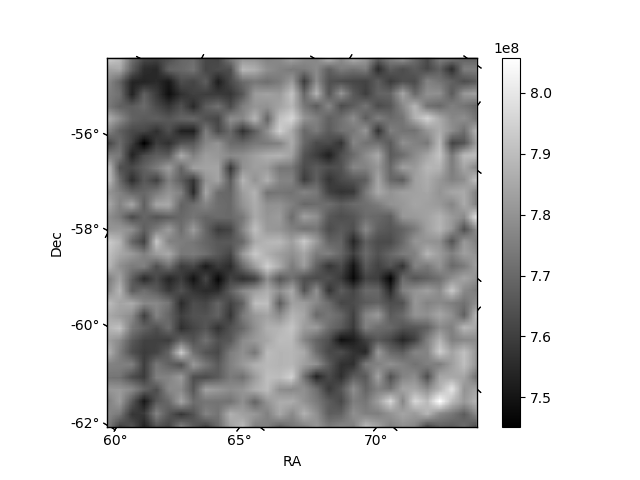
Histogram calculated using DETX and DETY for each event in the final _common_clean file
| Quadrant A | 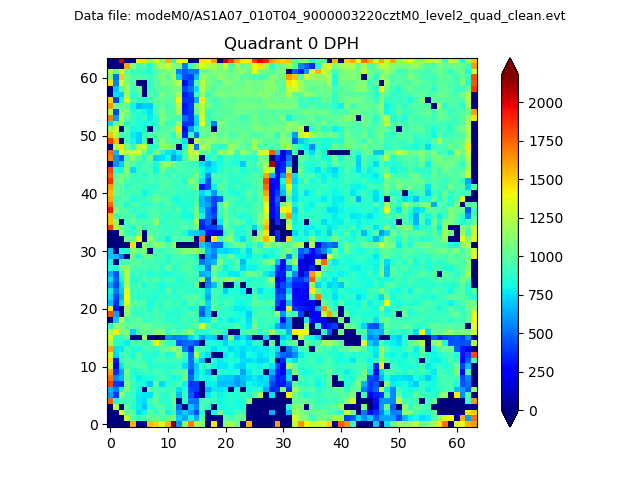 |
 |
Quadrant B |
|---|---|---|---|
| Quadrant D |  |
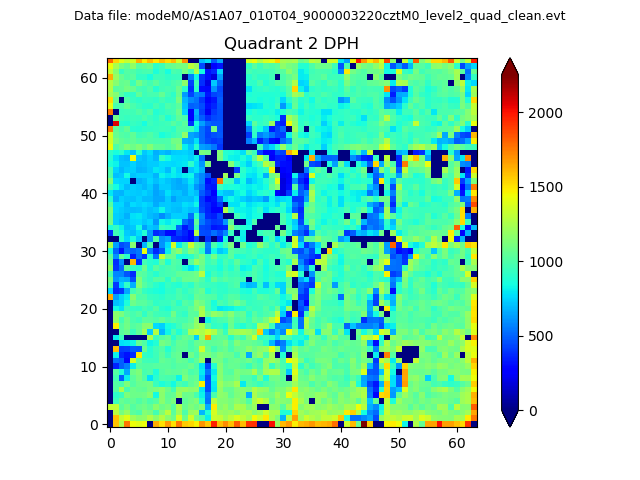 |
Quadrant C |
| Plot type | Count rate plots | Images |
|---|---|---|
| Comparison with Poisson distribution Blue bars denote a histogram of data divided into 1 sec bins. Red curve is a Poisson curve with rate = median count rate of data. |
 |
 |
| Quadrant-wise count rates Data is divided into 100 sec bins |
 |
|
| Module-wise count rates for Quadrant A Data is divided into 100 sec bins |
 |
 |
| Module-wise count rates for Quadrant B Data is divided into 100 sec bins |
 |
 |
| Module-wise count rates for Quadrant C Data is divided into 100 sec bins |
 |
 |
| Module-wise count rates for Quadrant D Data is divided into 100 sec bins |
 |
 |
| Parameter | Plot |
|---|---|
| CZT HV Monitor |  |
| D_VDD | 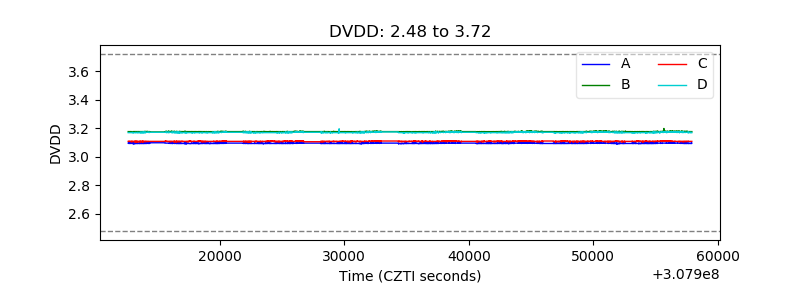 |
| Temperature 1 |  |
| Veto HV Monitor |  |
| Veto LLD |  |
| Alpha Counter | 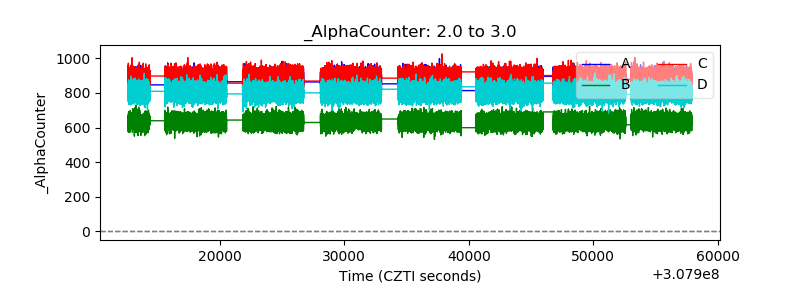 |
| _CPM_Rate |  |
| CZT Counter |  |
| +2.5 Volts monitor |  |
| +5 Volts monitor |  |
| _ROLL_ROT | 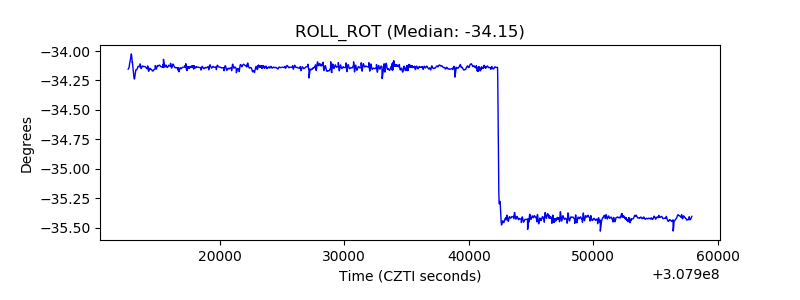 |
| _Roll_DEC |  |
| _Roll_RA | 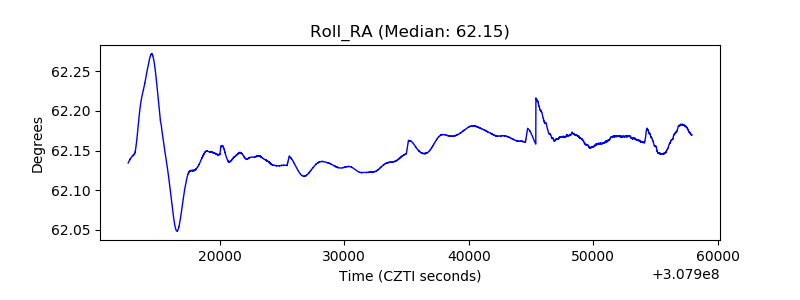 |
| Veto Counter |  |