| Param | Original file | Final file |
|---|---|---|
| Filename | modeM0/AS1A07_010T04_9000003220_21727cztM0_level2.evt | modeM0/AS1A07_010T04_9000003220_21727cztM0_level2_quad_clean.evt |
| Size (bytes) | 1,126,494,720 | 184,680,000 |
| Size | 1.0 GB | 176.1 MB |
| Events in quadrant A | 6,572,042 | 1,224,265 |
| Events in quadrant B | 5,976,218 | 1,281,747 |
| Events in quadrant C | 5,705,142 | 1,233,791 |
| Events in quadrant D | 15,096,424 | 1,067,107 |
| Mode SS | |||
|---|---|---|---|
| Quadrant | BADHDUFLAG | Total packets | Discarded packets |
| A | 0 | 232 | 0 |
| B | 0 | 232 | 0 |
| C | 0 | 232 | 0 |
| D | 0 | 232 | 0 |
| Mode M9 | |||
|---|---|---|---|
| Quadrant | BADHDUFLAG | Total packets | Discarded packets |
| A | 0 | 29 | 0 |
| B | 0 | 30 | 0 |
| C | 0 | 30 | 0 |
| D | 0 | 30 | 0 |
| Mode M0 | |||
|---|---|---|---|
| Quadrant | BADHDUFLAG | Total packets | Discarded packets |
| A | 0 | 26895 | 3 |
| B | 0 | 24990 | 3 |
| C | 0 | 23740 | 3 |
| D | 0 | 52693 | 3 |
| Quadrant | Total seconds | Saturated seconds | Saturation percentage |
|---|---|---|---|
| A | 11356 | 489 | 4.306094% |
| B | 11356 | 98 | 0.862980% |
| C | 11356 | 88 | 0.774921% |
| D | 11356 | 2913 | 25.651638% |
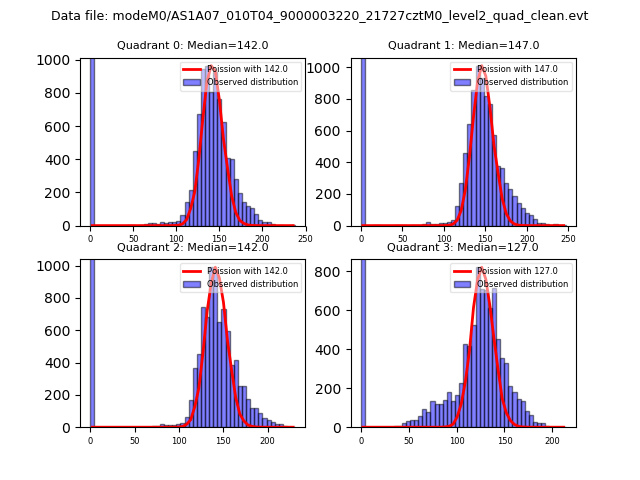
Noise dominated data is calculated using 1-second bins in cleaned event files. If a bin has >2000 counts, and if more than 50% of those come from <1% of pixels, then it is considered to be noise-dominated and hence unusable.
| Quadrant | # 1 sec bins | Bins with >0 counts | Bins with >2000 counts | High rate bins dominated by noise | Noise dominated (total time) | Noise dominated (detector-on time) | Marked lightcurve |
|---|---|---|---|---|---|---|---|
| A | 14061 | 11358 | 337 | 337 | 2.40% | 2.97% | 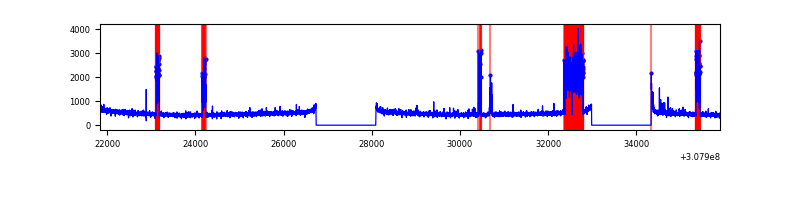 |
| B | 14061 | 11358 | 20 | 20 | 0.14% | 0.18% | 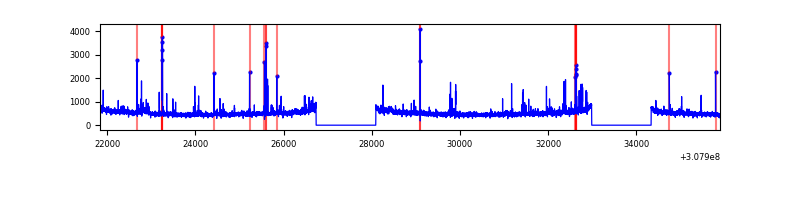 |
| C | 14061 | 11358 | 0 | 0 | 0.00% | 0.00% | 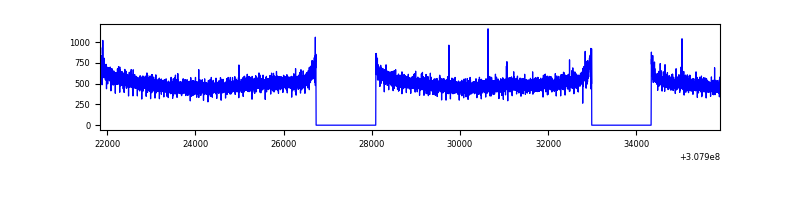 |
| D | 14061 | 11357 | 2875 | 2875 | 20.45% | 25.31% | 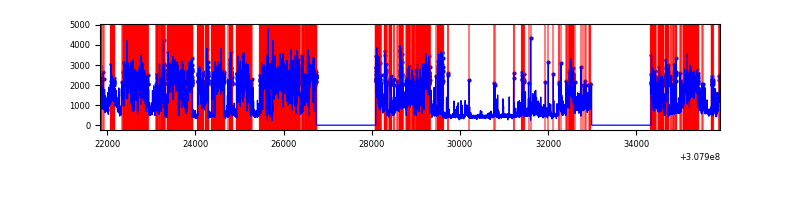 |
Top three noisy pixels from each quadrant. If the there are fewer than three noisy pixels in the level2.evt file, extra rows are filled as -1
| Pixel properties | Quadrant properties | ||||||
|---|---|---|---|---|---|---|---|
| Quadrant | DetID | PixID | Counts | Sigma | Mean | Median | Sigma |
| A | 15 | 236 | 1123539 | 4053.7 | 1395 | 1365 | 276.8 |
| A | 2 | 79 | 40208 | 140.31 | 1395 | 1365 | 276.8 |
| A | 6 | 16 | 34042 | 118.04 | 1395 | 1365 | 276.8 |
| B | 3 | 64 | 151309 | 573.25 | 1435 | 1401 | 261.5 |
| B | 0 | 197 | 55354 | 206.32 | 1435 | 1401 | 261.5 |
| B | 0 | 230 | 51623 | 192.05 | 1435 | 1401 | 261.5 |
| C | 14 | 238 | 224329 | 688.77 | 1405 | 1420 | 323.6 |
| C | 13 | 61 | 9627 | 25.36 | 1405 | 1420 | 323.6 |
| C | 8 | 208 | 4517 | 9.57 | 1405 | 1420 | 323.6 |
| D | 12 | 235 | 8646177 | 28205.97 | 1277 | 1242 | 306.5 |
| D | 7 | 223 | 1064545 | 3469.26 | 1277 | 1242 | 306.5 |
| D | 2 | 136 | 218557 | 709.04 | 1277 | 1242 | 306.5 |
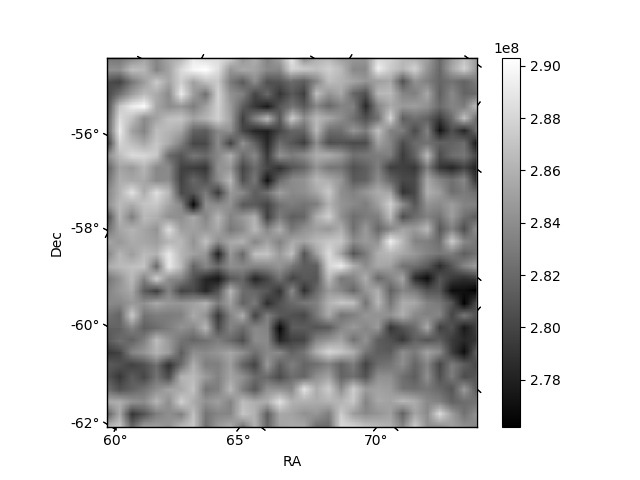
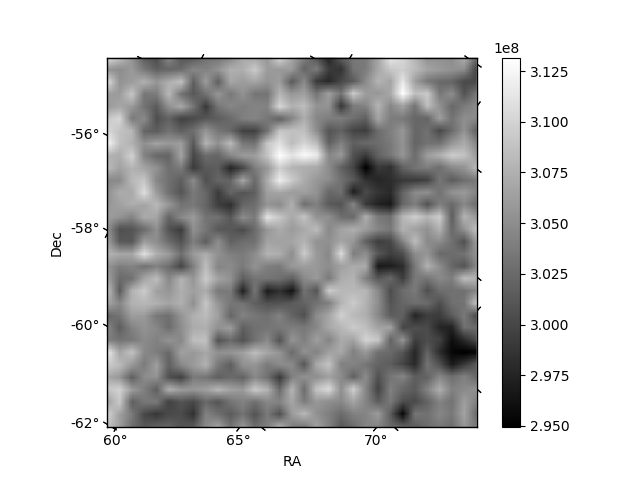
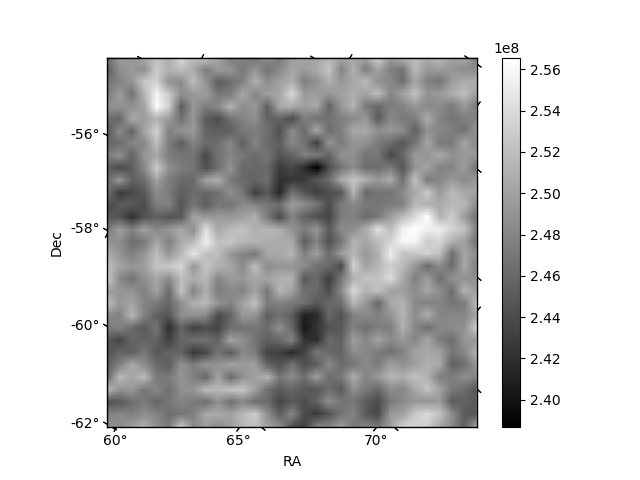
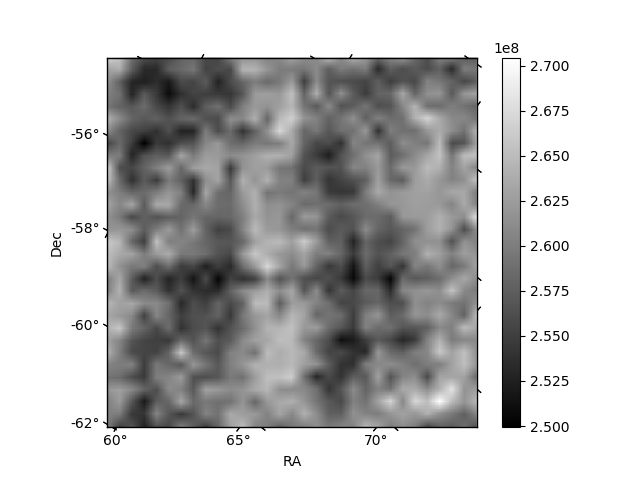
Histogram calculated using DETX and DETY for each event in the final _common_clean file
| Quadrant A | 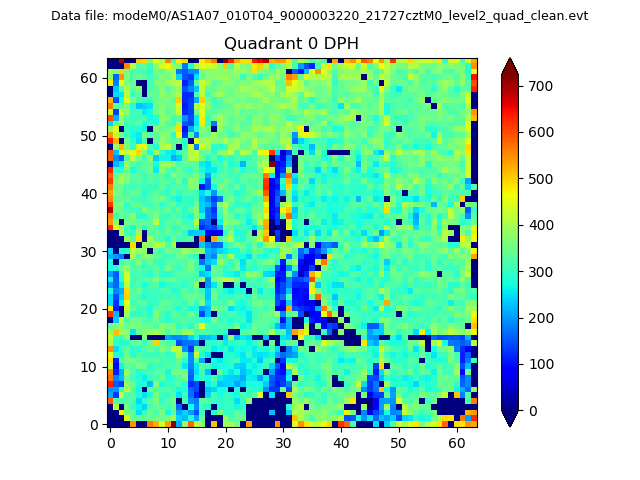 |
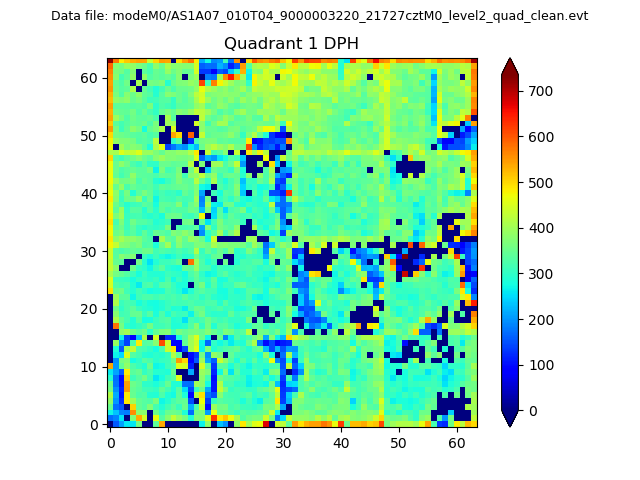 |
Quadrant B |
|---|---|---|---|
| Quadrant D | 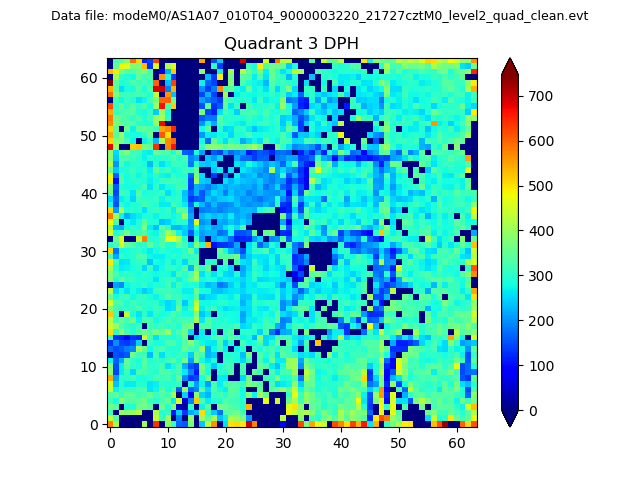 |
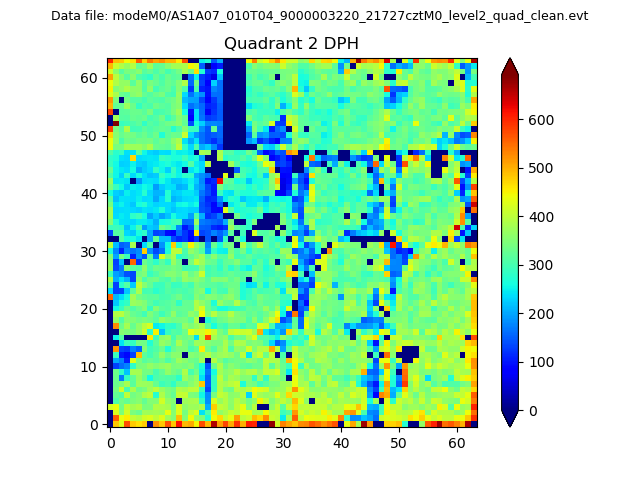 |
Quadrant C |
| Plot type | Count rate plots | Images |
|---|---|---|
| Comparison with Poisson distribution Blue bars denote a histogram of data divided into 1 sec bins. Red curve is a Poisson curve with rate = median count rate of data. |
 |
 |
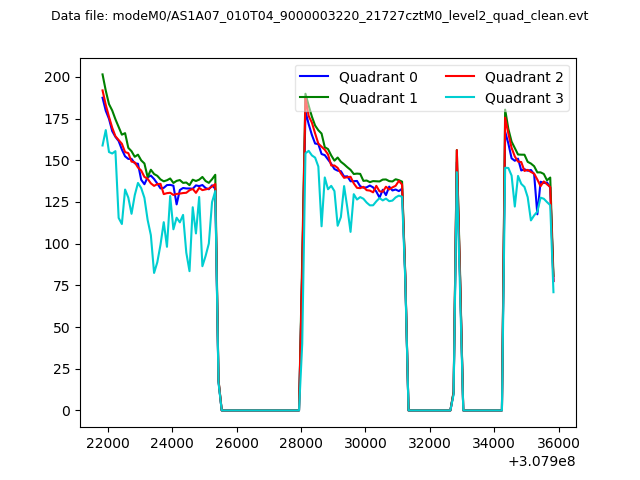
| Quadrant-wise count rates Data is divided into 100 sec bins |
 |
|
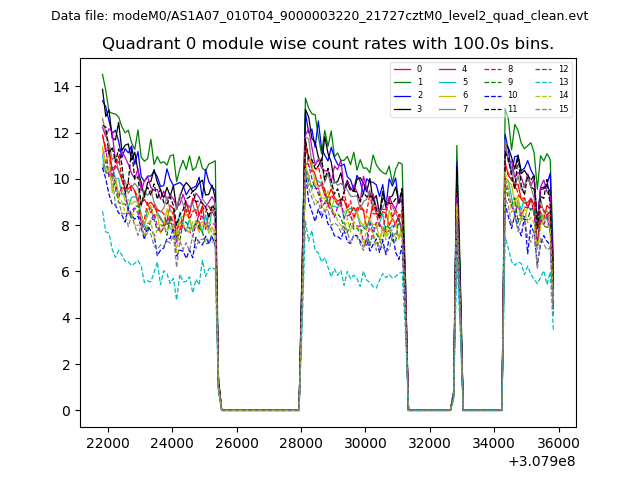
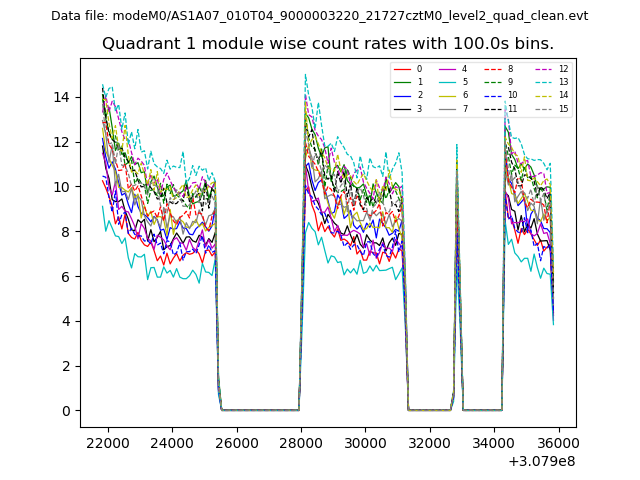
| Module-wise count rates for Quadrant A Data is divided into 100 sec bins |
 |
 |
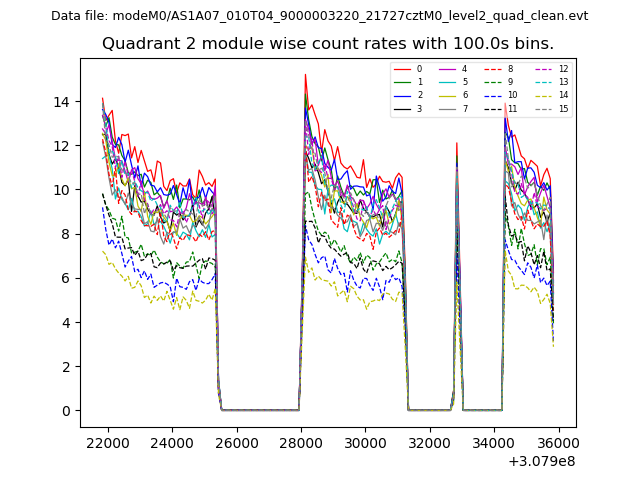
| Module-wise count rates for Quadrant B Data is divided into 100 sec bins |
 |
 |
| Module-wise count rates for Quadrant C Data is divided into 100 sec bins |
 |
 |
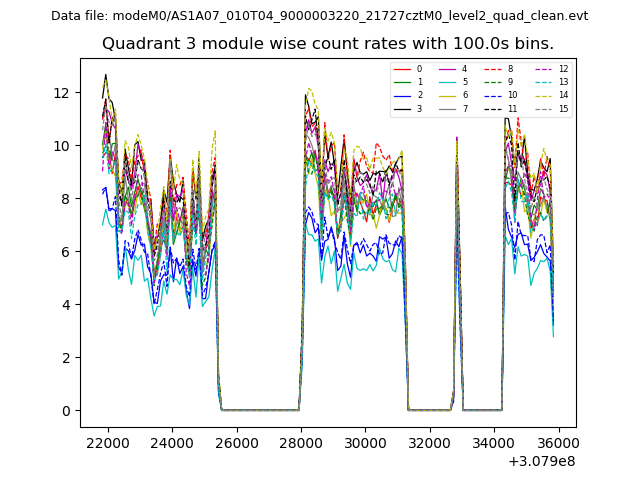
| Module-wise count rates for Quadrant D Data is divided into 100 sec bins |
 |
 |
| Parameter | Plot |
|---|---|
| CZT HV Monitor | 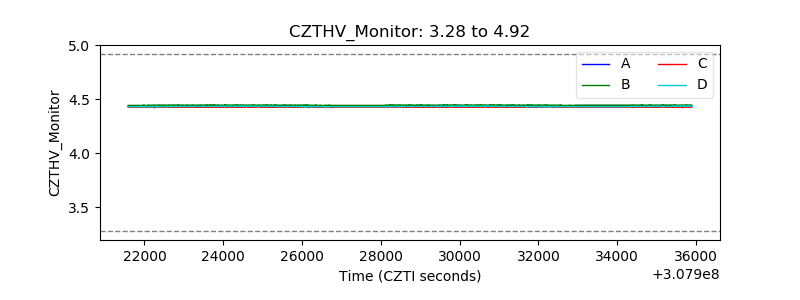 |
| D_VDD | 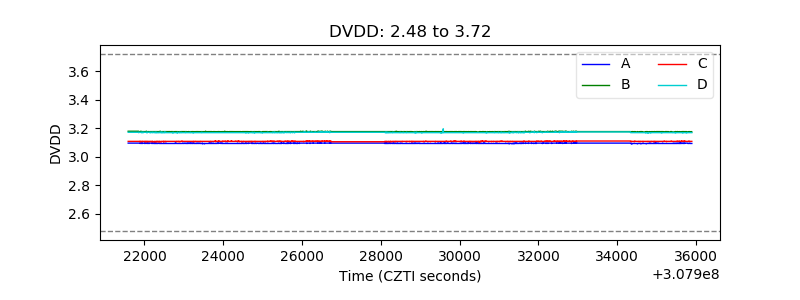 |
| Temperature 1 | 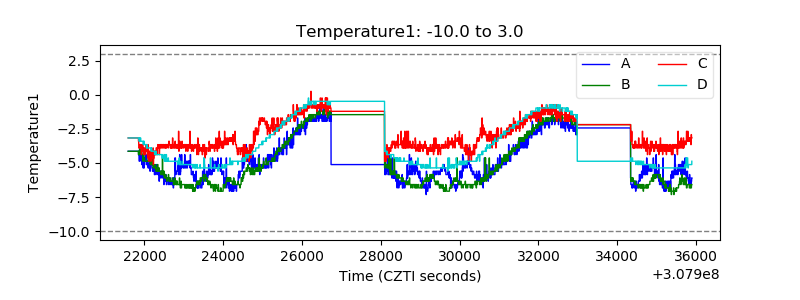 |
| Veto HV Monitor | 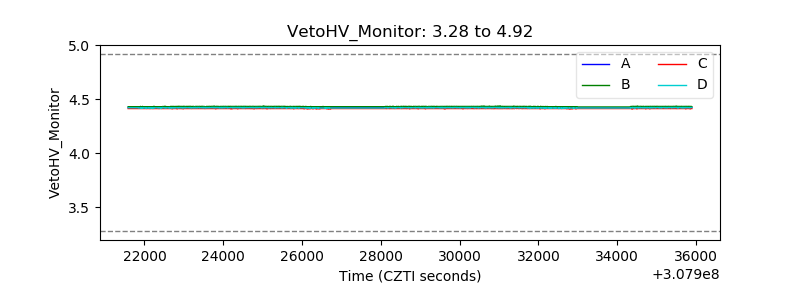 |
| Veto LLD | 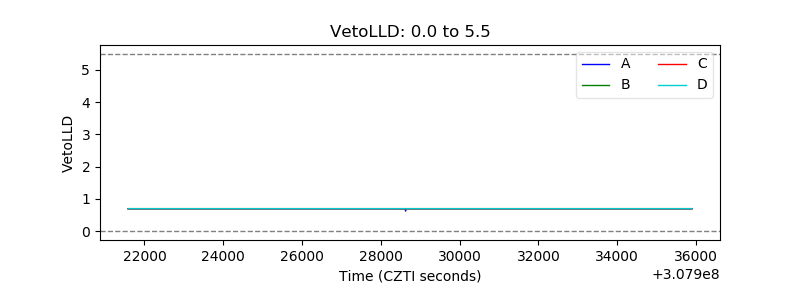 |
| Alpha Counter | 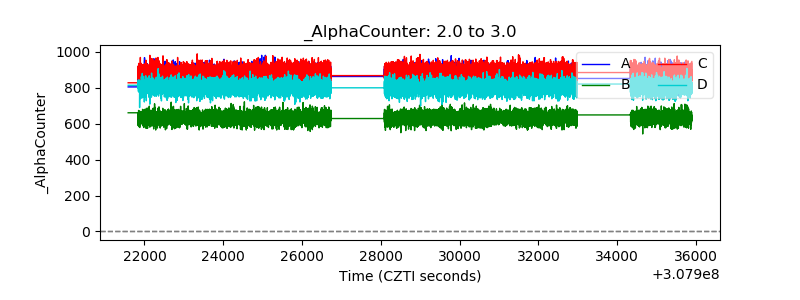 |
| _CPM_Rate | 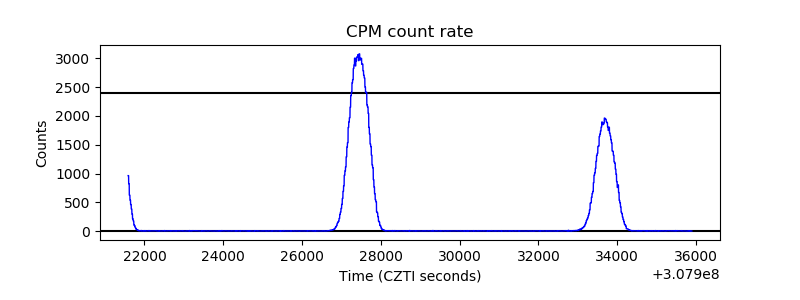 |
| CZT Counter | 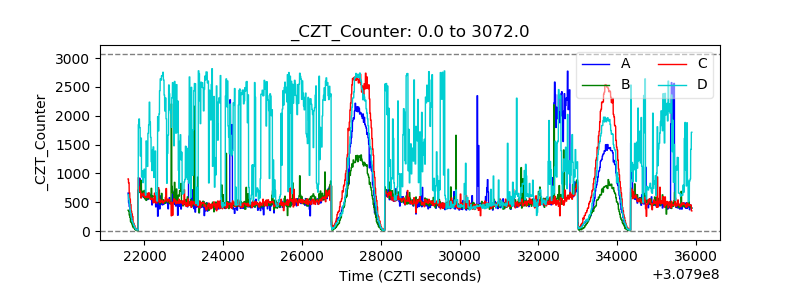 |
| +2.5 Volts monitor |  |
| +5 Volts monitor |  |
| _ROLL_ROT | 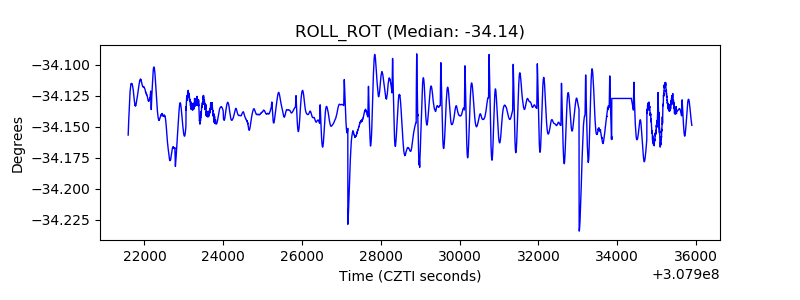 |
| _Roll_DEC | 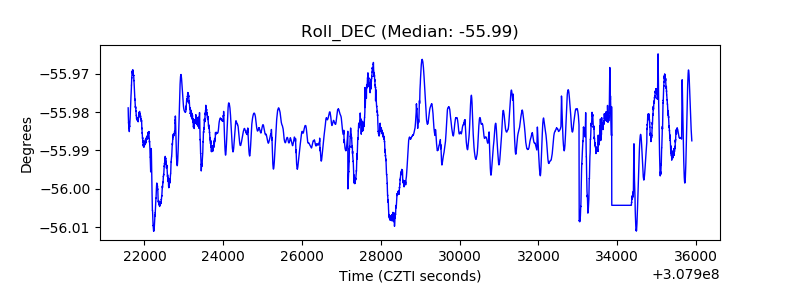 |
| _Roll_RA | 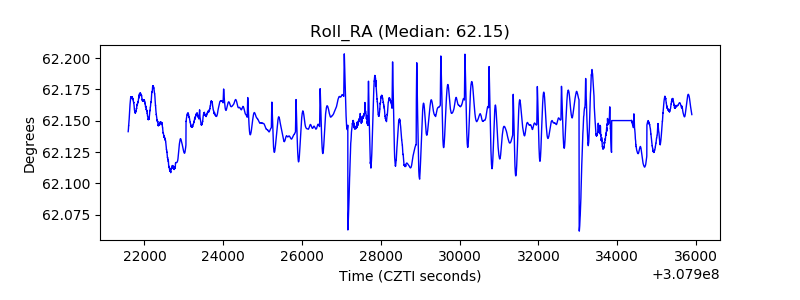 |
| Veto Counter | 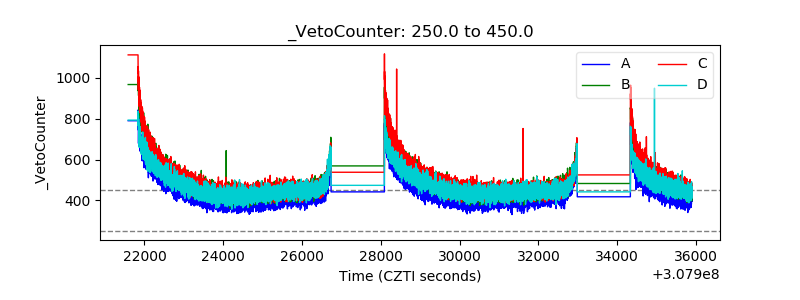 |