| Param | Original file | Final file |
|---|---|---|
| Filename | modeM0/AS1A07_010T04_9000003220_21728cztM0_level2.evt | modeM0/AS1A07_010T04_9000003220_21728cztM0_level2_quad_clean.evt |
| Size (bytes) | 612,383,040 | 104,938,560 |
| Size | 584.0 MB | 100.1 MB |
| Events in quadrant A | 3,405,794 | 688,855 |
| Events in quadrant B | 3,371,961 | 717,854 |
| Events in quadrant C | 3,231,032 | 694,045 |
| Events in quadrant D | 8,092,125 | 618,547 |
| Mode SS | |||
|---|---|---|---|
| Quadrant | BADHDUFLAG | Total packets | Discarded packets |
| A | 0 | 134 | 0 |
| B | 0 | 134 | 0 |
| C | 0 | 134 | 0 |
| D | 0 | 134 | 0 |
| Mode M9 | |||
|---|---|---|---|
| Quadrant | BADHDUFLAG | Total packets | Discarded packets |
| A | 0 | 16 | 0 |
| B | 0 | 17 | 0 |
| C | 0 | 17 | 0 |
| D | 0 | 17 | 0 |
| Mode M0 | |||
|---|---|---|---|
| Quadrant | BADHDUFLAG | Total packets | Discarded packets |
| A | 0 | 14417 | 2 |
| B | 0 | 14180 | 2 |
| C | 0 | 13574 | 2 |
| D | 0 | 28536 | 2 |
| Quadrant | Total seconds | Saturated seconds | Saturation percentage |
|---|---|---|---|
| A | 6573 | 76 | 1.156245% |
| B | 6573 | 55 | 0.836756% |
| C | 6573 | 64 | 0.973680% |
| D | 6573 | 1298 | 19.747452% |
Noise dominated data is calculated using 1-second bins in cleaned event files. If a bin has >2000 counts, and if more than 50% of those come from <1% of pixels, then it is considered to be noise-dominated and hence unusable.
| Quadrant | # 1 sec bins | Bins with >0 counts | Bins with >2000 counts | High rate bins dominated by noise | Noise dominated (total time) | Noise dominated (detector-on time) | Marked lightcurve |
|---|---|---|---|---|---|---|---|
| A | 7738 | 6574 | 48 | 48 | 0.62% | 0.73% | 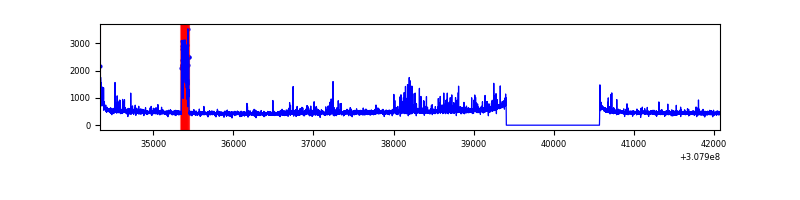 |
| B | 7738 | 6574 | 15 | 15 | 0.19% | 0.23% | 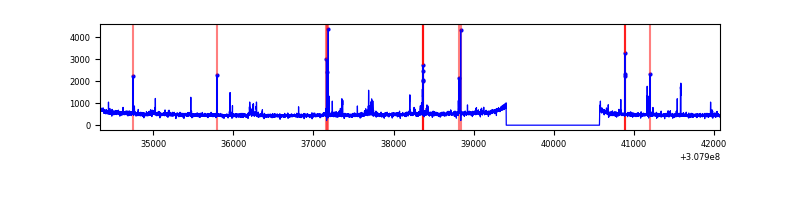 |
| C | 7738 | 6574 | 0 | 0 | 0.00% | 0.00% |  |
| D | 7738 | 6574 | 1278 | 1278 | 16.52% | 19.44% | 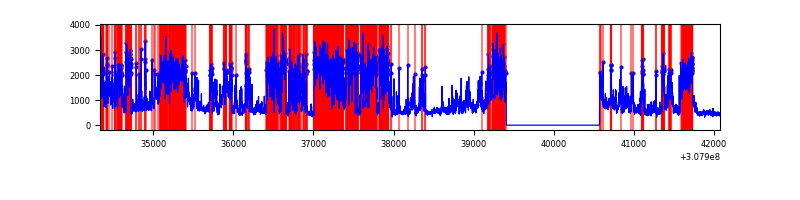 |
Top three noisy pixels from each quadrant. If the there are fewer than three noisy pixels in the level2.evt file, extra rows are filled as -1
| Pixel properties | Quadrant properties | ||||||
|---|---|---|---|---|---|---|---|
| Quadrant | DetID | PixID | Counts | Sigma | Mean | Median | Sigma |
| A | 15 | 236 | 153375 | 952.69 | 798 | 780 | 160.2 |
| A | 6 | 16 | 113152 | 701.57 | 798 | 780 | 160.2 |
| A | 2 | 79 | 66501 | 410.31 | 798 | 780 | 160.2 |
| B | 3 | 64 | 140559 | 935.99 | 807 | 787 | 149.3 |
| B | 0 | 230 | 34639 | 226.69 | 807 | 787 | 149.3 |
| B | 0 | 189 | 19077 | 122.48 | 807 | 787 | 149.3 |
| C | 14 | 238 | 124808 | 669.72 | 796 | 801 | 185.2 |
| C | 13 | 61 | 5611 | 25.98 | 796 | 801 | 185.2 |
| C | 3 | 202 | 2051 | 6.75 | 796 | 801 | 185.2 |
| D | 12 | 235 | 4454361 | 24610.19 | 747 | 727 | 181.0 |
| D | 7 | 223 | 579516 | 3198.31 | 747 | 727 | 181.0 |
| D | 14 | 35 | 110804 | 608.27 | 747 | 727 | 181.0 |
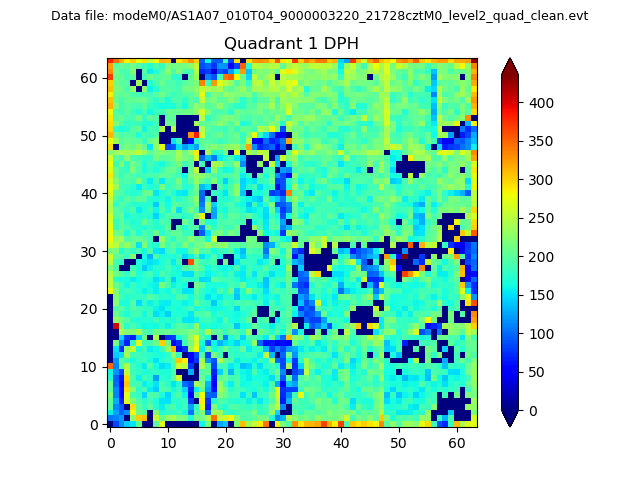
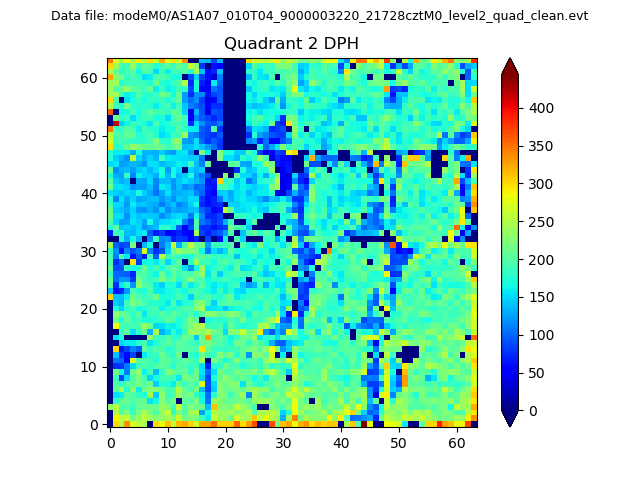
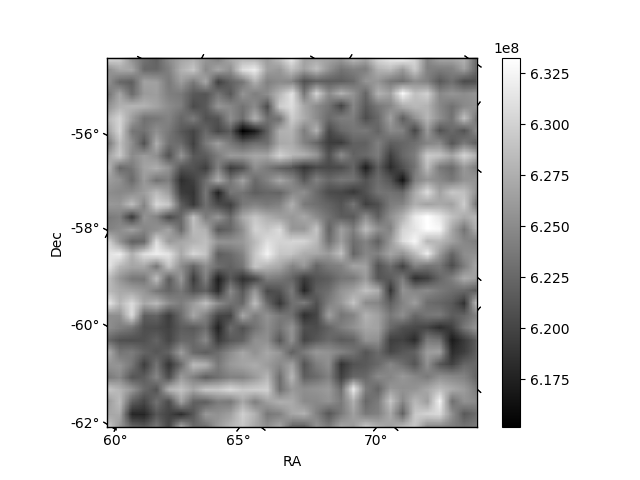
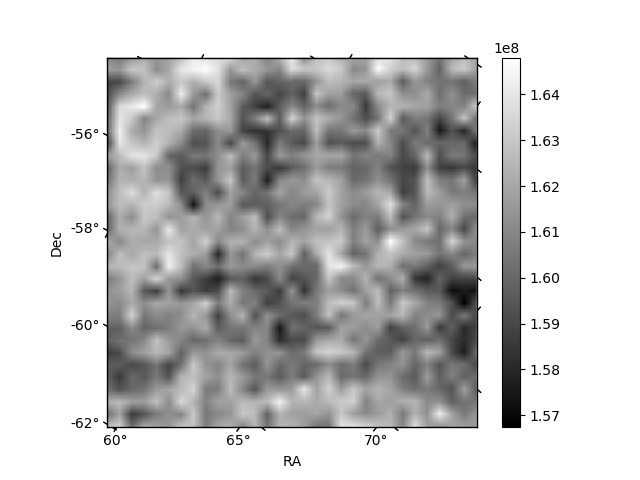
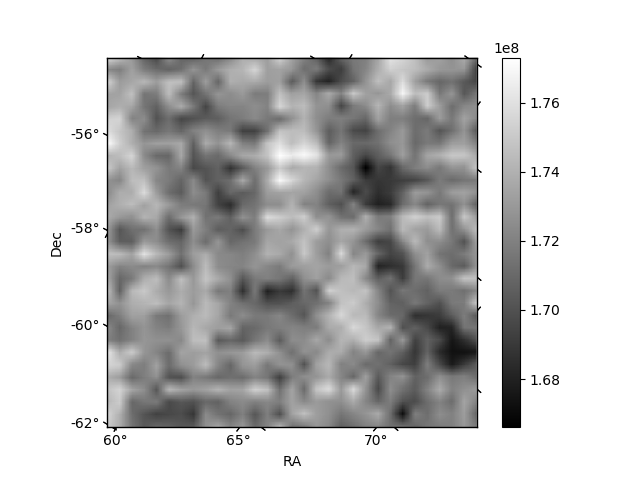
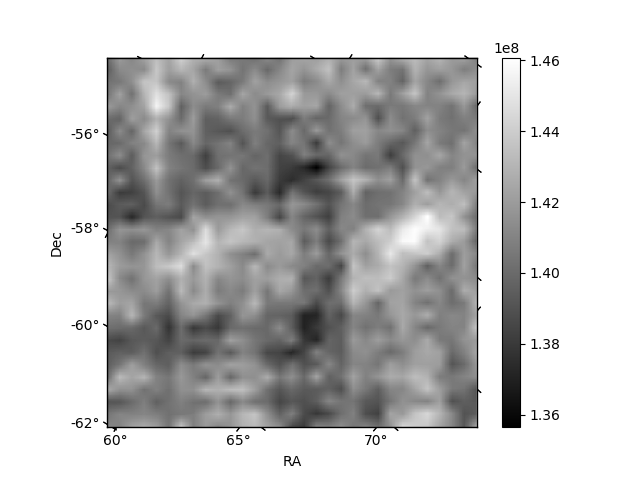
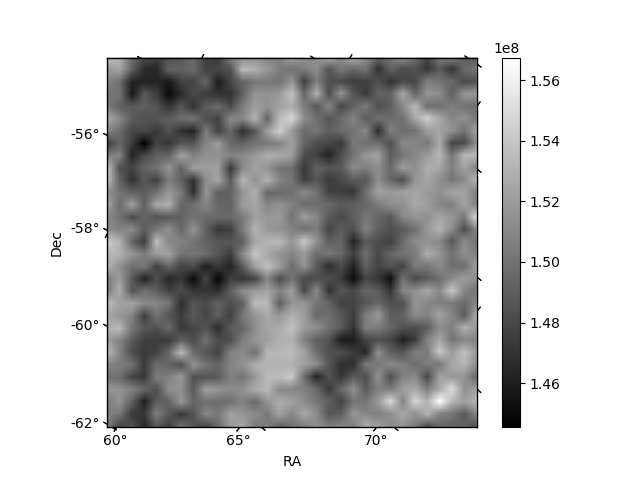
Histogram calculated using DETX and DETY for each event in the final _common_clean file
| Quadrant A | 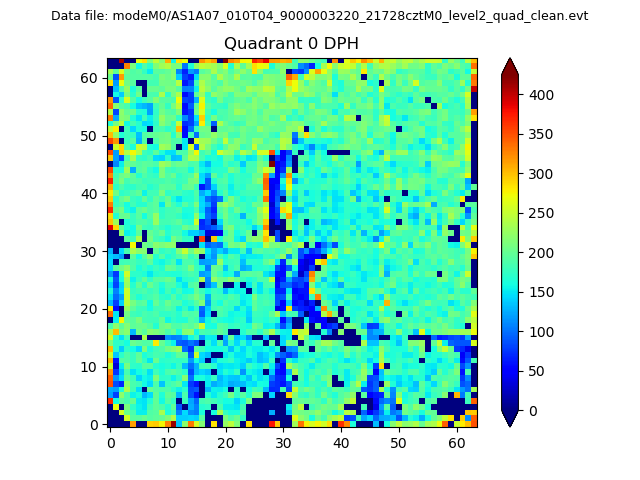 |
 |
Quadrant B |
|---|---|---|---|
| Quadrant D | 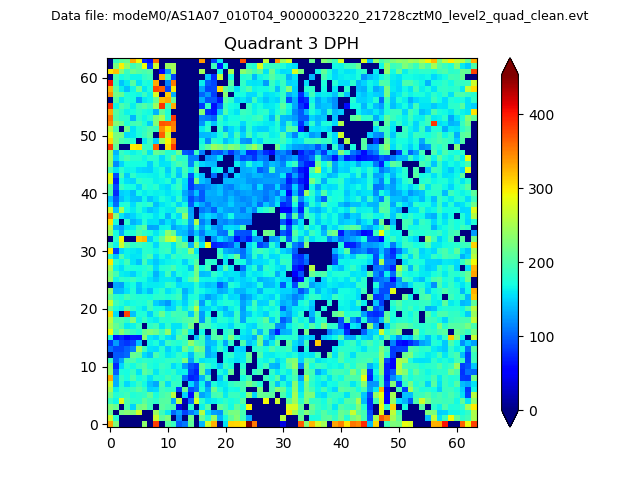 |
 |
Quadrant C |
| Plot type | Count rate plots | Images |
|---|---|---|
| Comparison with Poisson distribution Blue bars denote a histogram of data divided into 1 sec bins. Red curve is a Poisson curve with rate = median count rate of data. |
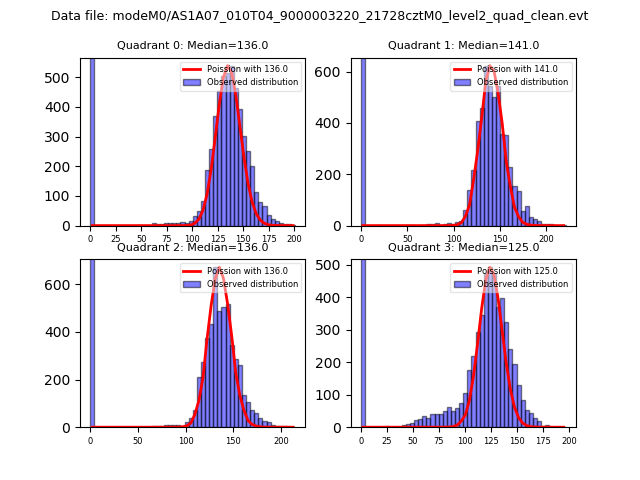 |
 |
| Quadrant-wise count rates Data is divided into 100 sec bins |
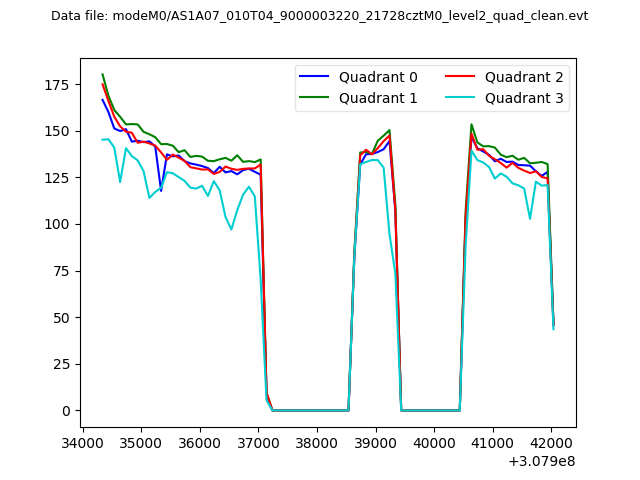 |
|
| Module-wise count rates for Quadrant A Data is divided into 100 sec bins |
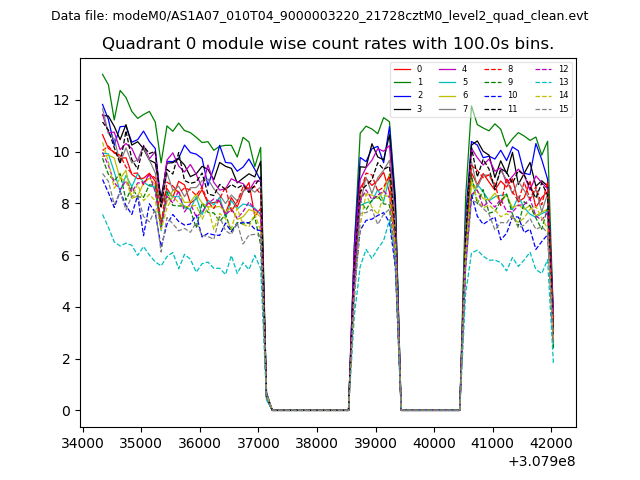 |
 |
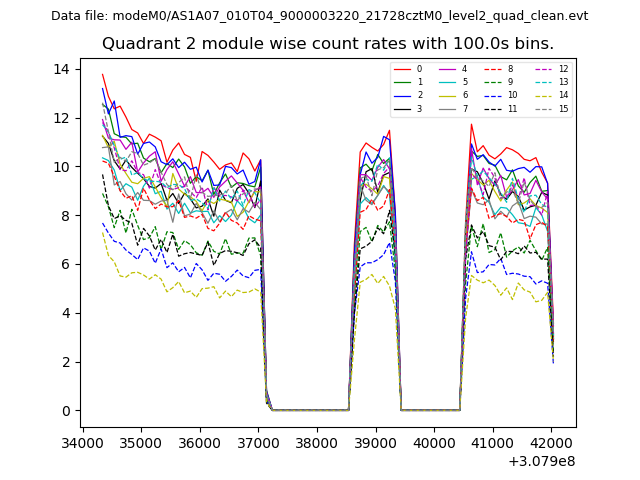
| Module-wise count rates for Quadrant B Data is divided into 100 sec bins |
 |
 |
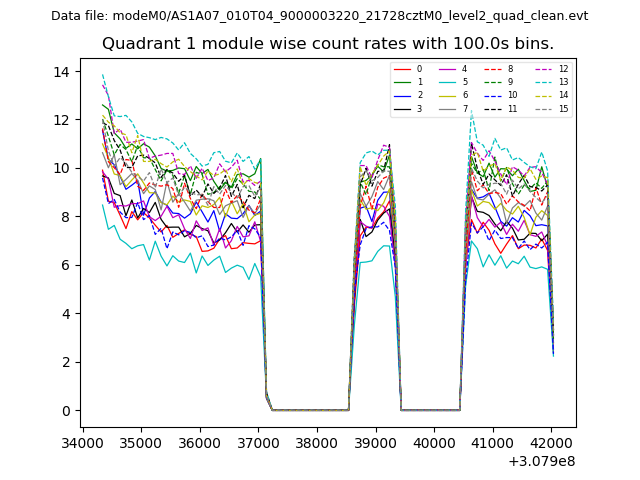
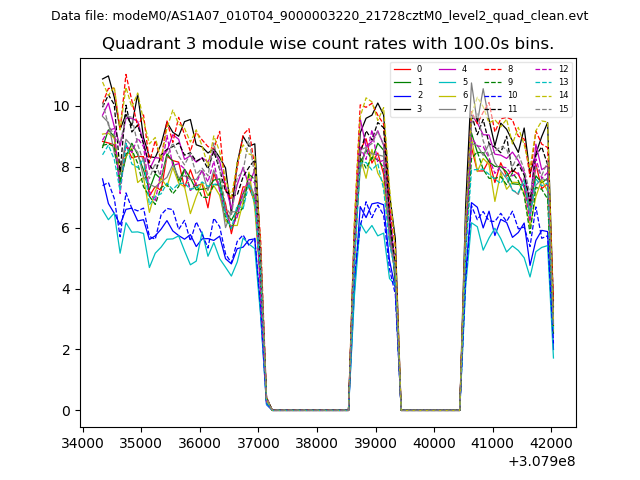
| Module-wise count rates for Quadrant C Data is divided into 100 sec bins |
 |
 |
| Module-wise count rates for Quadrant D Data is divided into 100 sec bins |
 |
 |
| Parameter | Plot |
|---|---|
| CZT HV Monitor | 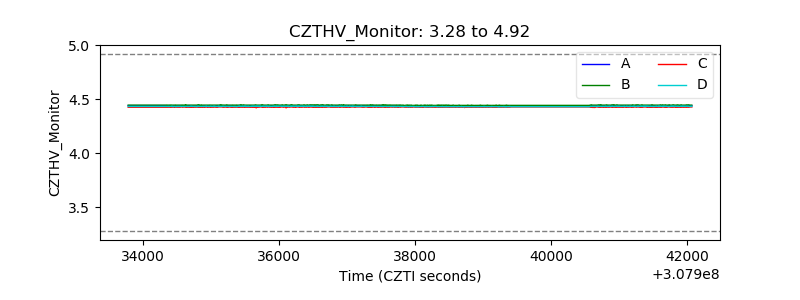 |
| D_VDD | 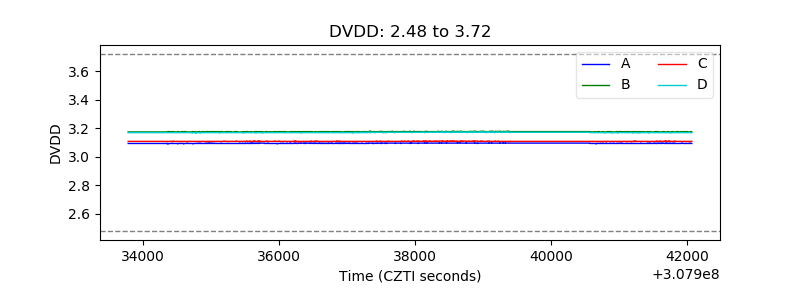 |
| Temperature 1 | 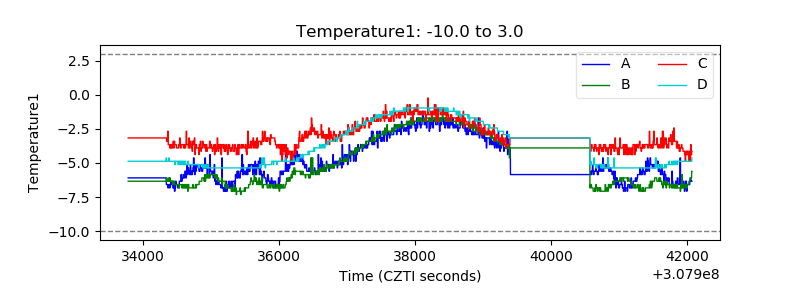 |
| Veto HV Monitor | 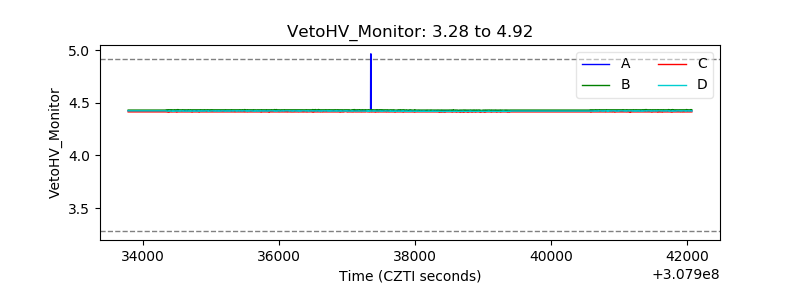 |
| Veto LLD | 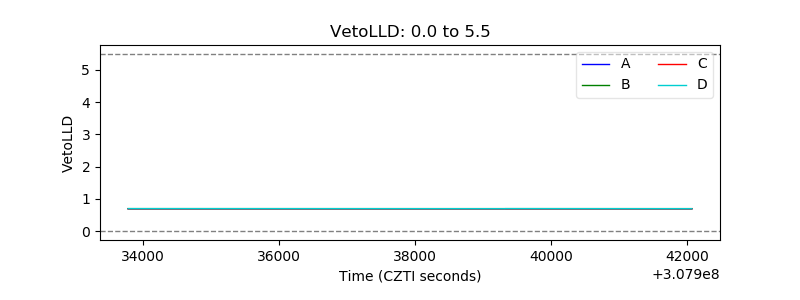 |
| Alpha Counter | 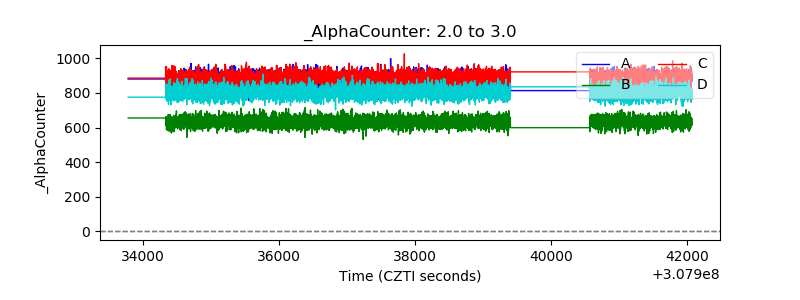 |
| _CPM_Rate | 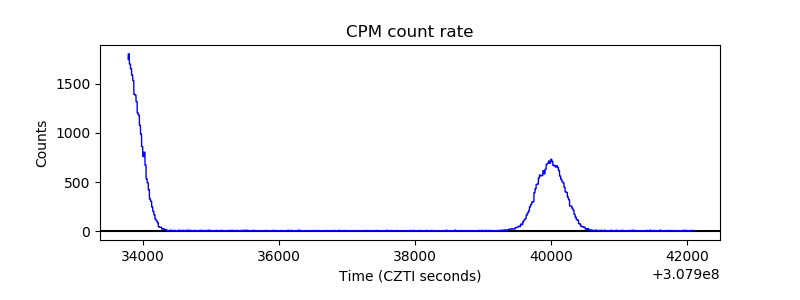 |
| CZT Counter | 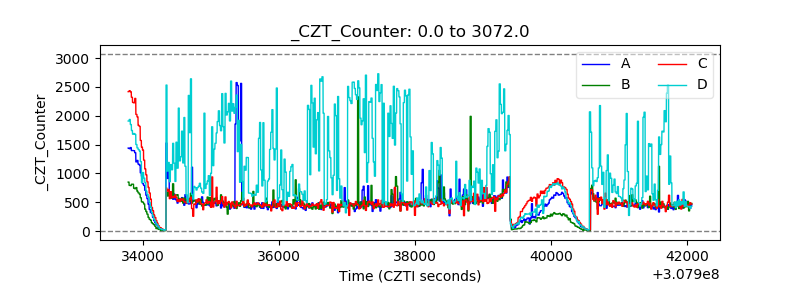 |
| +2.5 Volts monitor |  |
| +5 Volts monitor |  |
| _ROLL_ROT | 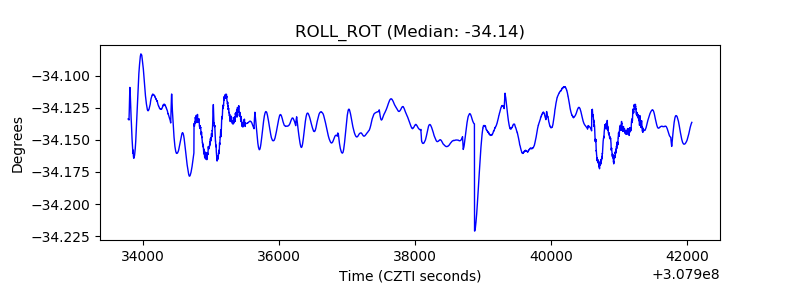 |
| _Roll_DEC | 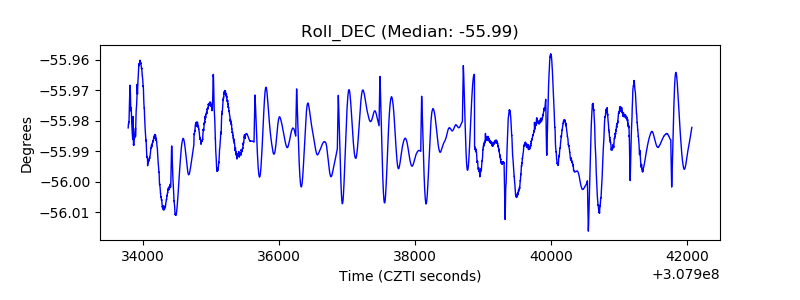 |
| _Roll_RA | 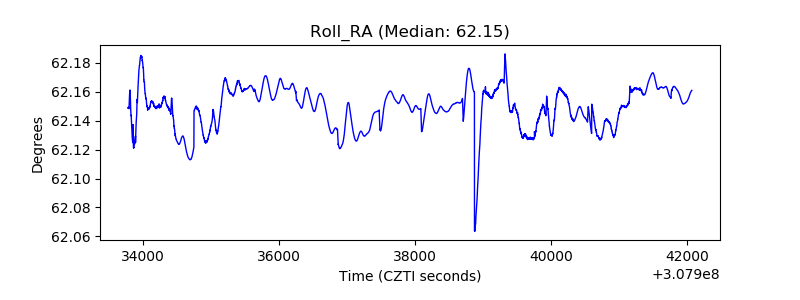 |
| Veto Counter | 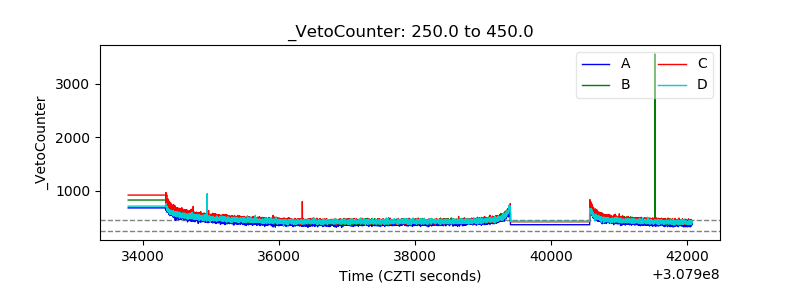 |