| Param | Original file | Final file |
|---|---|---|
| Filename | modeM0/AS1A07_010T04_9000003220_21730cztM0_level2.evt | modeM0/AS1A07_010T04_9000003220_21730cztM0_level2_quad_clean.evt |
| Size (bytes) | 606,608,640 | 103,343,040 |
| Size | 578.5 MB | 98.6 MB |
| Events in quadrant A | 7,235,644 | 602,720 |
| Events in quadrant B | 3,407,581 | 702,942 |
| Events in quadrant C | 3,366,865 | 678,847 |
| Events in quadrant D | 3,885,699 | 656,495 |
| Mode SS | |||
|---|---|---|---|
| Quadrant | BADHDUFLAG | Total packets | Discarded packets |
| A | 0 | 142 | 0 |
| B | 0 | 142 | 0 |
| C | 0 | 142 | 0 |
| D | 0 | 142 | 0 |
| Mode M9 | |||
|---|---|---|---|
| Quadrant | BADHDUFLAG | Total packets | Discarded packets |
| A | 0 | 4 | 0 |
| B | 0 | 4 | 0 |
| C | 0 | 4 | 0 |
| D | 0 | 4 | 0 |
| Mode M0 | |||
|---|---|---|---|
| Quadrant | BADHDUFLAG | Total packets | Discarded packets |
| A | 0 | 26284 | 1 |
| B | 0 | 14730 | 1 |
| C | 0 | 14595 | 1 |
| D | 0 | 16226 | 1 |
| Quadrant | Total seconds | Saturated seconds | Saturation percentage |
|---|---|---|---|
| A | 7003 | 1829 | 26.117378% |
| B | 7004 | 140 | 1.998858% |
| C | 7004 | 157 | 2.241576% |
| D | 7003 | 188 | 2.684564% |
Noise dominated data is calculated using 1-second bins in cleaned event files. If a bin has >2000 counts, and if more than 50% of those come from <1% of pixels, then it is considered to be noise-dominated and hence unusable.
| Quadrant | # 1 sec bins | Bins with >0 counts | Bins with >2000 counts | High rate bins dominated by noise | Noise dominated (total time) | Noise dominated (detector-on time) | Marked lightcurve |
|---|---|---|---|---|---|---|---|
| A | 7428 | 7004 | 1547 | 1547 | 20.83% | 22.09% | 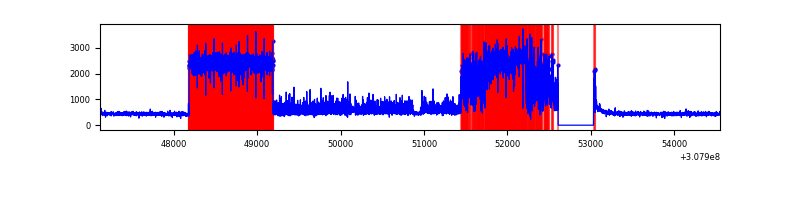 |
| B | 7429 | 7005 | 14 | 14 | 0.19% | 0.20% | 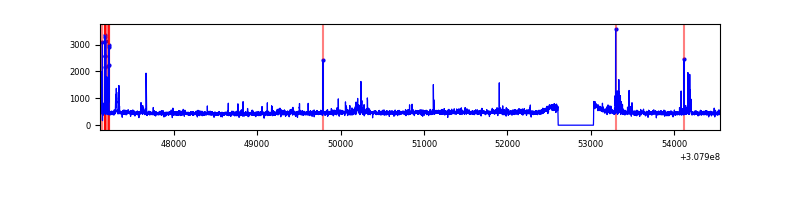 |
| C | 7429 | 7005 | 0 | 0 | 0.00% | 0.00% | 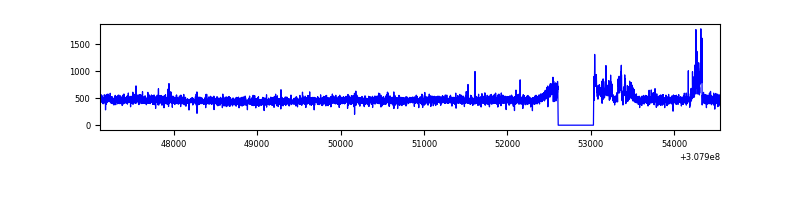 |
| D | 7428 | 7004 | 98 | 98 | 1.32% | 1.40% | 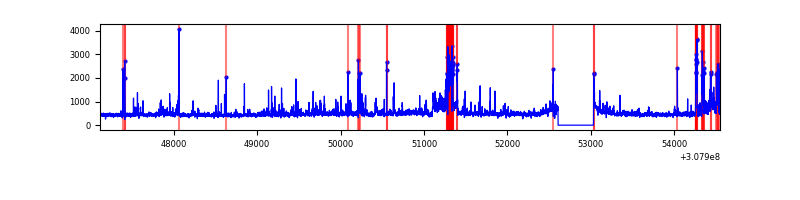 |
Top three noisy pixels from each quadrant. If the there are fewer than three noisy pixels in the level2.evt file, extra rows are filled as -1
| Pixel properties | Quadrant properties | ||||||
|---|---|---|---|---|---|---|---|
| Quadrant | DetID | PixID | Counts | Sigma | Mean | Median | Sigma |
| A | 15 | 236 | 4404929 | 29757.45 | 733 | 715 | 148.0 |
| A | 13 | 254 | 9002 | 55.99 | 733 | 715 | 148.0 |
| A | 3 | 137 | 6267 | 37.51 | 733 | 715 | 148.0 |
| B | 3 | 64 | 130625 | 832.86 | 819 | 797 | 155.9 |
| B | 0 | 230 | 23085 | 142.98 | 819 | 797 | 155.9 |
| B | 0 | 189 | 20586 | 126.95 | 819 | 797 | 155.9 |
| C | 14 | 238 | 127689 | 675.92 | 799 | 804 | 187.7 |
| C | 8 | 208 | 119011 | 629.69 | 799 | 804 | 187.7 |
| C | 10 | 22 | 5663 | 25.88 | 799 | 804 | 187.7 |
| D | 14 | 35 | 316128 | 1618.27 | 803 | 778 | 194.9 |
| D | 7 | 223 | 245156 | 1254.07 | 803 | 778 | 194.9 |
| D | 12 | 235 | 160958 | 821.99 | 803 | 778 | 194.9 |
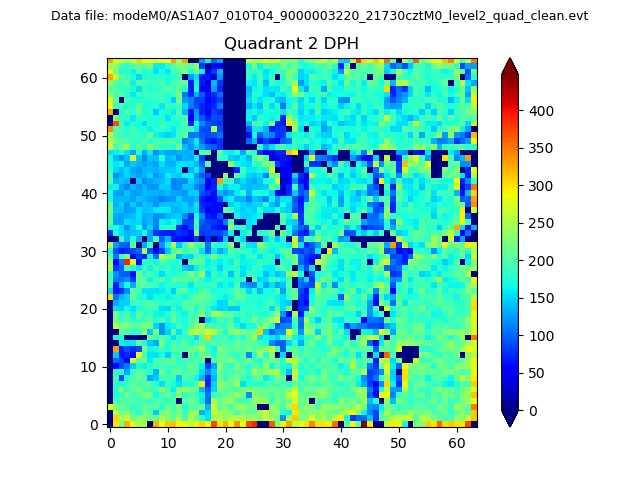
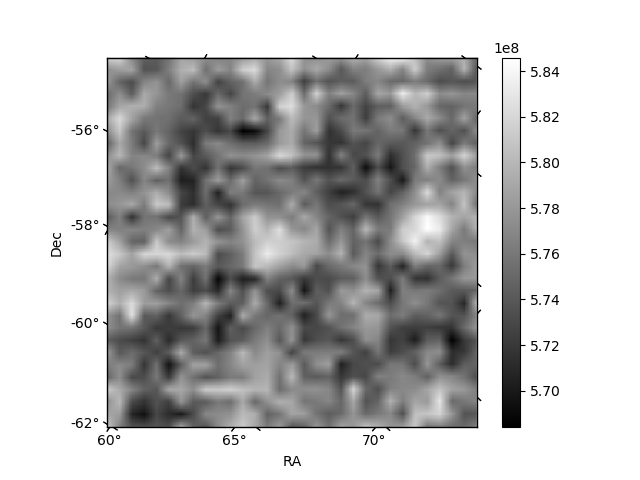
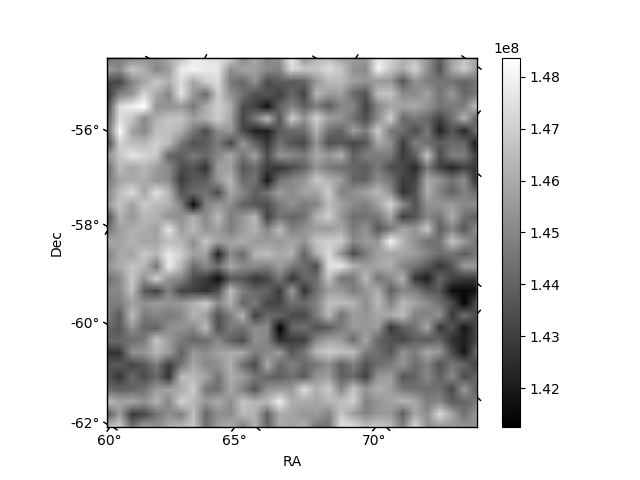
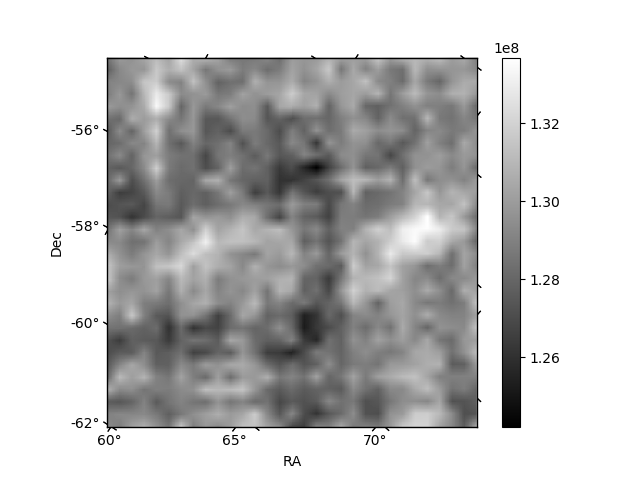
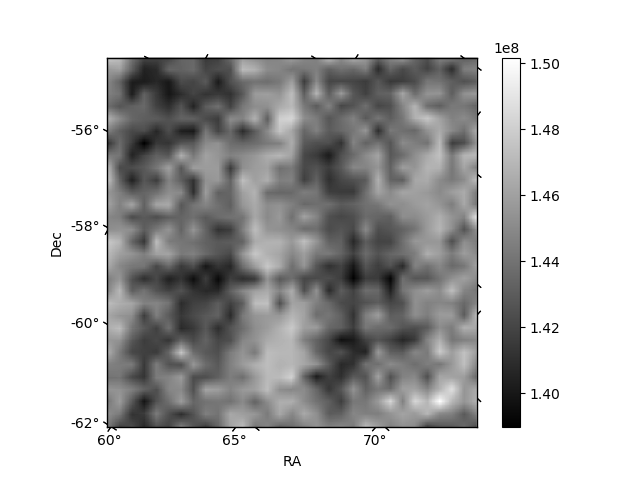
Histogram calculated using DETX and DETY for each event in the final _common_clean file
| Quadrant A | 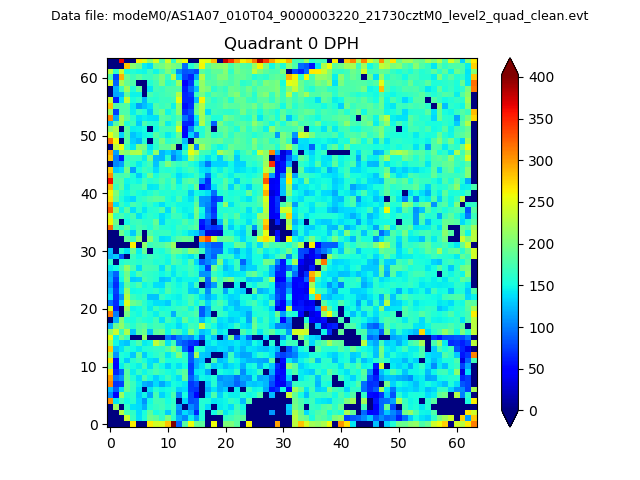 |
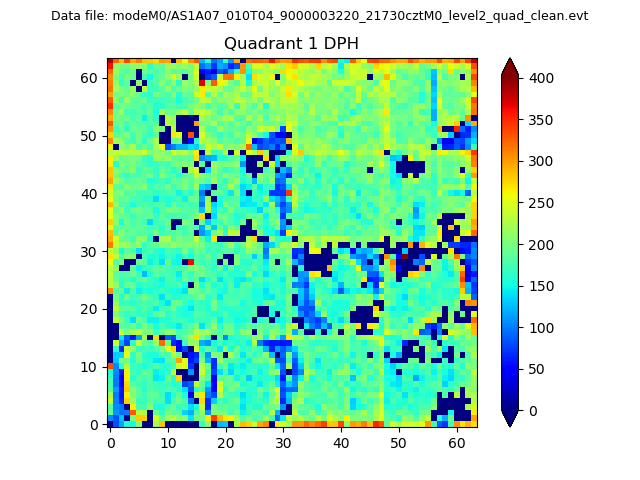 |
Quadrant B |
|---|---|---|---|
| Quadrant D | 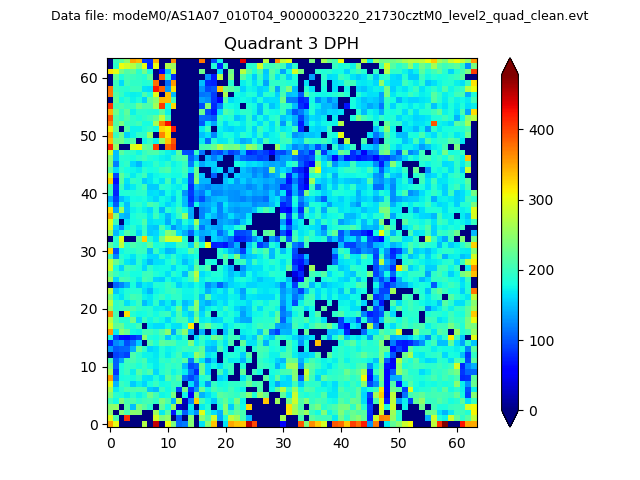 |
 |
Quadrant C |
| Plot type | Count rate plots | Images |
|---|---|---|
| Comparison with Poisson distribution Blue bars denote a histogram of data divided into 1 sec bins. Red curve is a Poisson curve with rate = median count rate of data. |
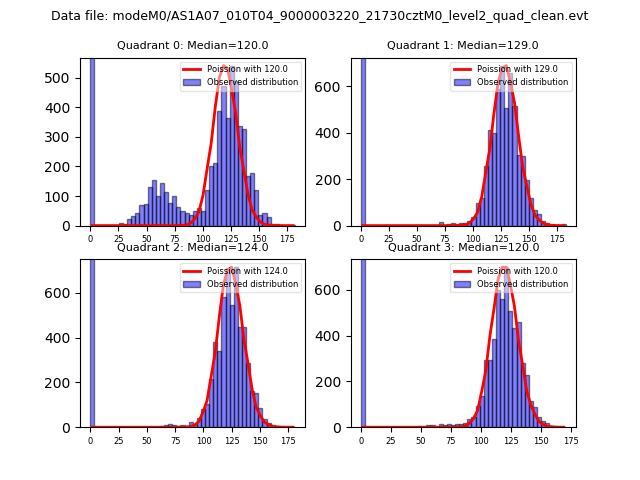 |
 |
| Quadrant-wise count rates Data is divided into 100 sec bins |
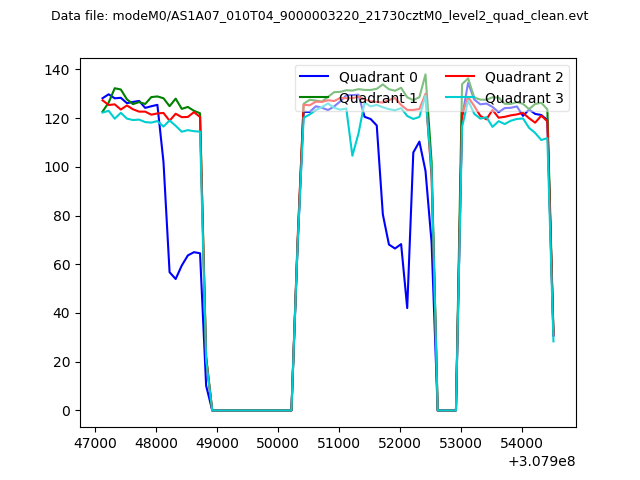 |
|
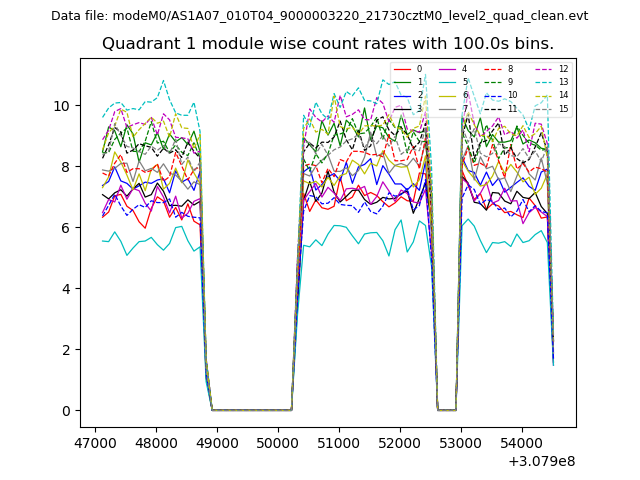
| Module-wise count rates for Quadrant A Data is divided into 100 sec bins |
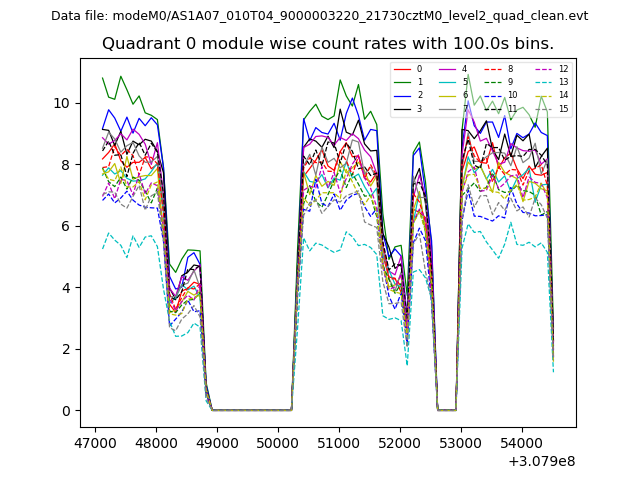 |
 |
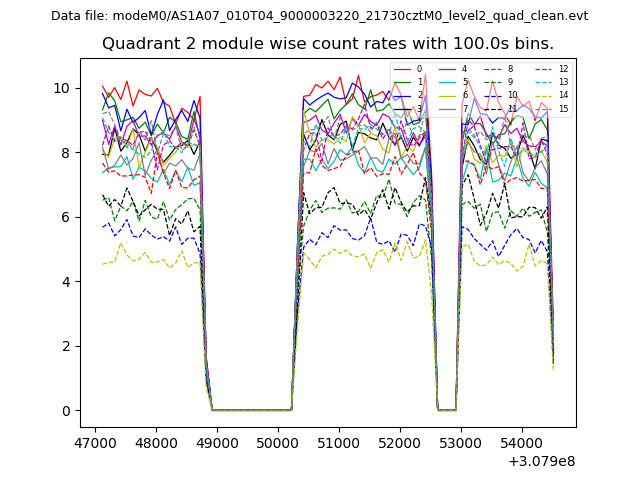
| Module-wise count rates for Quadrant B Data is divided into 100 sec bins |
 |
 |
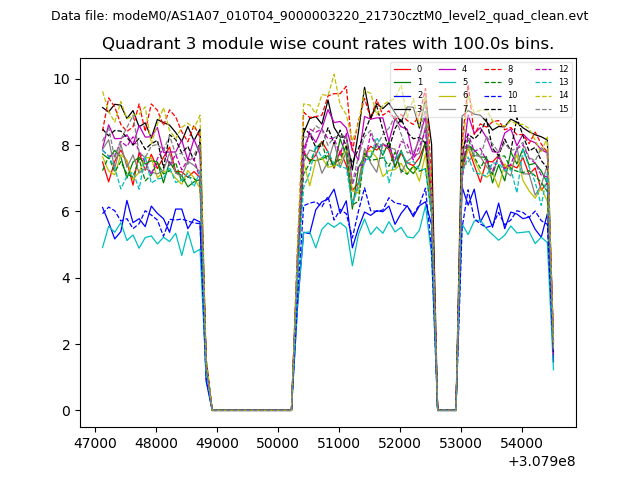
| Module-wise count rates for Quadrant C Data is divided into 100 sec bins |
 |
 |
| Module-wise count rates for Quadrant D Data is divided into 100 sec bins |
 |
 |
| Parameter | Plot |
|---|---|
| CZT HV Monitor | 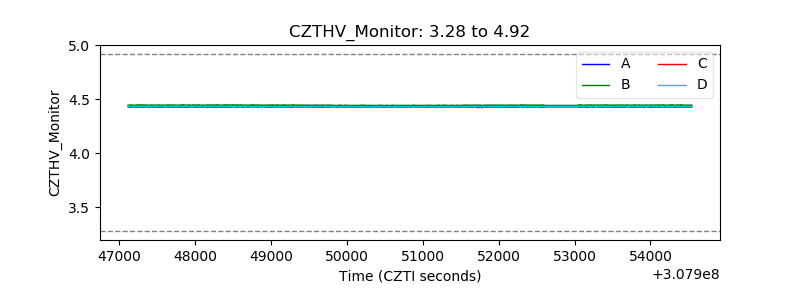 |
| D_VDD |  |
| Temperature 1 | 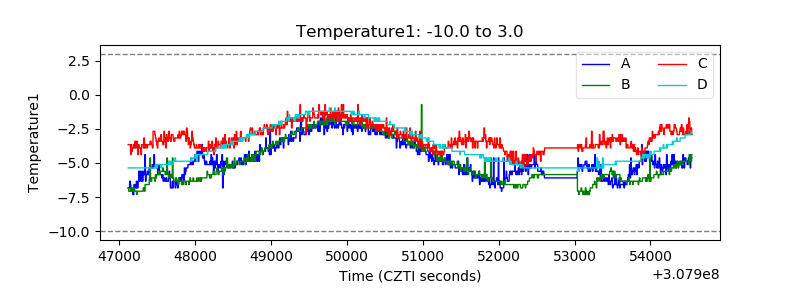 |
| Veto HV Monitor | 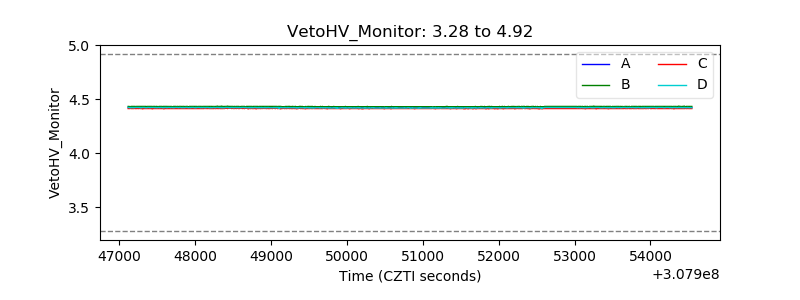 |
| Veto LLD | 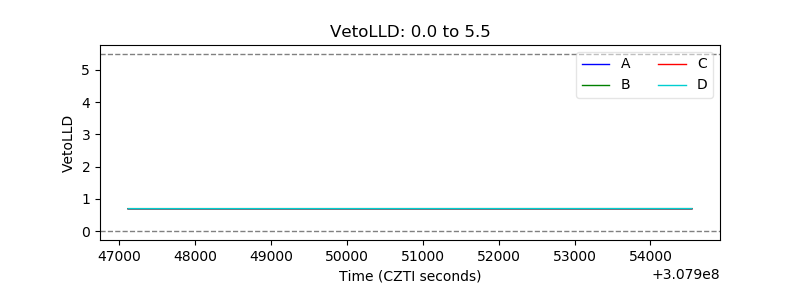 |
| Alpha Counter | 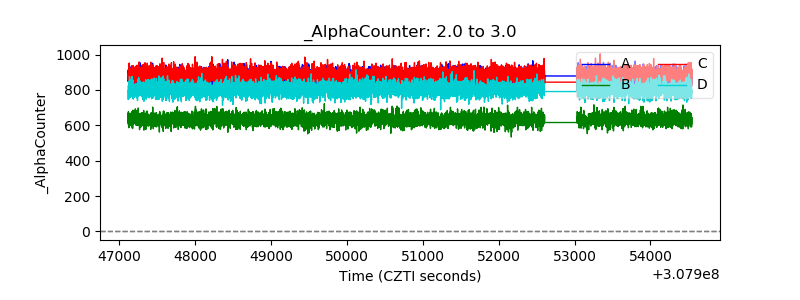 |
| _CPM_Rate | 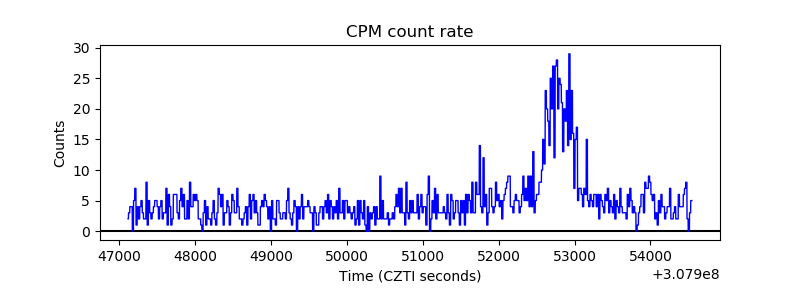 |
| CZT Counter | 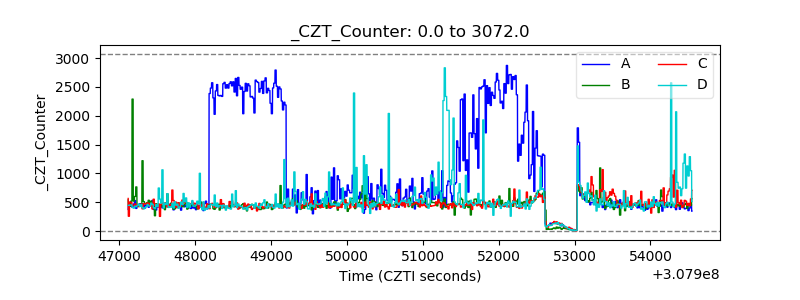 |
| +2.5 Volts monitor |  |
| +5 Volts monitor |  |
| _ROLL_ROT | 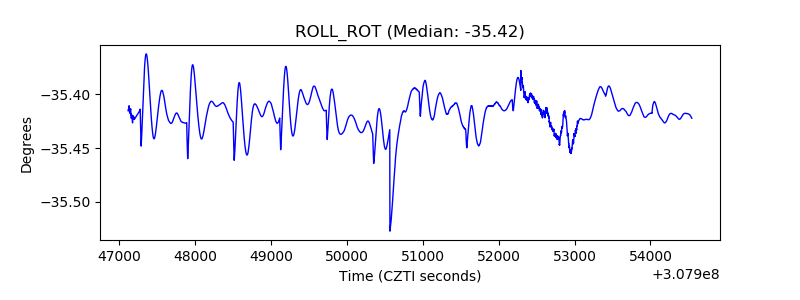 |
| _Roll_DEC | 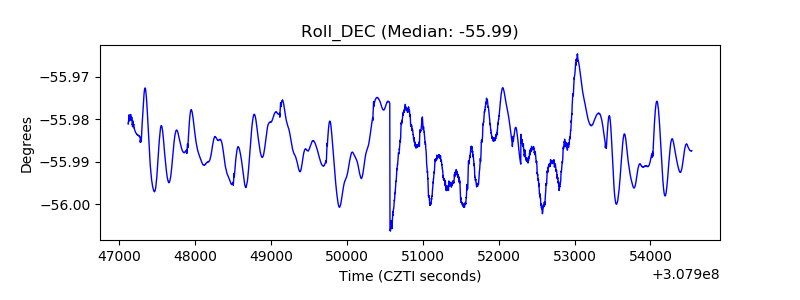 |
| _Roll_RA | 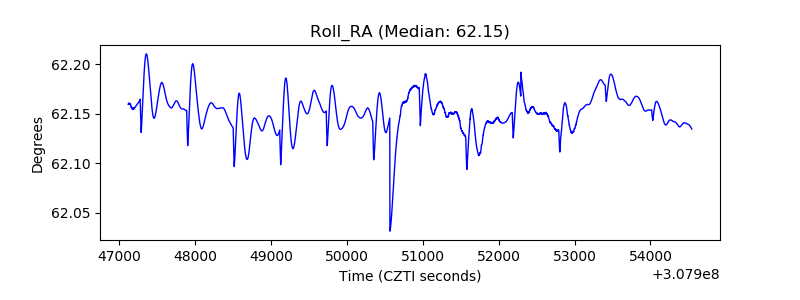 |
| Veto Counter | 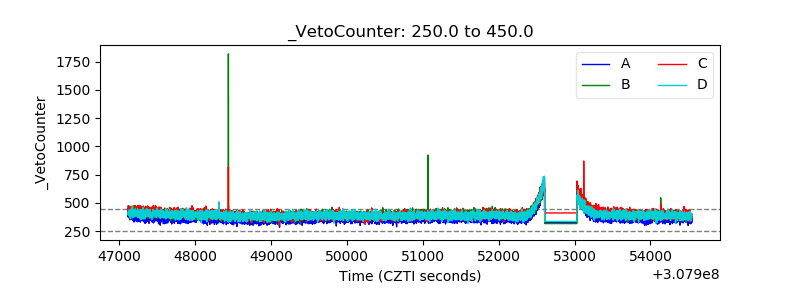 |