| Param | Original file | Final file |
|---|---|---|
| Filename | modeM0/AS1A07_010T04_9000003220_21731cztM0_level2.evt | modeM0/AS1A07_010T04_9000003220_21731cztM0_level2_quad_clean.evt |
| Size (bytes) | 339,082,560 | 52,954,560 |
| Size | 323.4 MB | 50.5 MB |
| Events in quadrant A | 3,393,688 | 309,540 |
| Events in quadrant B | 1,985,400 | 340,688 |
| Events in quadrant C | 2,068,634 | 330,618 |
| Events in quadrant D | 2,532,053 | 323,507 |
| Mode SS | |||
|---|---|---|---|
| Quadrant | BADHDUFLAG | Total packets | Discarded packets |
| A | 0 | 86 | 0 |
| B | 0 | 86 | 0 |
| C | 0 | 86 | 0 |
| D | 0 | 86 | 0 |
| Mode M0 | |||
|---|---|---|---|
| Quadrant | BADHDUFLAG | Total packets | Discarded packets |
| A | 0 | 13103 | 0 |
| B | 0 | 8718 | 0 |
| C | 0 | 8934 | 0 |
| D | 0 | 10406 | 0 |
| Quadrant | Total seconds | Saturated seconds | Saturation percentage |
|---|---|---|---|
| A | 4236 | 589 | 13.904627% |
| B | 4236 | 8 | 0.188857% |
| C | 4237 | 11 | 0.259618% |
| D | 4237 | 83 | 1.958933% |
Noise dominated data is calculated using 1-second bins in cleaned event files. If a bin has >2000 counts, and if more than 50% of those come from <1% of pixels, then it is considered to be noise-dominated and hence unusable.
| Quadrant | # 1 sec bins | Bins with >0 counts | Bins with >2000 counts | High rate bins dominated by noise | Noise dominated (total time) | Noise dominated (detector-on time) | Marked lightcurve |
|---|---|---|---|---|---|---|---|
| A | 4236 | 4236 | 451 | 451 | 10.65% | 10.65% |  |
| B | 4236 | 4236 | 5 | 5 | 0.12% | 0.12% | 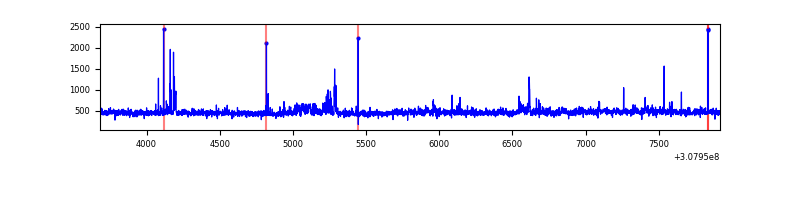 |
| C | 4237 | 4237 | 0 | 0 | 0.00% | 0.00% | 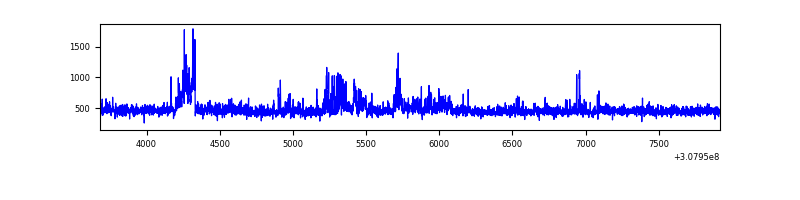 |
| D | 4237 | 4237 | 81 | 81 | 1.91% | 1.91% | 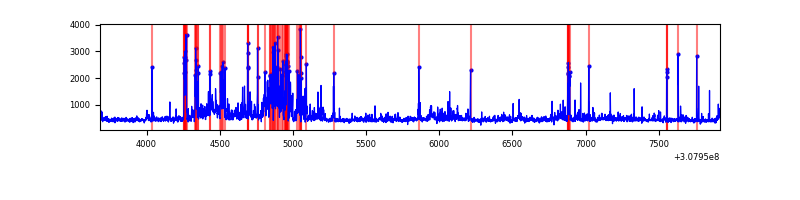 |
Top three noisy pixels from each quadrant. If the there are fewer than three noisy pixels in the level2.evt file, extra rows are filled as -1
| Pixel properties | Quadrant properties | ||||||
|---|---|---|---|---|---|---|---|
| Quadrant | DetID | PixID | Counts | Sigma | Mean | Median | Sigma |
| A | 15 | 236 | 1610757 | 17166.19 | 462 | 451 | 93.8 |
| A | 13 | 254 | 5949 | 58.61 | 462 | 451 | 93.8 |
| A | 0 | 226 | 4007 | 37.91 | 462 | 451 | 93.8 |
| B | 3 | 64 | 50377 | 541.66 | 477 | 465 | 92.1 |
| B | 0 | 230 | 41308 | 443.24 | 477 | 465 | 92.1 |
| B | 0 | 189 | 13234 | 138.57 | 477 | 465 | 92.1 |
| C | 8 | 208 | 184057 | 1679.05 | 464 | 465 | 109.3 |
| C | 14 | 238 | 74744 | 679.32 | 464 | 465 | 109.3 |
| C | 13 | 61 | 3333 | 26.23 | 464 | 465 | 109.3 |
| D | 14 | 35 | 552387 | 4817.35 | 467 | 453 | 114.6 |
| D | 12 | 235 | 118054 | 1026.44 | 467 | 453 | 114.6 |
| D | 2 | 136 | 25691 | 220.28 | 467 | 453 | 114.6 |
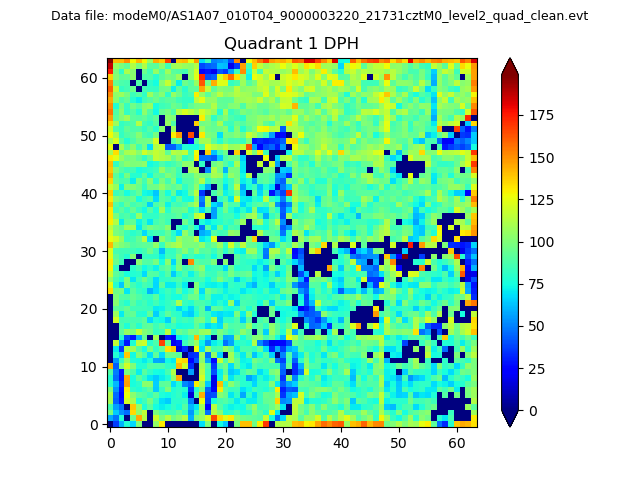
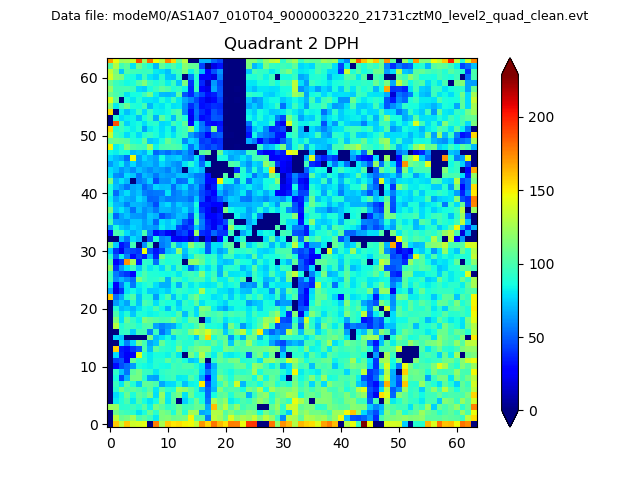
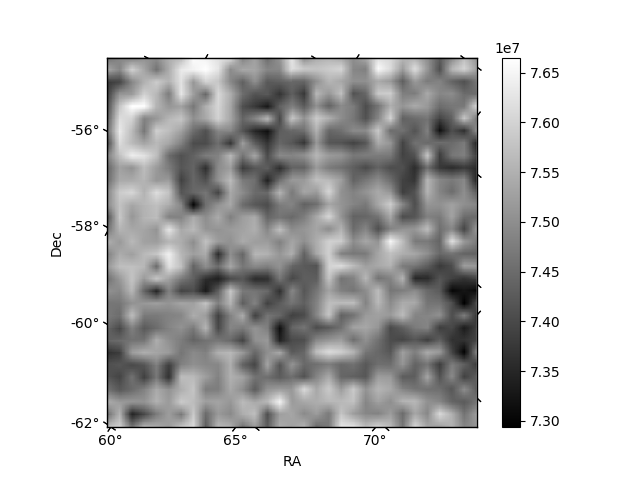
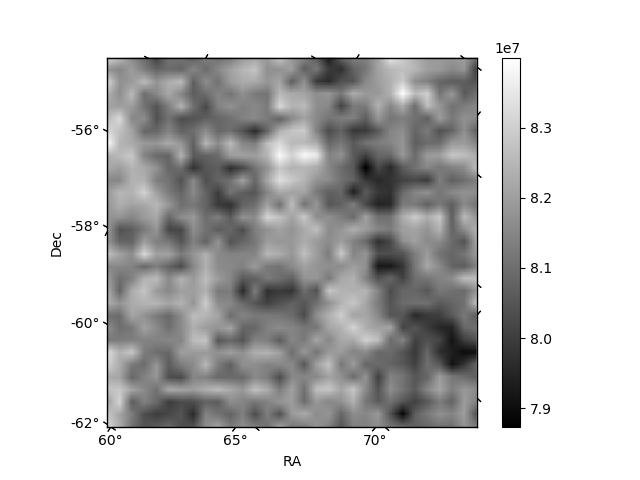
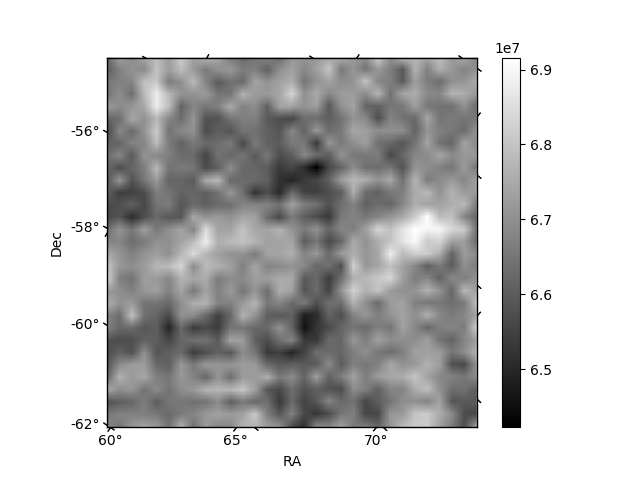
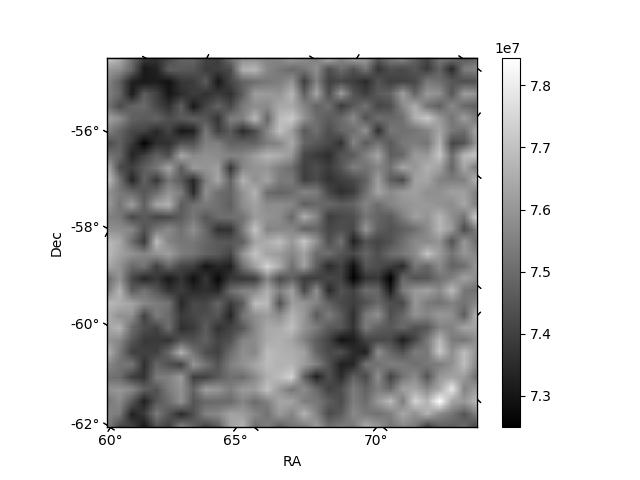
Histogram calculated using DETX and DETY for each event in the final _common_clean file
| Quadrant A | 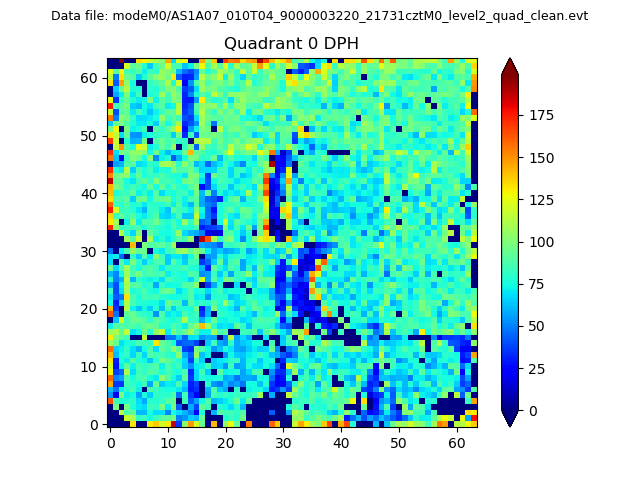 |
 |
Quadrant B |
|---|---|---|---|
| Quadrant D | 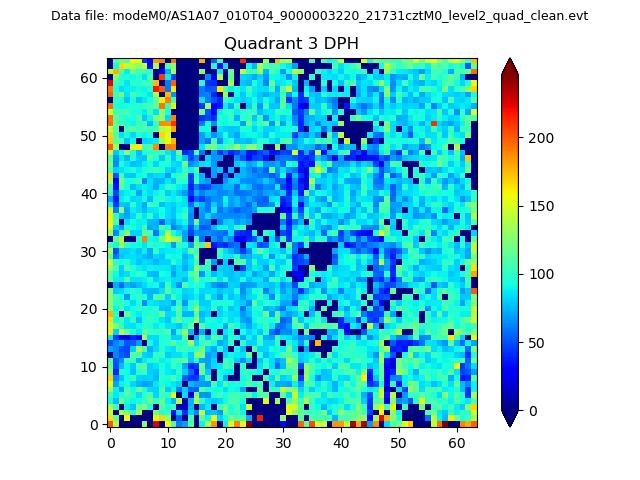 |
 |
Quadrant C |
| Plot type | Count rate plots | Images |
|---|---|---|
| Comparison with Poisson distribution Blue bars denote a histogram of data divided into 1 sec bins. Red curve is a Poisson curve with rate = median count rate of data. |
 |
 |
| Quadrant-wise count rates Data is divided into 100 sec bins |
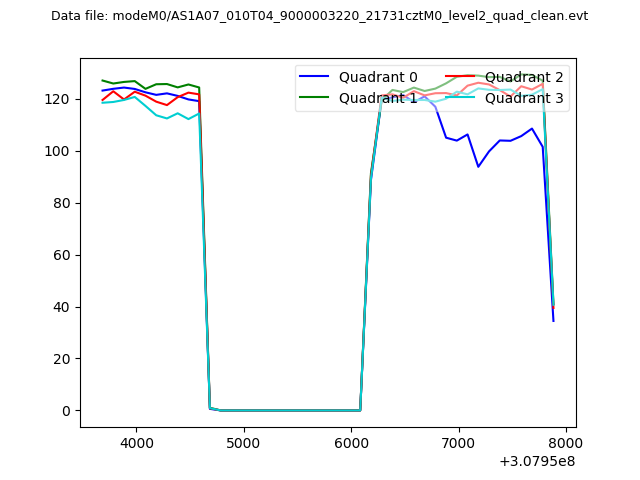 |
|
| Module-wise count rates for Quadrant A Data is divided into 100 sec bins |
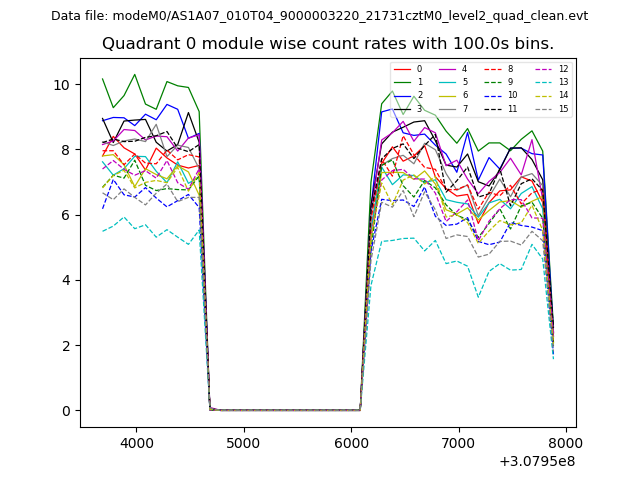 |
 |
| Module-wise count rates for Quadrant B Data is divided into 100 sec bins |
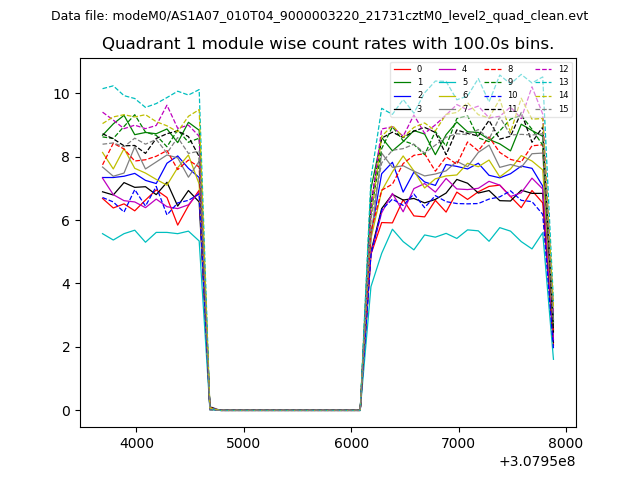 |
 |
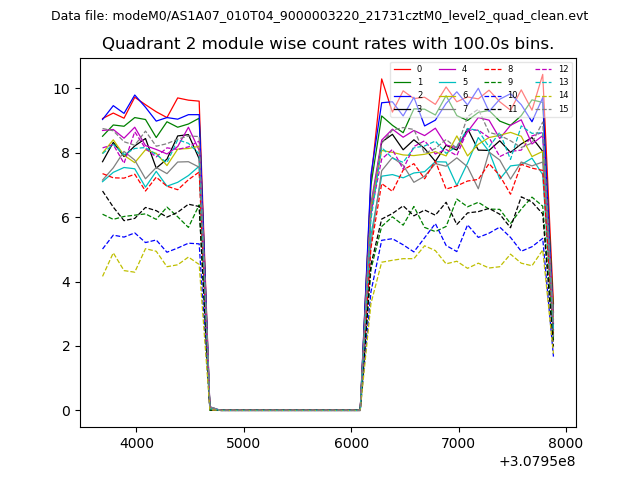
| Module-wise count rates for Quadrant C Data is divided into 100 sec bins |
 |
 |
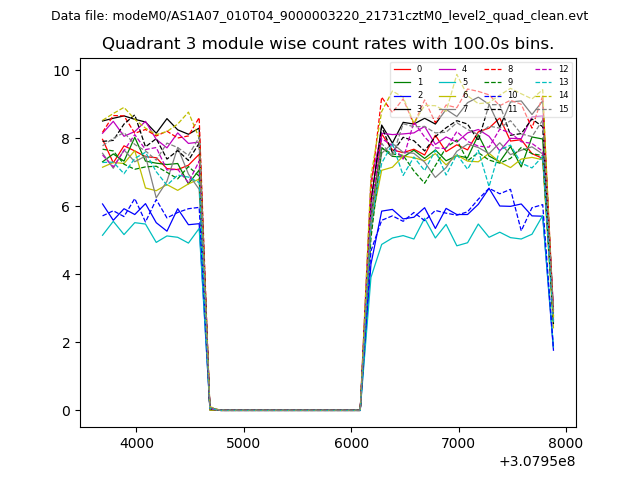
| Module-wise count rates for Quadrant D Data is divided into 100 sec bins |
 |
 |
| Parameter | Plot |
|---|---|
| CZT HV Monitor | 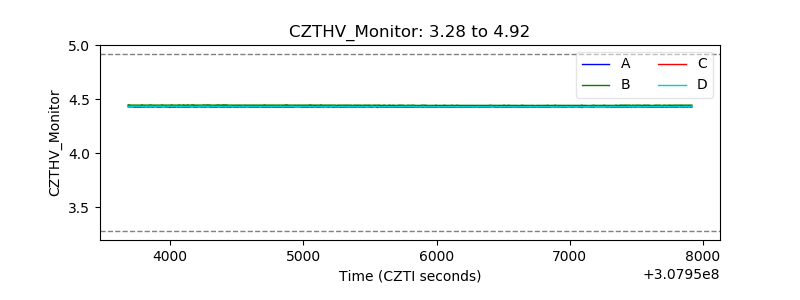 |
| D_VDD | 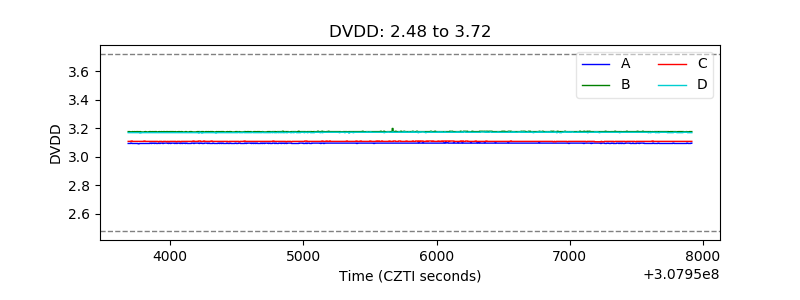 |
| Temperature 1 | 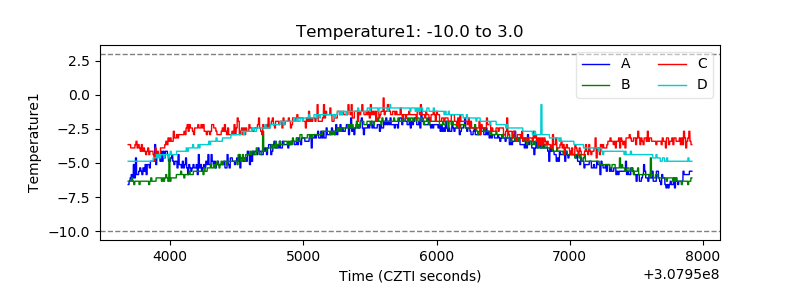 |
| Veto HV Monitor |  |
| Veto LLD | 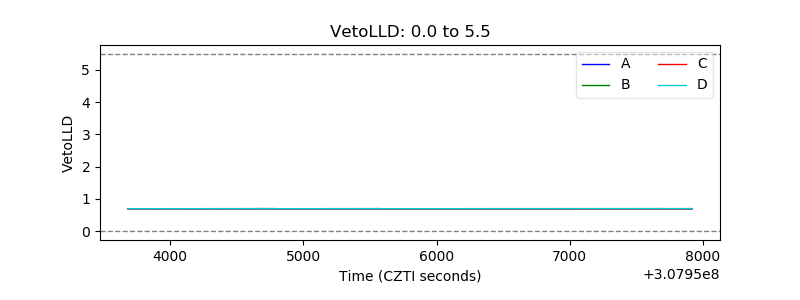 |
| Alpha Counter | 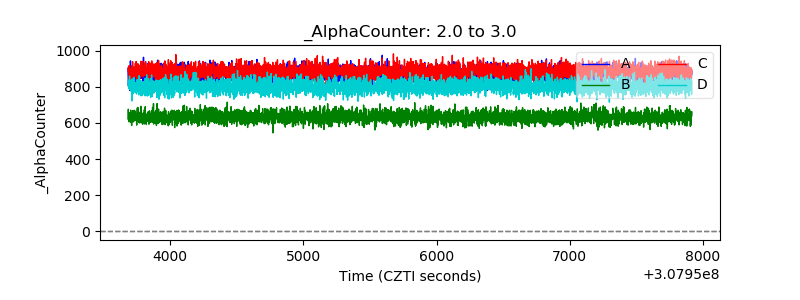 |
| _CPM_Rate | 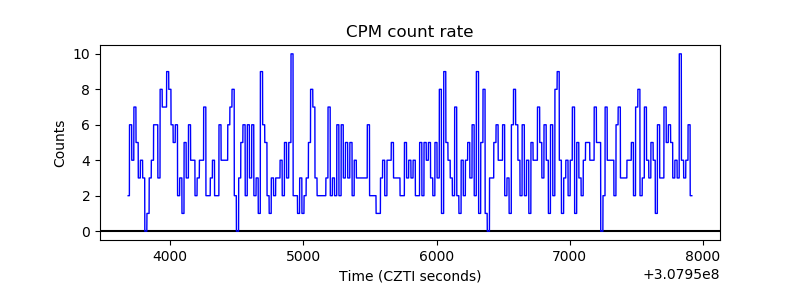 |
| CZT Counter | 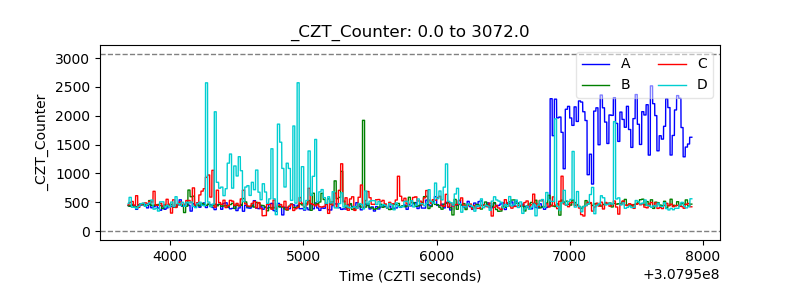 |
| +2.5 Volts monitor |  |
| +5 Volts monitor |  |
| _ROLL_ROT | 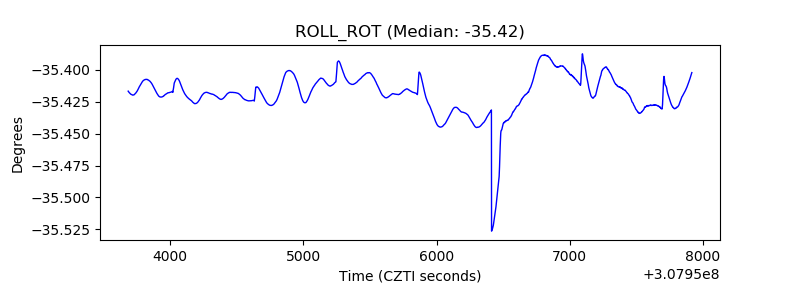 |
| _Roll_DEC | 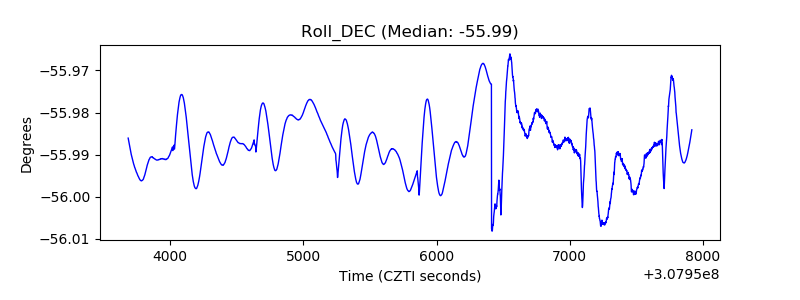 |
| _Roll_RA | 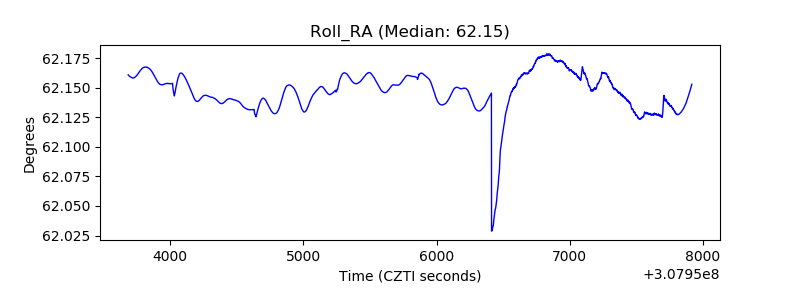 |
| Veto Counter | 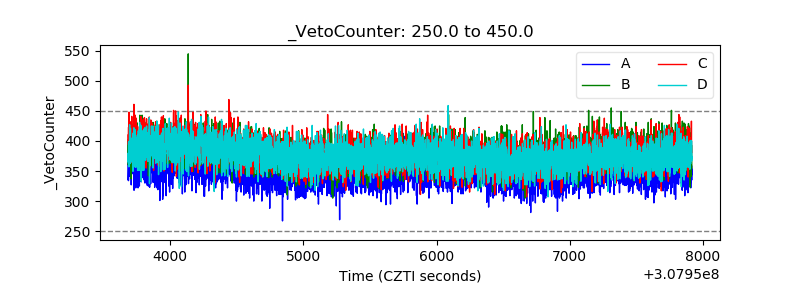 |