| Param | Original file | Final file |
|---|---|---|
| Filename | modeM0/AS1A07_059T01_9000003218_21721cztM0_level2.evt | modeM0/AS1A07_059T01_9000003218_21721cztM0_level2_quad_clean.evt |
| Size (bytes) | 625,812,480 | 98,222,400 |
| Size | 596.8 MB | 93.7 MB |
| Events in quadrant A | 4,209,219 | 603,754 |
| Events in quadrant B | 3,618,736 | 650,039 |
| Events in quadrant C | 3,463,757 | 634,575 |
| Events in quadrant D | 7,174,786 | 586,189 |
| Mode SS | |||
|---|---|---|---|
| Quadrant | BADHDUFLAG | Total packets | Discarded packets |
| A | 0 | 148 | 0 |
| B | 0 | 148 | 0 |
| C | 0 | 148 | 0 |
| D | 0 | 148 | 0 |
| Mode M0 | |||
|---|---|---|---|
| Quadrant | BADHDUFLAG | Total packets | Discarded packets |
| A | 0 | 17304 | 2 |
| B | 0 | 15486 | 2 |
| C | 0 | 14891 | 2 |
| D | 0 | 26324 | 3 |
| Mode M9 | |||
|---|---|---|---|
| Quadrant | BADHDUFLAG | Total packets | Discarded packets |
| A | 0 | 17 | 0 |
| B | 0 | 17 | 0 |
| C | 0 | 17 | 0 |
| D | 0 | 17 | 0 |
| Quadrant | Total seconds | Saturated seconds | Saturation percentage |
|---|---|---|---|
| A | 7173 | 447 | 6.231702% |
| B | 7173 | 125 | 1.742646% |
| C | 7173 | 140 | 1.951764% |
| D | 7172 | 1144 | 15.950920% |
Noise dominated data is calculated using 1-second bins in cleaned event files. If a bin has >2000 counts, and if more than 50% of those come from <1% of pixels, then it is considered to be noise-dominated and hence unusable.
| Quadrant | # 1 sec bins | Bins with >0 counts | Bins with >2000 counts | High rate bins dominated by noise | Noise dominated (total time) | Noise dominated (detector-on time) | Marked lightcurve |
|---|---|---|---|---|---|---|---|
| A | 8878 | 7175 | 352 | 352 | 3.96% | 4.91% | 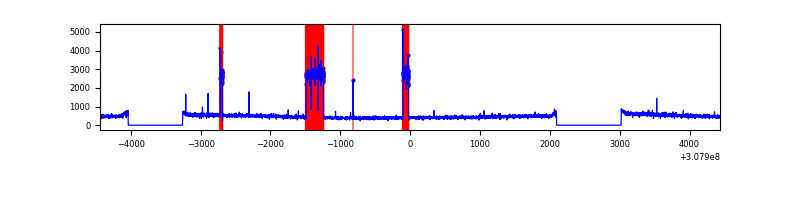 |
| B | 8878 | 7175 | 5 | 5 | 0.06% | 0.07% | 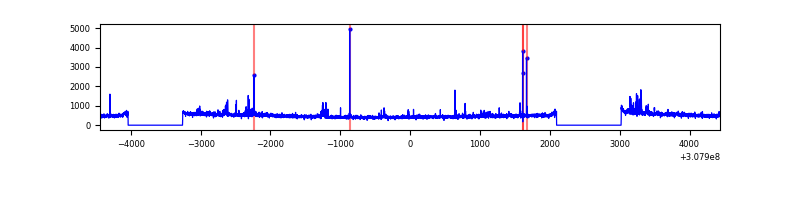 |
| C | 8878 | 7175 | 0 | 0 | 0.00% | 0.00% | 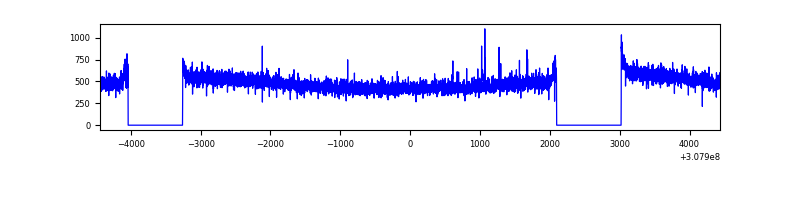 |
| D | 8877 | 7174 | 763 | 763 | 8.60% | 10.64% | 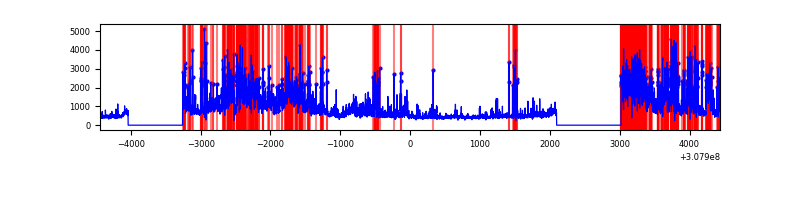 |
Top three noisy pixels from each quadrant. If the there are fewer than three noisy pixels in the level2.evt file, extra rows are filled as -1
| Pixel properties | Quadrant properties | ||||||
|---|---|---|---|---|---|---|---|
| Quadrant | DetID | PixID | Counts | Sigma | Mean | Median | Sigma |
| A | 15 | 236 | 927422 | 5434.81 | 849 | 832 | 170.5 |
| A | 13 | 254 | 12211 | 66.74 | 849 | 832 | 170.5 |
| A | 3 | 137 | 7436 | 38.74 | 849 | 832 | 170.5 |
| B | 0 | 197 | 100463 | 599.81 | 876 | 851 | 166.1 |
| B | 3 | 64 | 43725 | 258.16 | 876 | 851 | 166.1 |
| B | 12 | 111 | 20211 | 116.58 | 876 | 851 | 166.1 |
| C | 14 | 238 | 136610 | 678.51 | 851 | 855 | 200.1 |
| C | 8 | 208 | 6061 | 26.02 | 851 | 855 | 200.1 |
| C | 13 | 61 | 5910 | 25.26 | 851 | 855 | 200.1 |
| D | 12 | 235 | 2142708 | 11030.96 | 808 | 787 | 194.2 |
| D | 1 | 52 | 1360542 | 7002.78 | 808 | 787 | 194.2 |
| D | 1 | 20 | 305252 | 1568.0 | 808 | 787 | 194.2 |
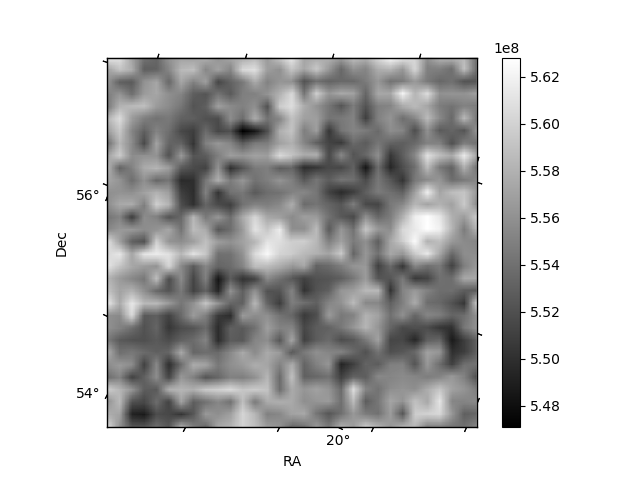
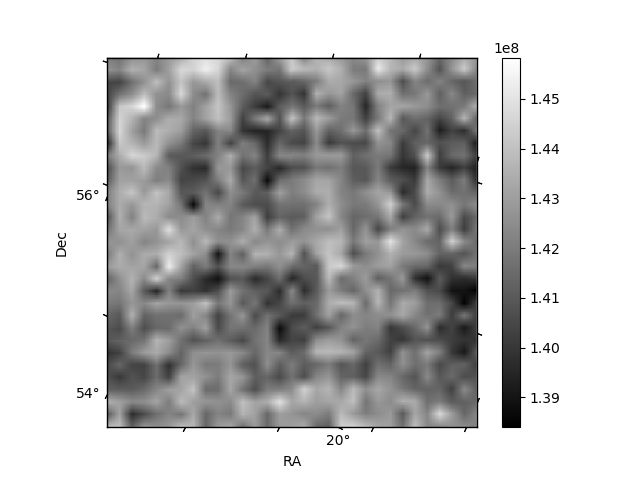
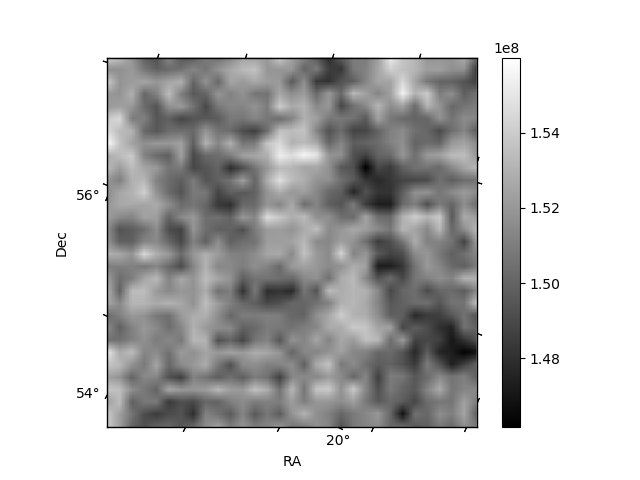
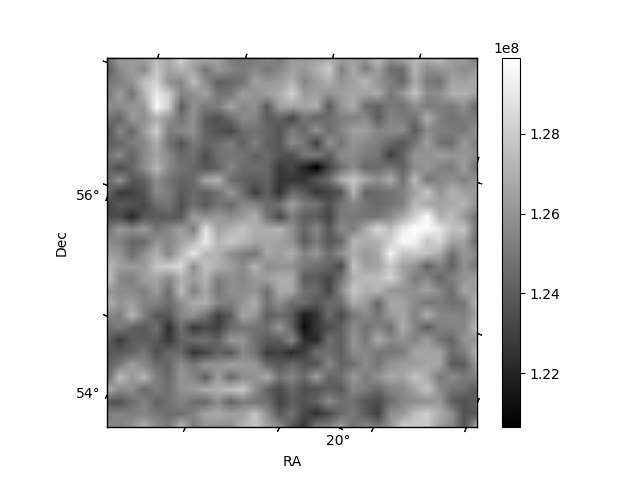
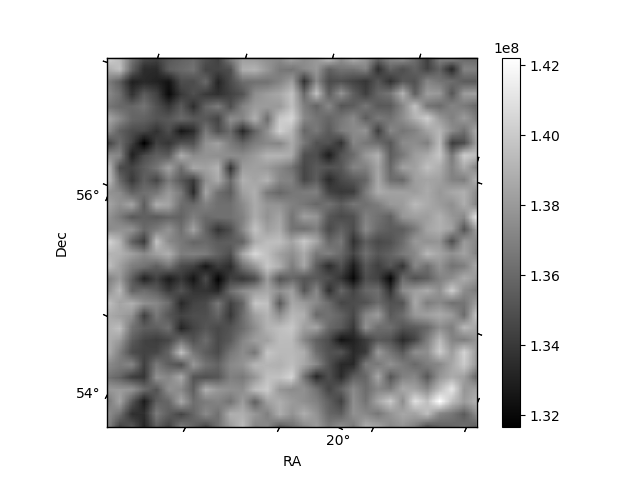
Histogram calculated using DETX and DETY for each event in the final _common_clean file
| Quadrant A | 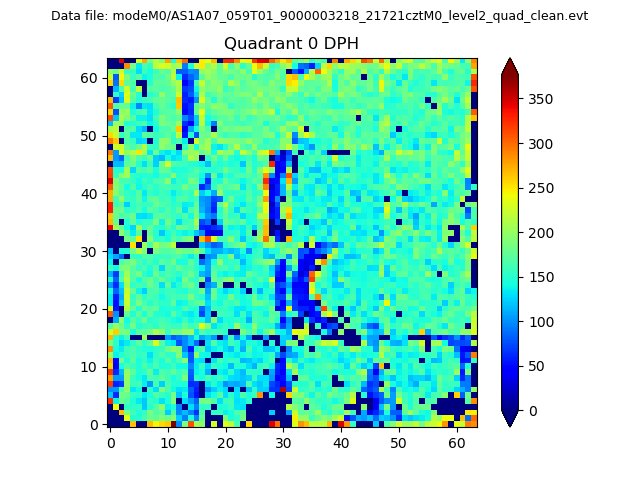 |
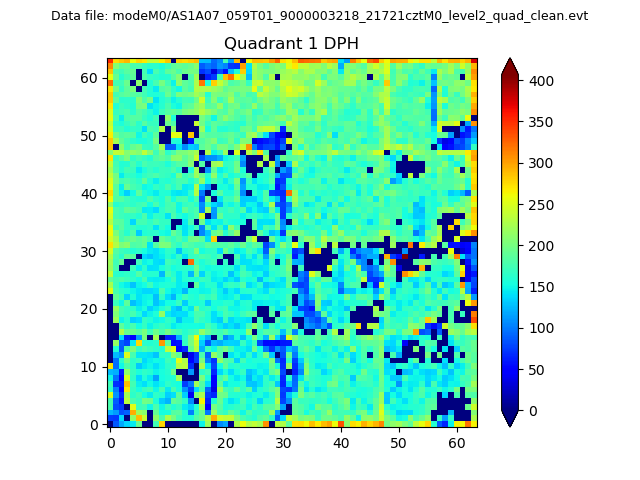 |
Quadrant B |
|---|---|---|---|
| Quadrant D |  |
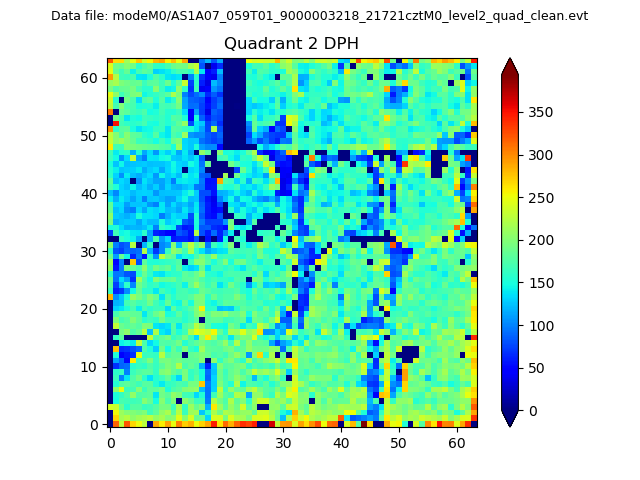 |
Quadrant C |
| Plot type | Count rate plots | Images |
|---|---|---|
| Comparison with Poisson distribution Blue bars denote a histogram of data divided into 1 sec bins. Red curve is a Poisson curve with rate = median count rate of data. |
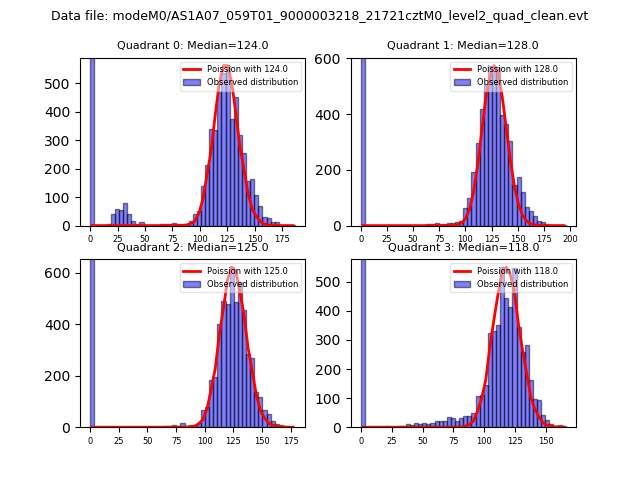 |
 |
| Quadrant-wise count rates Data is divided into 100 sec bins |
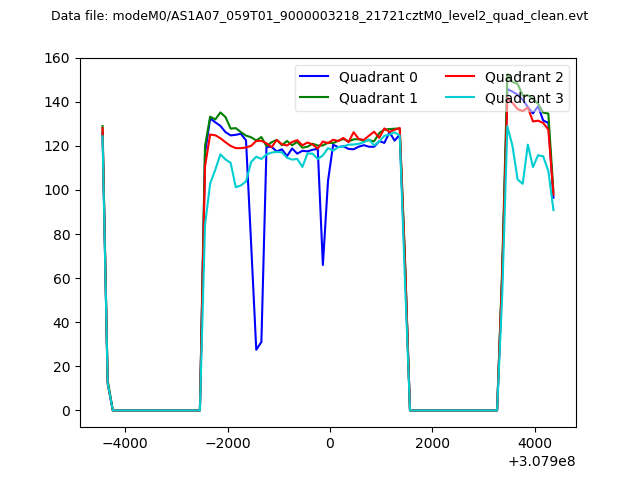 |
|
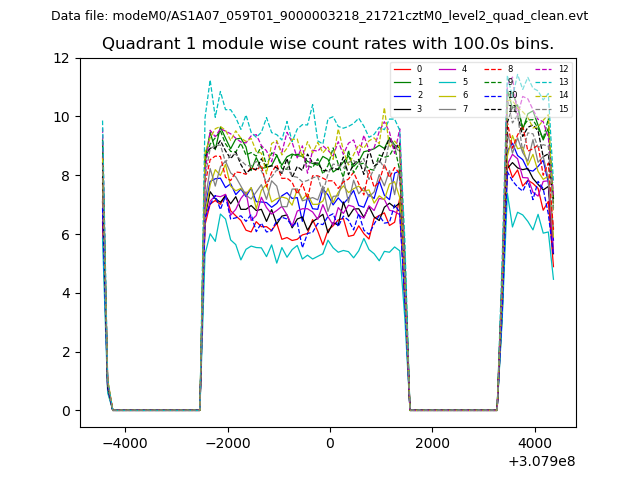
| Module-wise count rates for Quadrant A Data is divided into 100 sec bins |
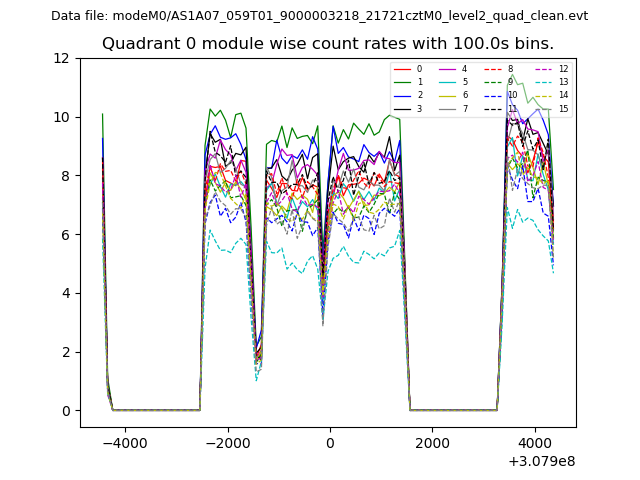 |
 |
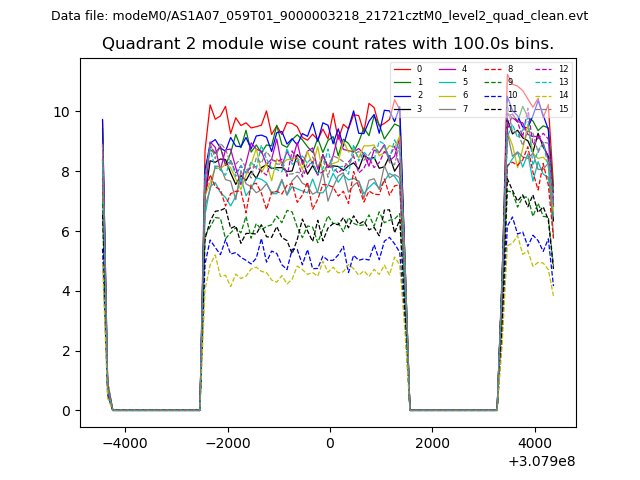
| Module-wise count rates for Quadrant B Data is divided into 100 sec bins |
 |
 |
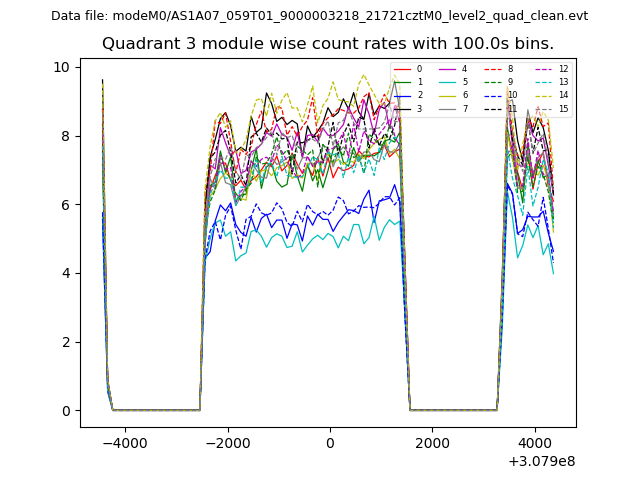
| Module-wise count rates for Quadrant C Data is divided into 100 sec bins |
 |
 |
| Module-wise count rates for Quadrant D Data is divided into 100 sec bins |
 |
 |
| Parameter | Plot |
|---|---|
| CZT HV Monitor | 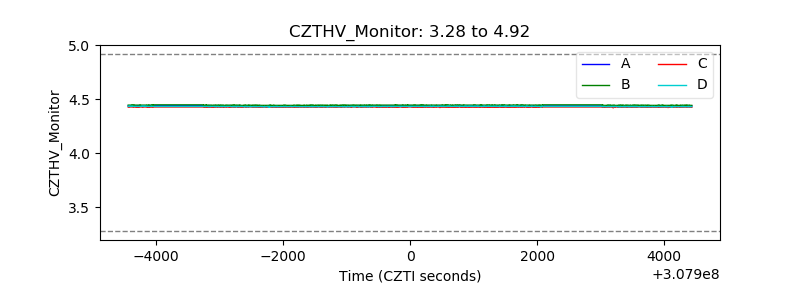 |
| D_VDD | 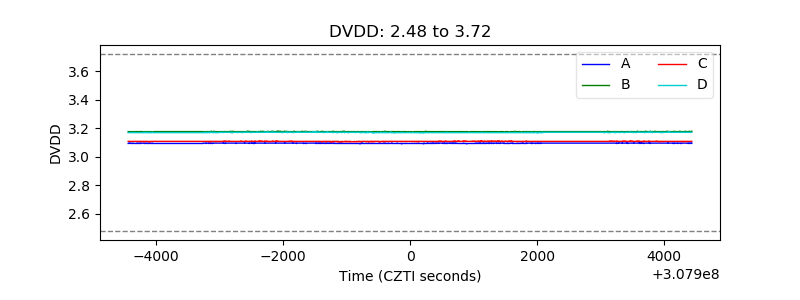 |
| Temperature 1 | 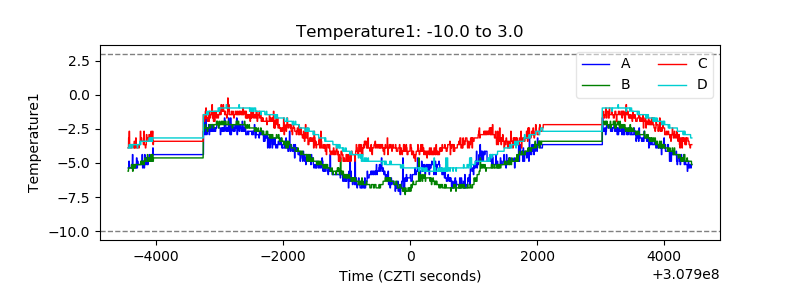 |
| Veto HV Monitor | 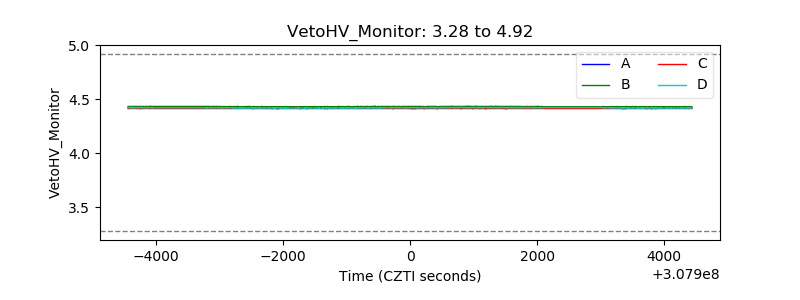 |
| Veto LLD | 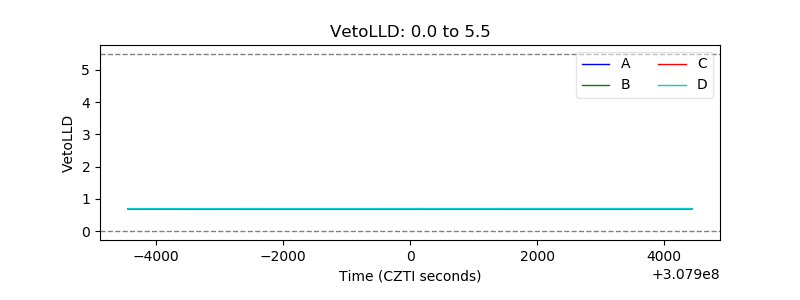 |
| Alpha Counter | 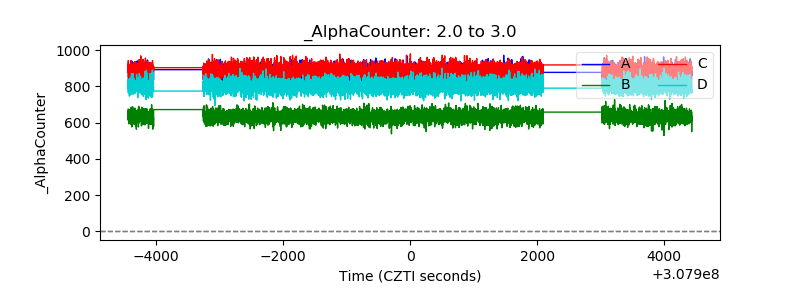 |
| _CPM_Rate | 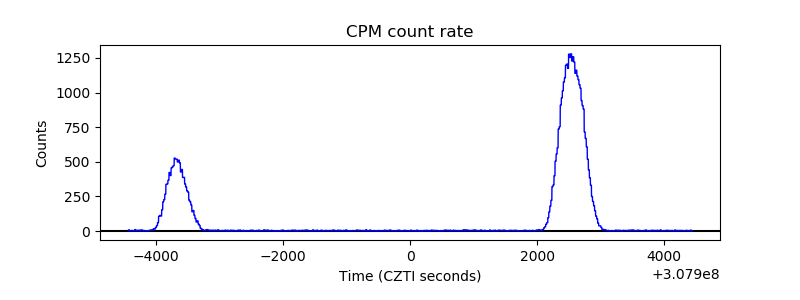 |
| CZT Counter | 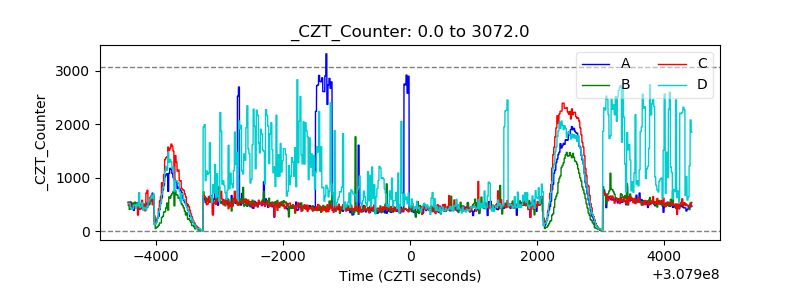 |
| +2.5 Volts monitor |  |
| +5 Volts monitor |  |
| _ROLL_ROT | 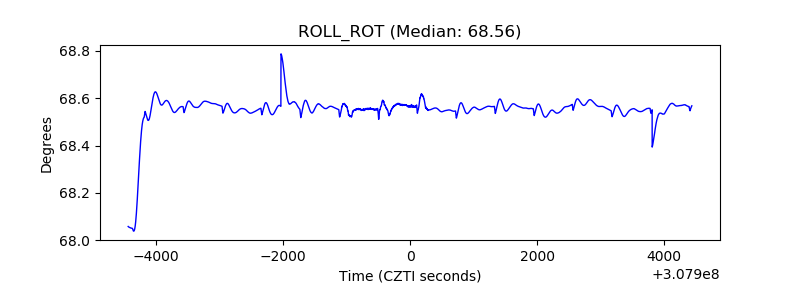 |
| _Roll_DEC | 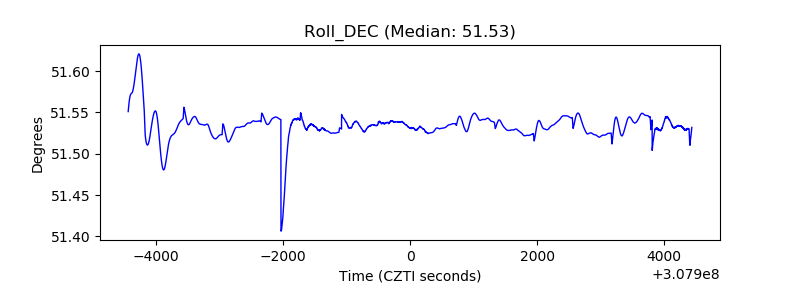 |
| _Roll_RA | 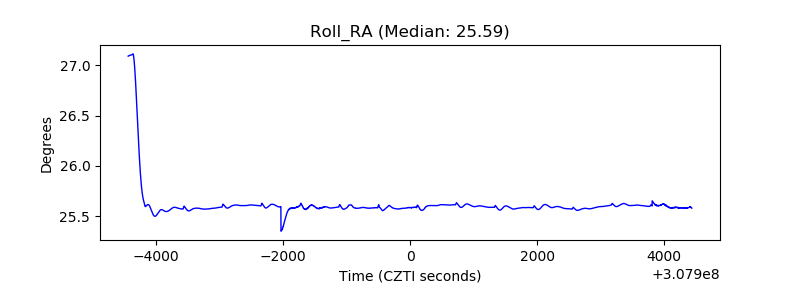 |
| Veto Counter | 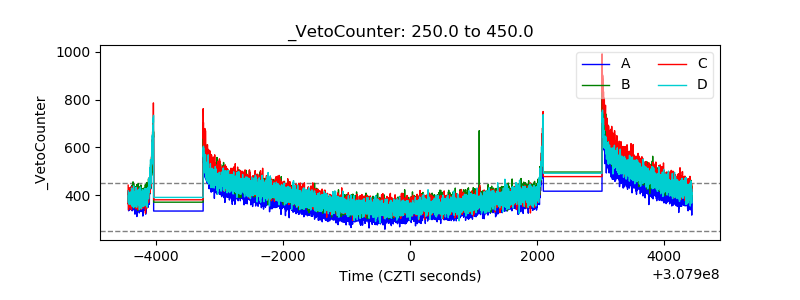 |