| Param | Original file | Final file |
|---|---|---|
| Filename | modeM0/AS1A07_059T01_9000003218_21723cztM0_level2.evt | modeM0/AS1A07_059T01_9000003218_21723cztM0_level2_quad_clean.evt |
| Size (bytes) | 537,082,560 | 106,133,760 |
| Size | 512.2 MB | 101.2 MB |
| Events in quadrant A | 3,716,556 | 689,395 |
| Events in quadrant B | 3,203,328 | 723,416 |
| Events in quadrant C | 3,104,599 | 704,738 |
| Events in quadrant D | 5,811,504 | 654,658 |
| Mode SS | |||
|---|---|---|---|
| Quadrant | BADHDUFLAG | Total packets | Discarded packets |
| A | 0 | 128 | 0 |
| B | 0 | 128 | 0 |
| C | 0 | 128 | 0 |
| D | 0 | 128 | 0 |
| Mode M0 | |||
|---|---|---|---|
| Quadrant | BADHDUFLAG | Total packets | Discarded packets |
| A | 0 | 15427 | 1 |
| B | 0 | 13752 | 1 |
| C | 0 | 13418 | 1 |
| D | 0 | 21704 | 1 |
| Mode M9 | |||
|---|---|---|---|
| Quadrant | BADHDUFLAG | Total packets | Discarded packets |
| A | 0 | 11 | 0 |
| B | 0 | 11 | 0 |
| C | 0 | 11 | 0 |
| D | 0 | 11 | 0 |
| Quadrant | Total seconds | Saturated seconds | Saturation percentage |
|---|---|---|---|
| A | 6335 | 337 | 5.319653% |
| B | 6336 | 59 | 0.931187% |
| C | 6336 | 66 | 1.041667% |
| D | 6335 | 652 | 10.292028% |
Noise dominated data is calculated using 1-second bins in cleaned event files. If a bin has >2000 counts, and if more than 50% of those come from <1% of pixels, then it is considered to be noise-dominated and hence unusable.
| Quadrant | # 1 sec bins | Bins with >0 counts | Bins with >2000 counts | High rate bins dominated by noise | Noise dominated (total time) | Noise dominated (detector-on time) | Marked lightcurve |
|---|---|---|---|---|---|---|---|
| A | 7420 | 6336 | 280 | 280 | 3.77% | 4.42% | 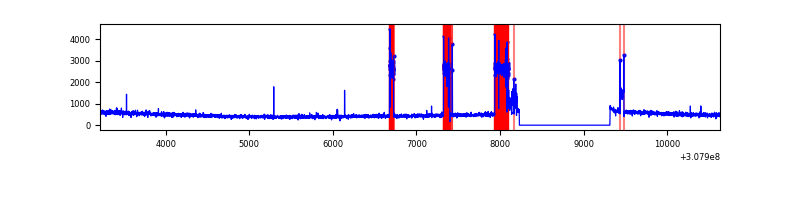 |
| B | 7421 | 6337 | 7 | 7 | 0.09% | 0.11% | 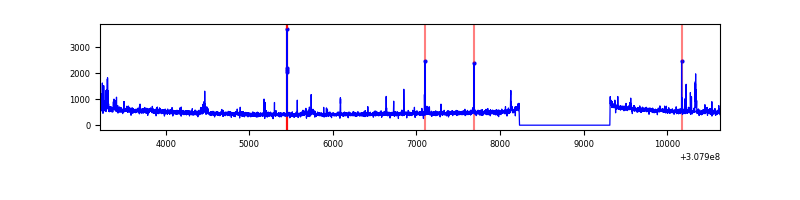 |
| C | 7421 | 6337 | 0 | 0 | 0.00% | 0.00% | 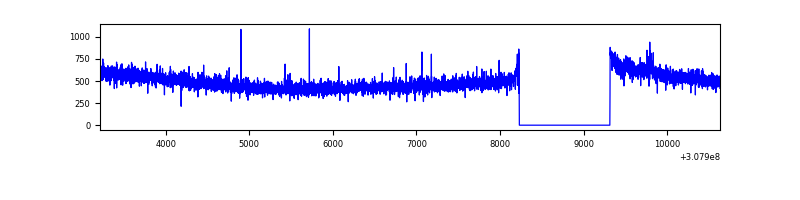 |
| D | 7420 | 6336 | 506 | 506 | 6.82% | 7.99% | 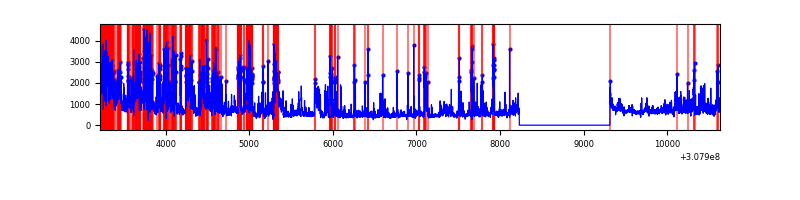 |
Top three noisy pixels from each quadrant. If the there are fewer than three noisy pixels in the level2.evt file, extra rows are filled as -1
| Pixel properties | Quadrant properties | ||||||
|---|---|---|---|---|---|---|---|
| Quadrant | DetID | PixID | Counts | Sigma | Mean | Median | Sigma |
| A | 15 | 236 | 821707 | 5479.64 | 749 | 733 | 149.8 |
| A | 13 | 254 | 10292 | 63.8 | 749 | 733 | 149.8 |
| A | 0 | 226 | 6420 | 37.96 | 749 | 733 | 149.8 |
| B | 3 | 64 | 57094 | 384.91 | 778 | 760 | 146.4 |
| B | 0 | 197 | 55089 | 371.21 | 778 | 760 | 146.4 |
| B | 6 | 36 | 26006 | 172.5 | 778 | 760 | 146.4 |
| C | 14 | 238 | 120694 | 672.07 | 762 | 767 | 178.4 |
| C | 10 | 23 | 10185 | 52.78 | 762 | 767 | 178.4 |
| C | 8 | 208 | 5370 | 25.8 | 762 | 767 | 178.4 |
| D | 12 | 235 | 1366620 | 7700.84 | 738 | 720 | 177.4 |
| D | 1 | 52 | 1193245 | 6723.36 | 738 | 720 | 177.4 |
| D | 1 | 20 | 169218 | 949.98 | 738 | 720 | 177.4 |
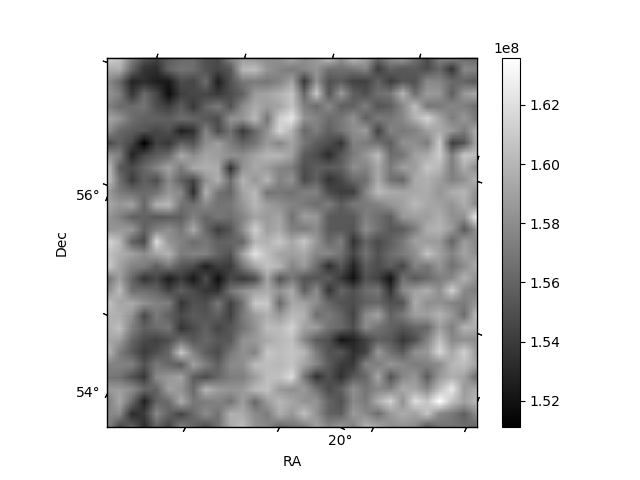
Histogram calculated using DETX and DETY for each event in the final _common_clean file
| Quadrant A |  |
 |
Quadrant B |
|---|---|---|---|
| Quadrant D |  |
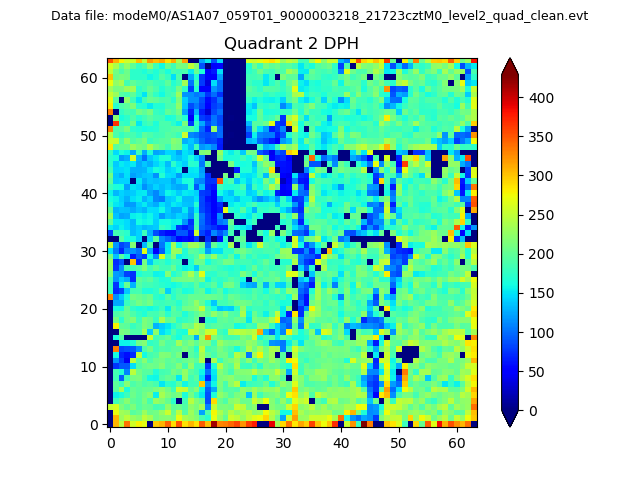 |
Quadrant C |
| Plot type | Count rate plots | Images |
|---|---|---|
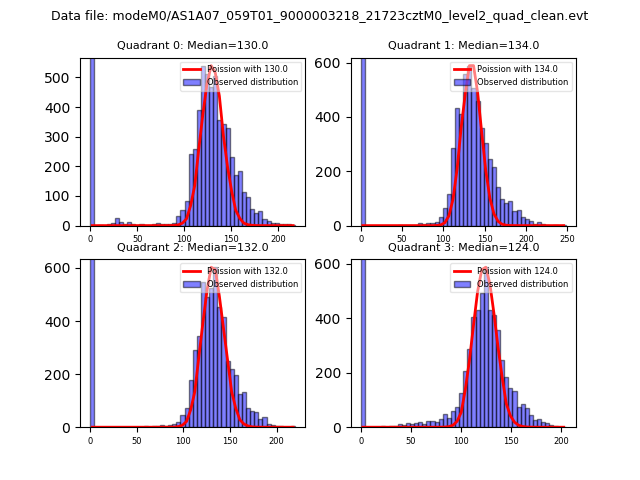
| Comparison with Poisson distribution Blue bars denote a histogram of data divided into 1 sec bins. Red curve is a Poisson curve with rate = median count rate of data. |
 |
 |
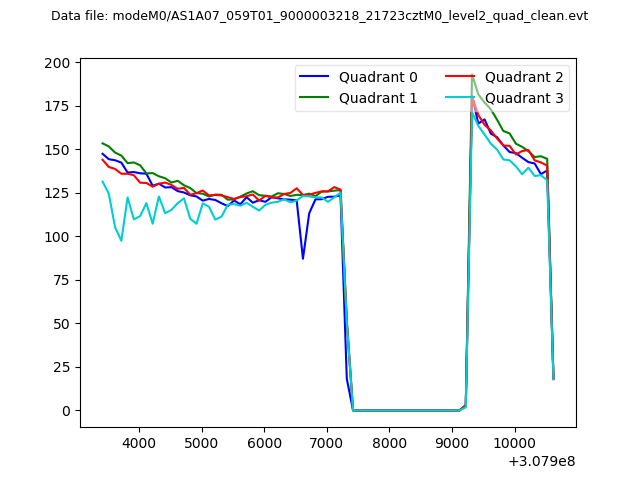
| Quadrant-wise count rates Data is divided into 100 sec bins |
 |
|
| Module-wise count rates for Quadrant A Data is divided into 100 sec bins |
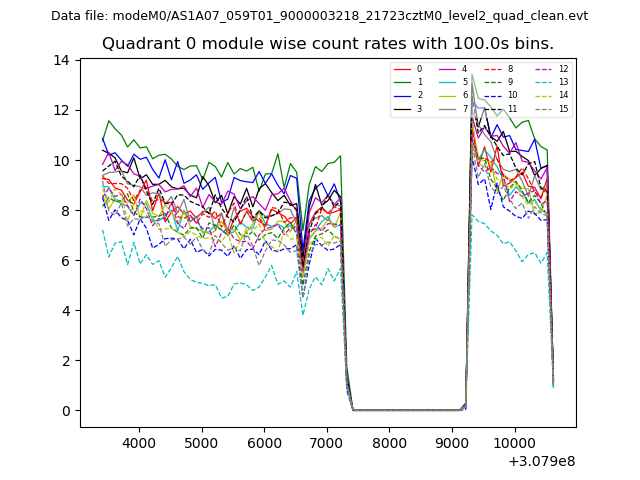 |
 |
| Module-wise count rates for Quadrant B Data is divided into 100 sec bins |
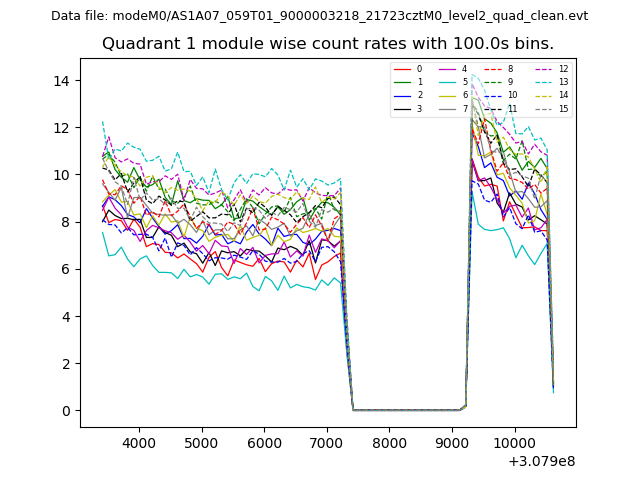 |
 |
| Module-wise count rates for Quadrant C Data is divided into 100 sec bins |
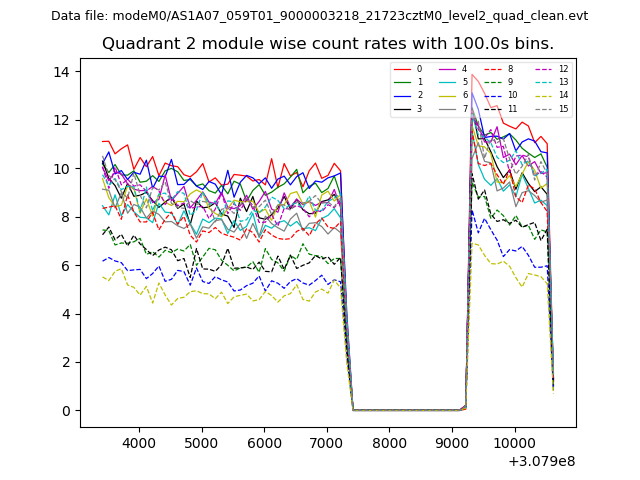 |
 |
| Module-wise count rates for Quadrant D Data is divided into 100 sec bins |
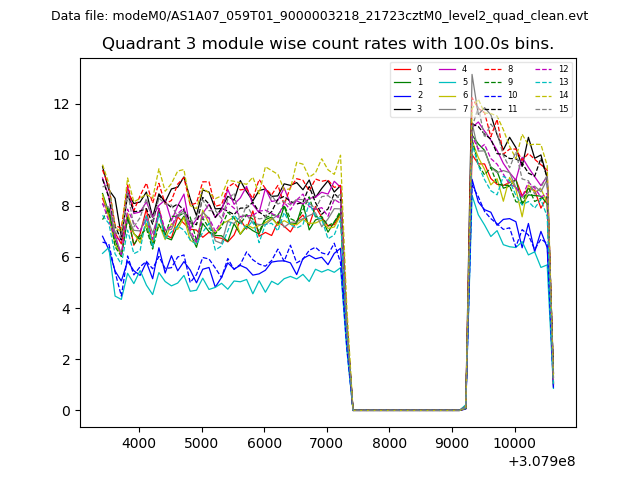 |
 |
| Parameter | Plot |
|---|---|
| CZT HV Monitor | 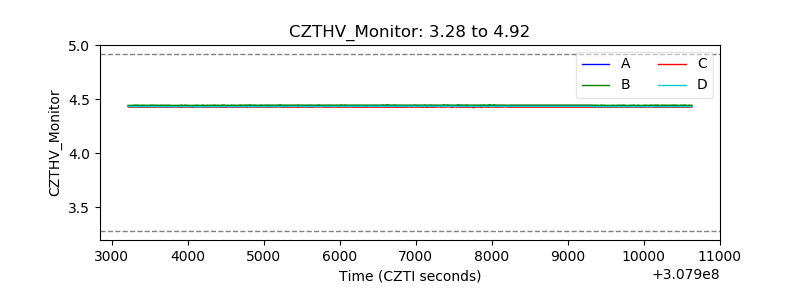 |
| D_VDD | 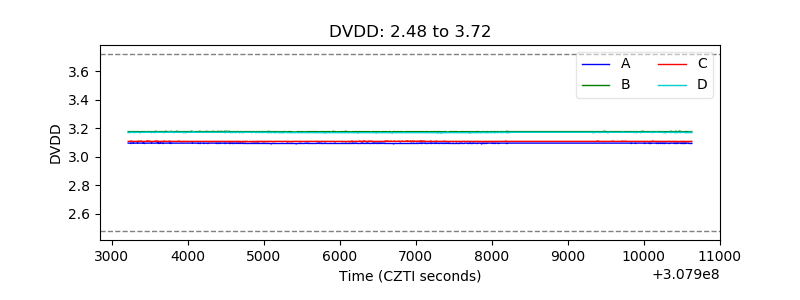 |
| Temperature 1 | 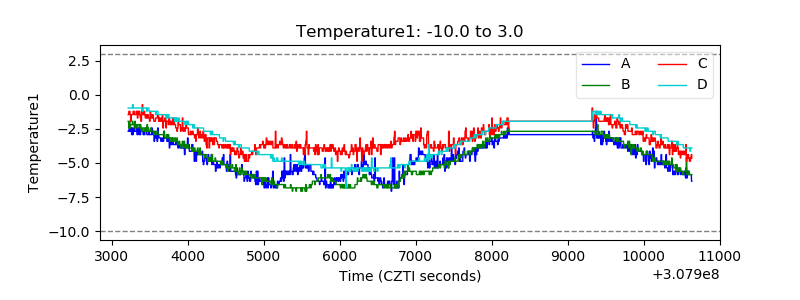 |
| Veto HV Monitor | 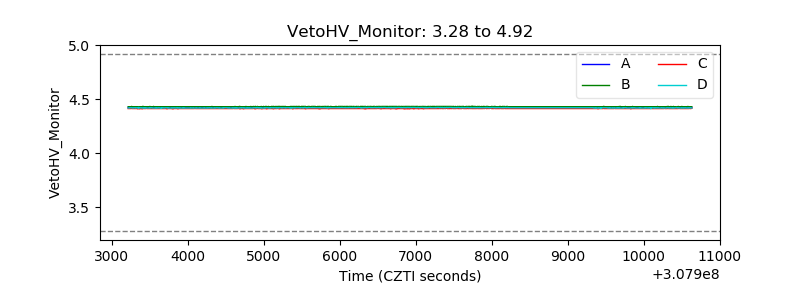 |
| Veto LLD | 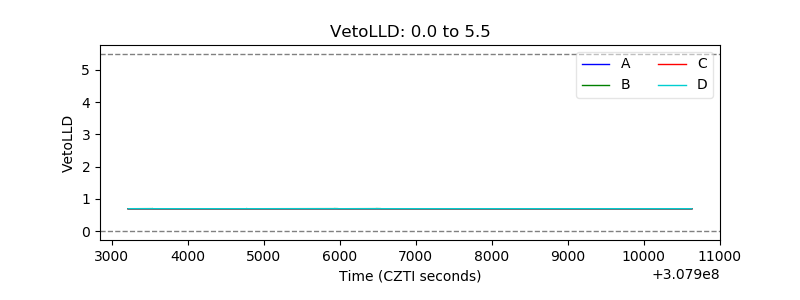 |
| Alpha Counter | 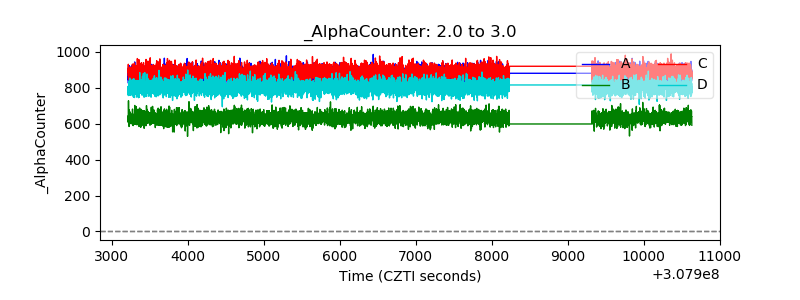 |
| _CPM_Rate | 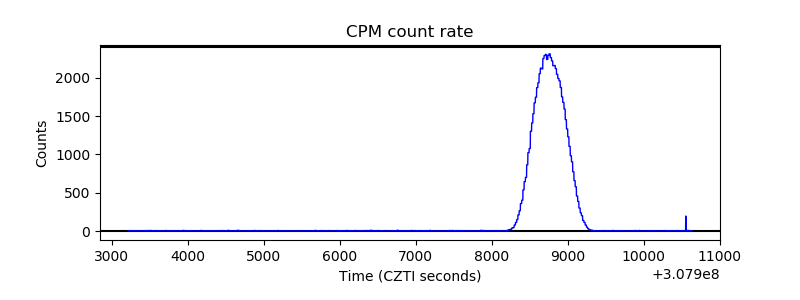 |
| CZT Counter | 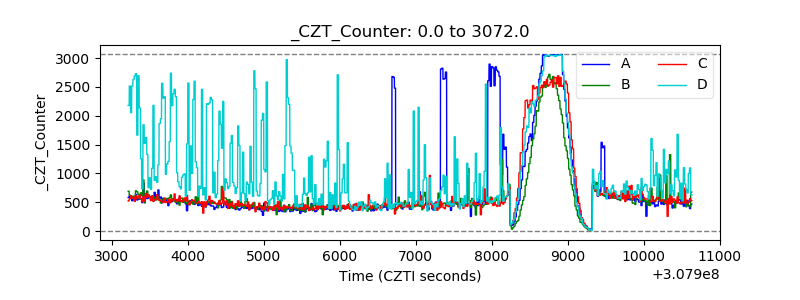 |
| +2.5 Volts monitor |  |
| +5 Volts monitor |  |
| _ROLL_ROT | 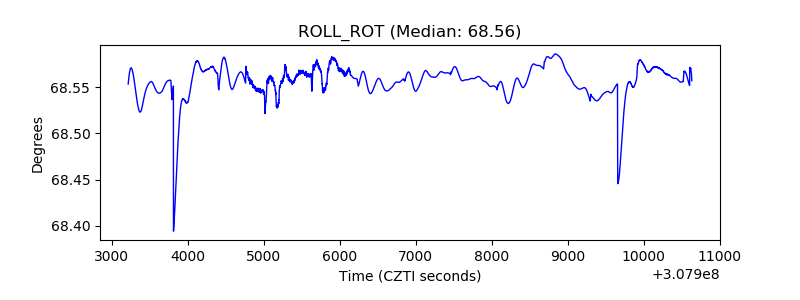 |
| _Roll_DEC | 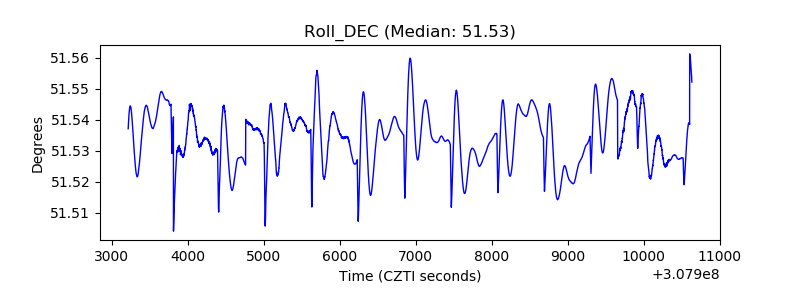 |
| _Roll_RA | 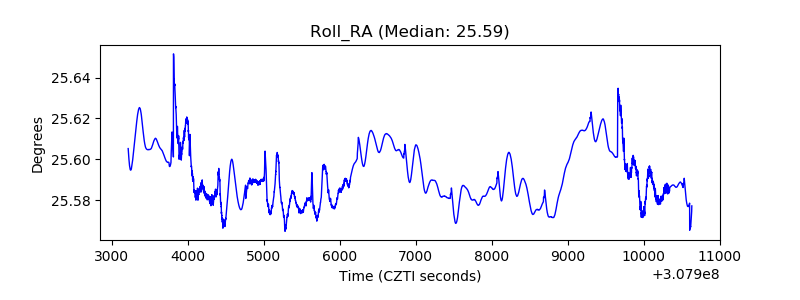 |
| Veto Counter | 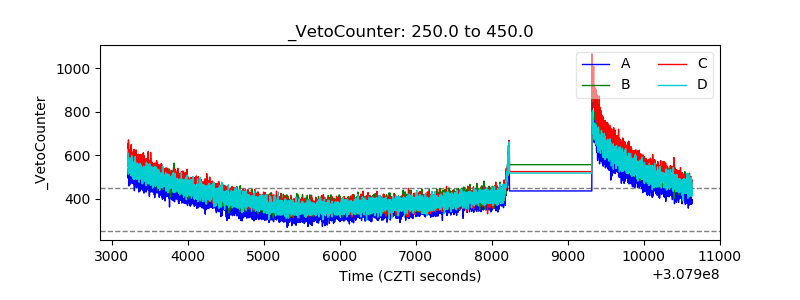 |