| Param | Original file | Final file |
|---|---|---|
| Filename | modeM0/AS1A07_059T01_9000003218_21724cztM0_level2.evt | modeM0/AS1A07_059T01_9000003218_21724cztM0_level2_quad_clean.evt |
| Size (bytes) | 210,890,880 | 43,920,000 |
| Size | 201.1 MB | 41.9 MB |
| Events in quadrant A | 1,620,455 | 288,201 |
| Events in quadrant B | 1,286,687 | 303,799 |
| Events in quadrant C | 1,252,261 | 293,492 |
| Events in quadrant D | 2,066,650 | 275,536 |
| Mode SS | |||
|---|---|---|---|
| Quadrant | BADHDUFLAG | Total packets | Discarded packets |
| A | 0 | 50 | 0 |
| B | 0 | 50 | 0 |
| C | 0 | 50 | 0 |
| D | 0 | 50 | 0 |
| Mode M0 | |||
|---|---|---|---|
| Quadrant | BADHDUFLAG | Total packets | Discarded packets |
| A | 0 | 6402 | 1 |
| B | 0 | 5329 | 1 |
| C | 0 | 5222 | 1 |
| D | 0 | 7838 | 1 |
| Mode M9 | |||
|---|---|---|---|
| Quadrant | BADHDUFLAG | Total packets | Discarded packets |
| A | 0 | 11 | 0 |
| B | 0 | 11 | 0 |
| C | 0 | 11 | 0 |
| D | 0 | 11 | 0 |
| Quadrant | Total seconds | Saturated seconds | Saturation percentage |
|---|---|---|---|
| A | 2335 | 205 | 8.779443% |
| B | 2336 | 37 | 1.583904% |
| C | 2336 | 46 | 1.969178% |
| D | 2336 | 71 | 3.039384% |
Noise dominated data is calculated using 1-second bins in cleaned event files. If a bin has >2000 counts, and if more than 50% of those come from <1% of pixels, then it is considered to be noise-dominated and hence unusable.
| Quadrant | # 1 sec bins | Bins with >0 counts | Bins with >2000 counts | High rate bins dominated by noise | Noise dominated (total time) | Noise dominated (detector-on time) | Marked lightcurve |
|---|---|---|---|---|---|---|---|
| A | 3420 | 2336 | 158 | 158 | 4.62% | 6.76% | 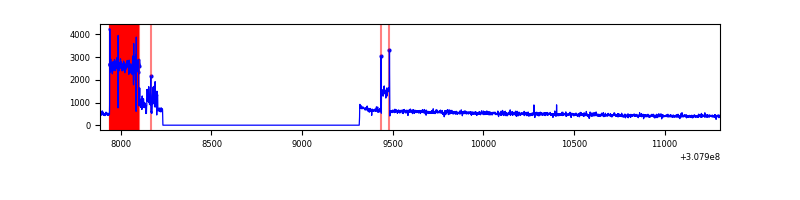 |
| B | 3421 | 2337 | 2 | 2 | 0.06% | 0.09% | 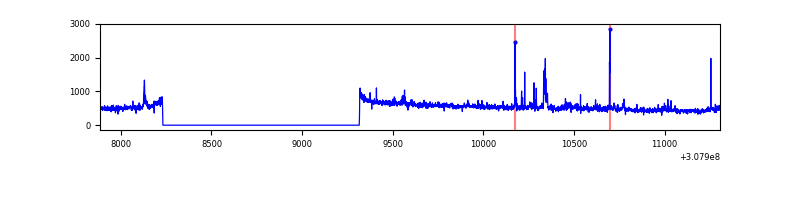 |
| C | 3421 | 2337 | 0 | 0 | 0.00% | 0.00% |  |
| D | 3421 | 2337 | 39 | 39 | 1.14% | 1.67% | 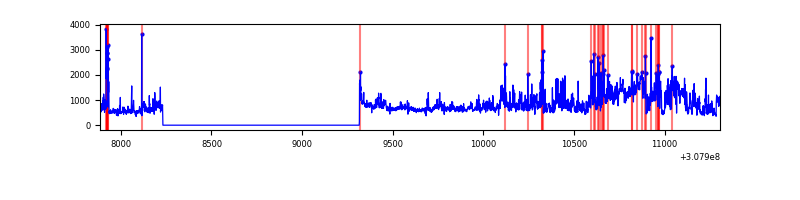 |
Top three noisy pixels from each quadrant. If the there are fewer than three noisy pixels in the level2.evt file, extra rows are filled as -1
| Pixel properties | Quadrant properties | ||||||
|---|---|---|---|---|---|---|---|
| Quadrant | DetID | PixID | Counts | Sigma | Mean | Median | Sigma |
| A | 15 | 236 | 497525 | 8354.28 | 291 | 285 | 59.5 |
| A | 13 | 254 | 3817 | 59.34 | 291 | 285 | 59.5 |
| A | 0 | 226 | 2510 | 37.38 | 291 | 285 | 59.5 |
| B | 6 | 36 | 25349 | 422.76 | 309 | 302 | 59.2 |
| B | 0 | 197 | 20497 | 340.87 | 309 | 302 | 59.2 |
| B | 0 | 230 | 15391 | 254.69 | 309 | 302 | 59.2 |
| C | 14 | 238 | 48914 | 667.87 | 306 | 308 | 72.8 |
| C | 10 | 23 | 8813 | 116.86 | 306 | 308 | 72.8 |
| C | 13 | 61 | 2143 | 25.21 | 306 | 308 | 72.8 |
| D | 1 | 52 | 563176 | 7576.62 | 304 | 295 | 74.3 |
| D | 12 | 235 | 298259 | 4010.72 | 304 | 295 | 74.3 |
| D | 14 | 35 | 12493 | 164.19 | 304 | 295 | 74.3 |
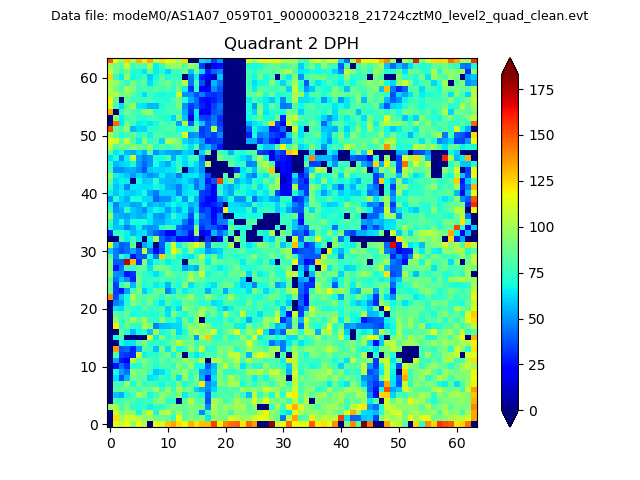
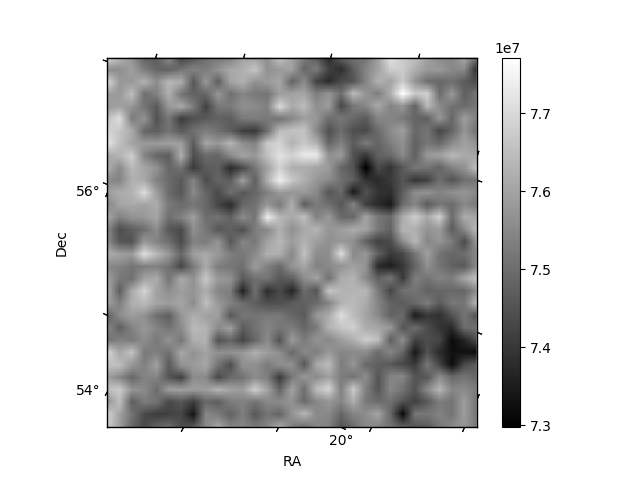
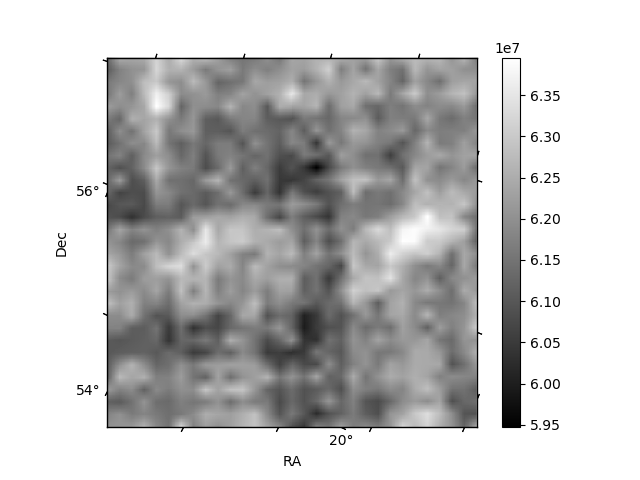
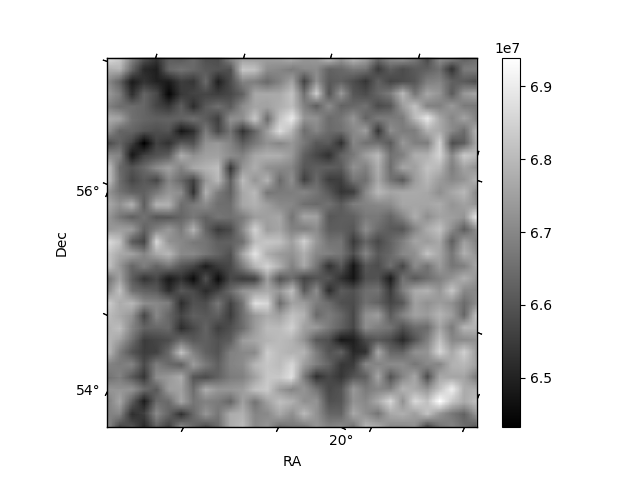
Histogram calculated using DETX and DETY for each event in the final _common_clean file
| Quadrant A | 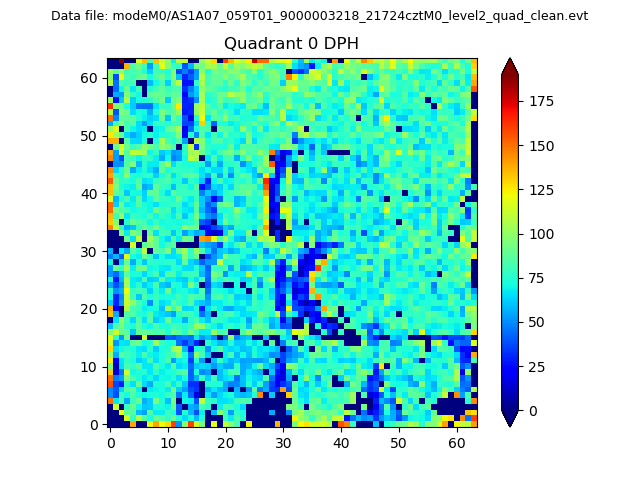 |
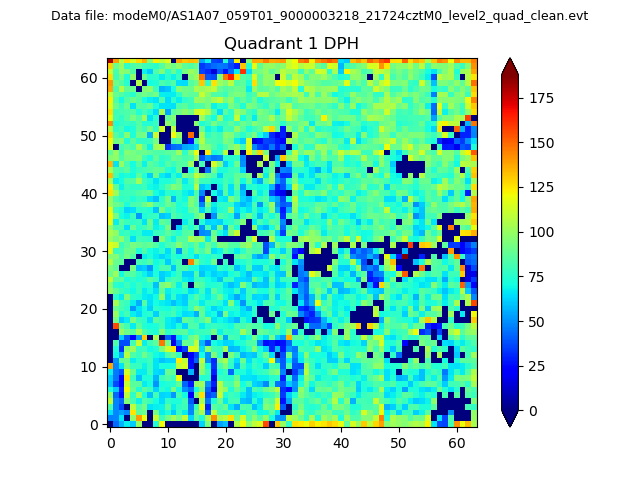 |
Quadrant B |
|---|---|---|---|
| Quadrant D | 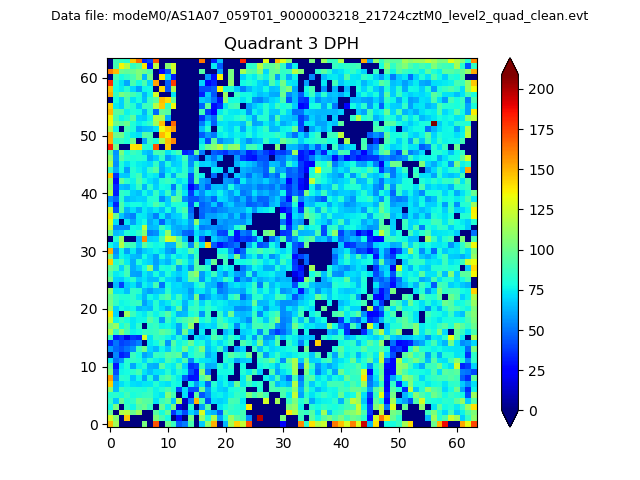 |
 |
Quadrant C |
| Plot type | Count rate plots | Images |
|---|---|---|
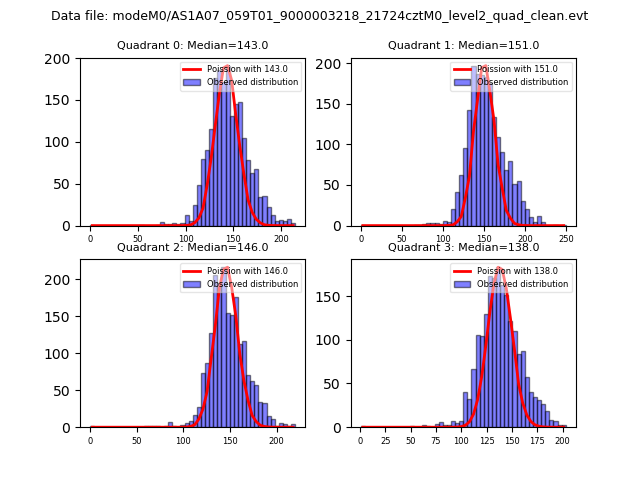
| Comparison with Poisson distribution Blue bars denote a histogram of data divided into 1 sec bins. Red curve is a Poisson curve with rate = median count rate of data. |
 |
 |
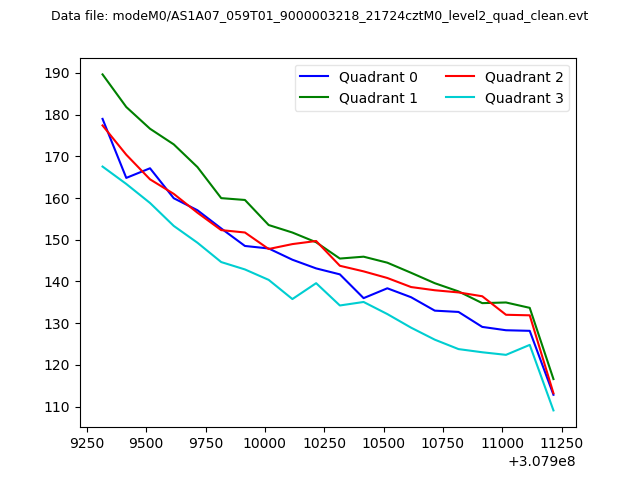
| Quadrant-wise count rates Data is divided into 100 sec bins |
 |
|
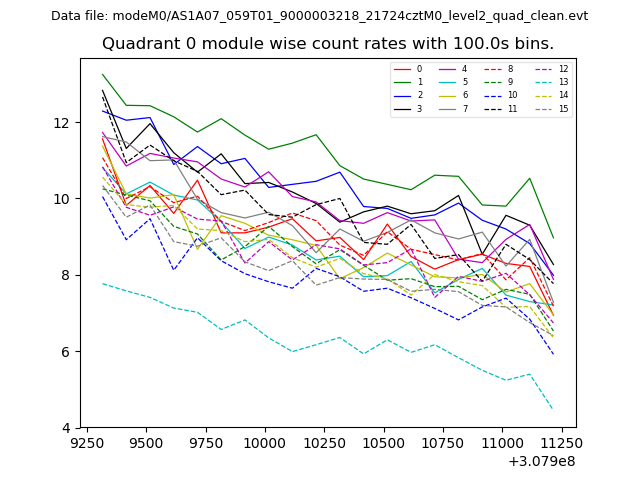
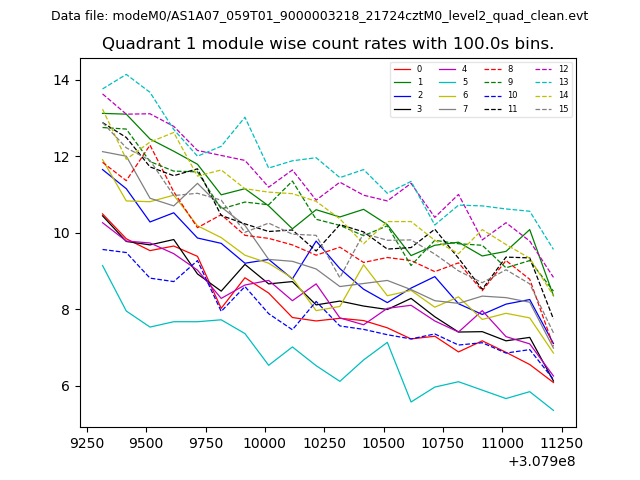
| Module-wise count rates for Quadrant A Data is divided into 100 sec bins |
 |
 |
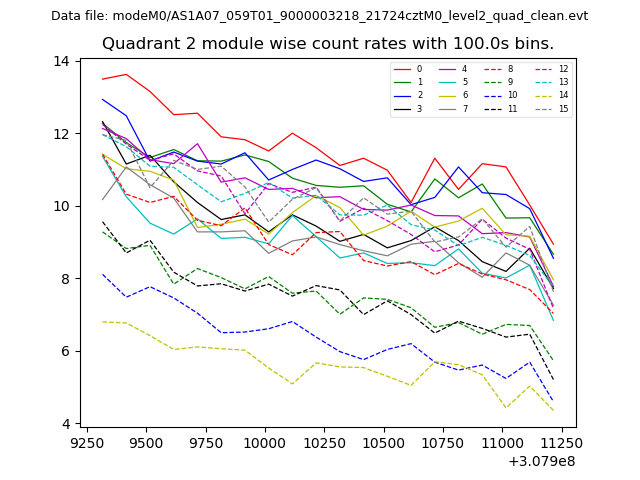
| Module-wise count rates for Quadrant B Data is divided into 100 sec bins |
 |
 |
| Module-wise count rates for Quadrant C Data is divided into 100 sec bins |
 |
 |
| Module-wise count rates for Quadrant D Data is divided into 100 sec bins |
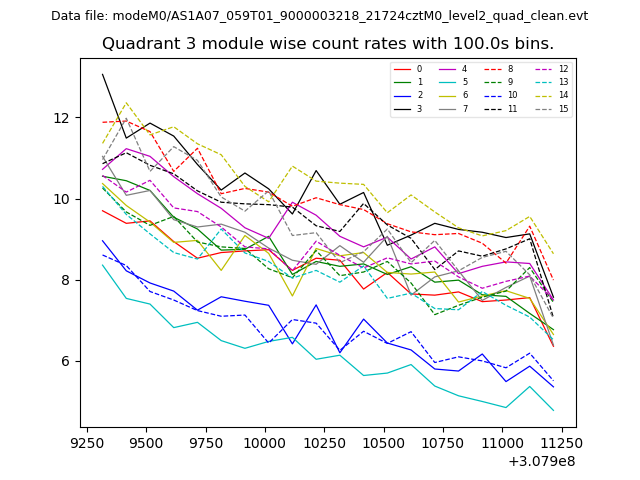 |
 |
| Parameter | Plot |
|---|---|
| CZT HV Monitor | 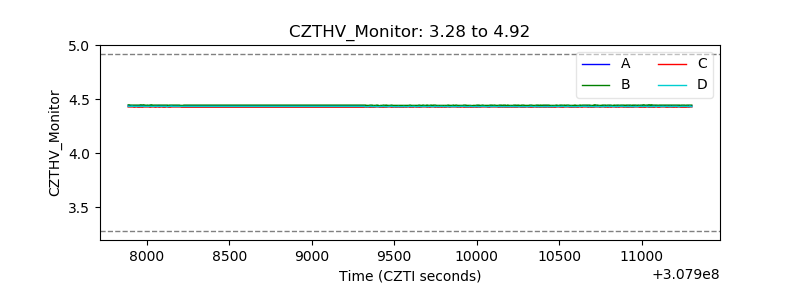 |
| D_VDD | 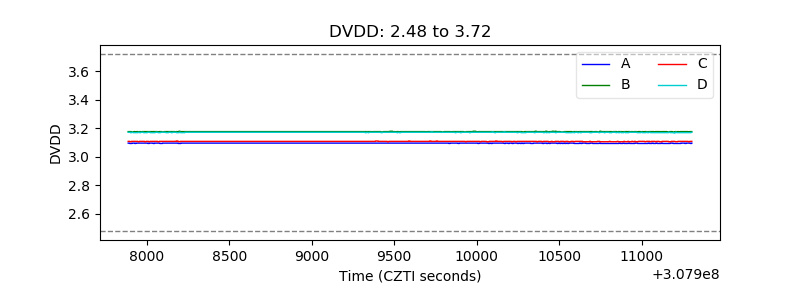 |
| Temperature 1 | 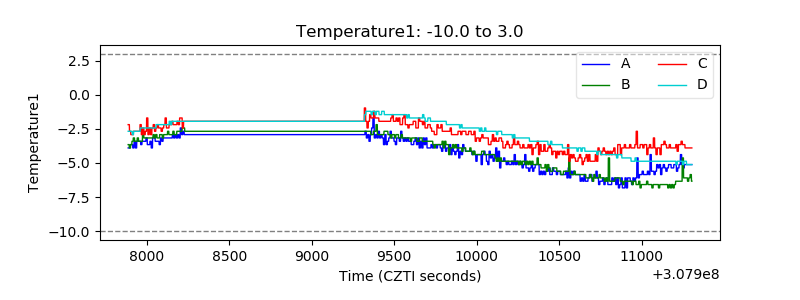 |
| Veto HV Monitor | 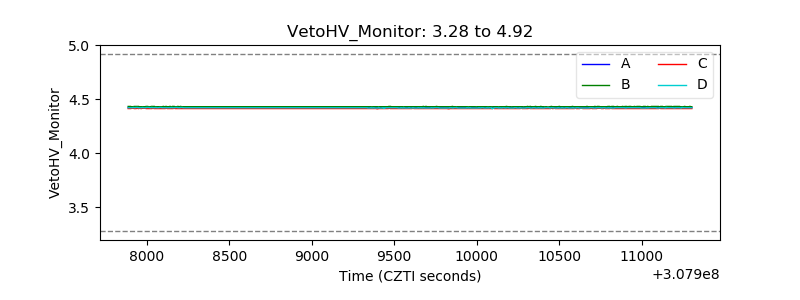 |
| Veto LLD | 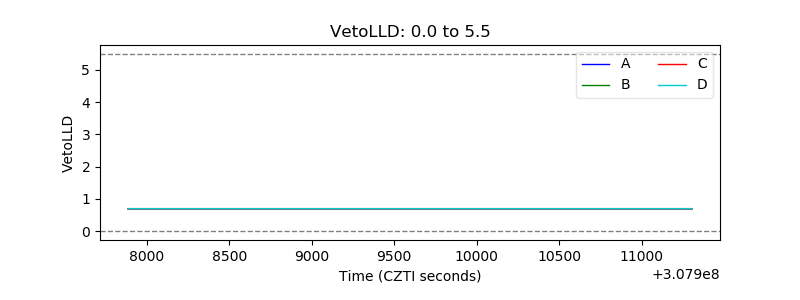 |
| Alpha Counter | 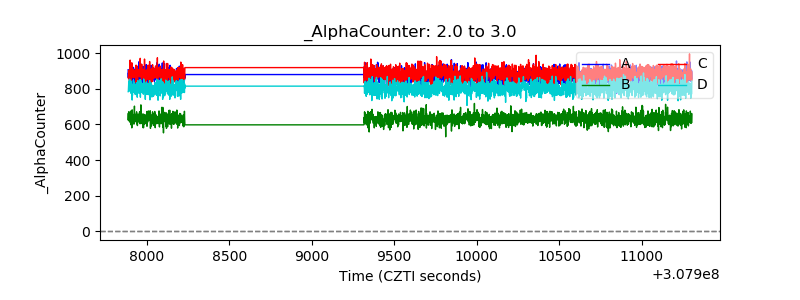 |
| _CPM_Rate | 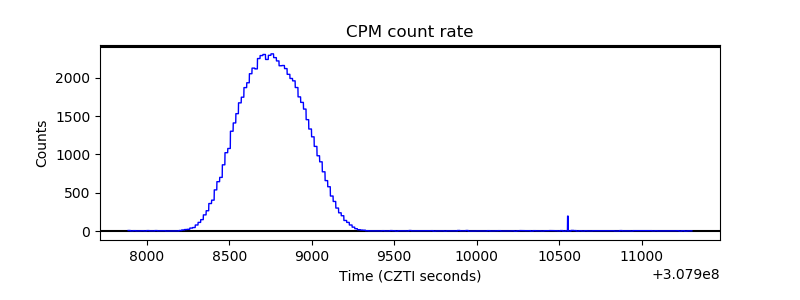 |
| CZT Counter | 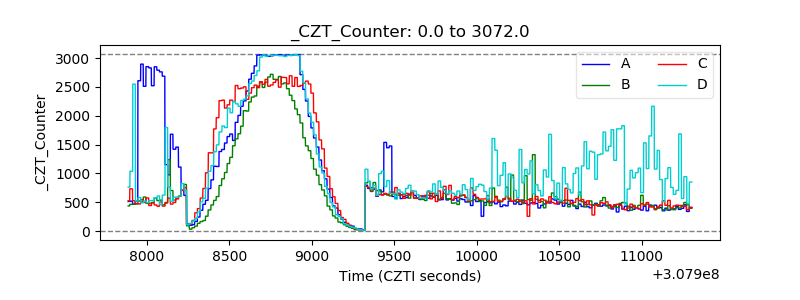 |
| +2.5 Volts monitor | 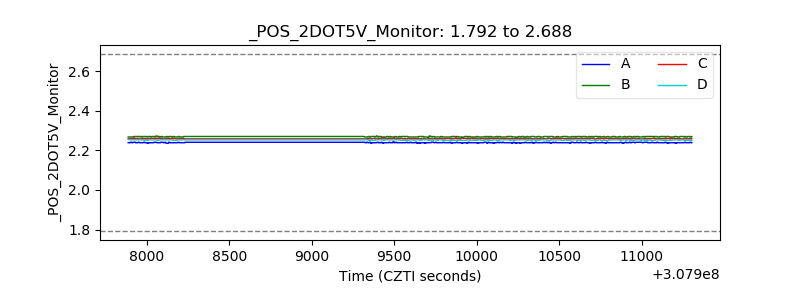 |
| +5 Volts monitor |  |
| _ROLL_ROT | 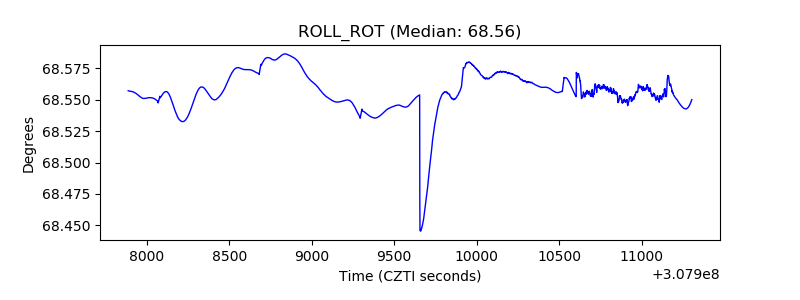 |
| _Roll_DEC | 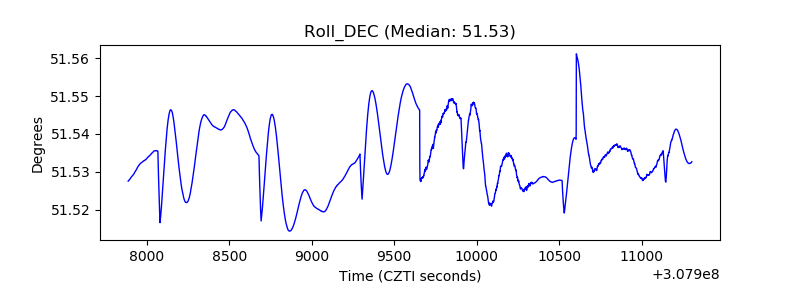 |
| _Roll_RA | 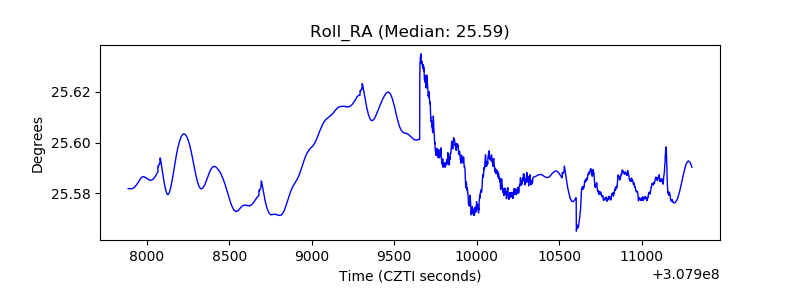 |
| Veto Counter | 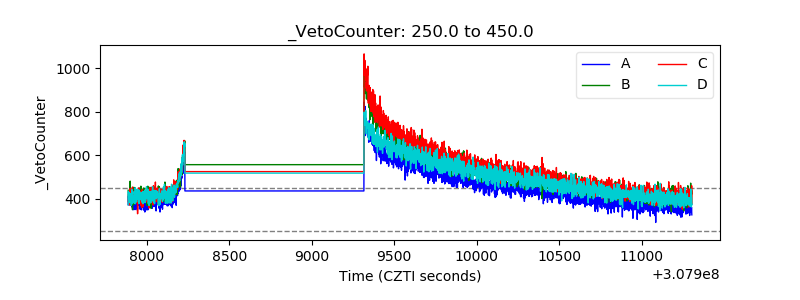 |