| Param | Original file | Final file |
|---|---|---|
| Filename | modeM0/AS1A07_005T01_9000003224cztM0_level2.fits | modeM0/AS1A07_005T01_9000003224cztM0_level2_quad_clean.evt |
| Size (bytes) | 2,152,782,720 | 2,036,263,680 |
| Size | 2.0 GB | 1.9 GB |
| Events in quadrant A | 13,742,890 | 12,990,255 |
| Events in quadrant B | 13,342,710 | 13,252,315 |
| Events in quadrant C | 13,643,574 | 12,442,257 |
| Events in quadrant D | 8,995,280 | 7,556,913 |
| Mode M9 | |||
|---|---|---|---|
| Quadrant | BADHDUFLAG | Total packets | Discarded packets |
| A | 0 | 379 | 0 |
| B | 0 | 379 | 0 |
| C | 0 | 379 | 0 |
| D | 0 | 379 | 0 |
| Mode M0 | |||
|---|---|---|---|
| Quadrant | BADHDUFLAG | Total packets | Discarded packets |
| A | 0 | 501088 | 0 |
| B | 0 | 507844 | 0 |
| C | 0 | 470436 | 0 |
| D | 0 | 1236966 | 0 |
| Mode SS | |||
|---|---|---|---|
| Quadrant | BADHDUFLAG | Total packets | Discarded packets |
| A | 0 | 4534 | 0 |
| B | 0 | 4596 | 0 |
| C | 0 | 4584 | 0 |
| D | 0 | 4588 | 0 |
| Quadrant | Total seconds | Saturated seconds | Saturation percentage |
|---|---|---|---|
| A | 225262 | 5559 | 2.467793% |
| B | 225240 | 4320 | 1.917954% |
| C | 225268 | 3225 | 1.431628% |
| D | 225223 | 98268 | 43.631423% |
Noise dominated data is calculated using 1-second bins in cleaned event files. If a bin has >2000 counts, and if more than 50% of those come from <1% of pixels, then it is considered to be noise-dominated and hence unusable.
| Quadrant | # 1 sec bins | Bins with >0 counts | Bins with >2000 counts | High rate bins dominated by noise | Noise dominated (total time) | Noise dominated (detector-on time) | Marked lightcurve |
|---|---|---|---|---|---|---|---|
| A | 290480 | 225509 | 0 | 0 | 0.00% | 0.00% |  |
| B | 290480 | 225468 | 0 | 0 | 0.00% | 0.00% |  |
| C | 290480 | 225538 | 0 | 0 | 0.00% | 0.00% |  |
| D | 290479 | 224832 | 0 | 0 | 0.00% | 0.00% |  |
Top three noisy pixels from each quadrant. If the there are fewer than three noisy pixels in the level2.evt file, extra rows are filled as -1
| Pixel properties | Quadrant properties | ||||||
|---|---|---|---|---|---|---|---|
| Quadrant | DetID | PixID | Counts | Sigma | Mean | Median | Sigma |
| A | 0 | 29 | 13011 | 11.26 | 3578 | 3363 | 857.2 |
| A | 7 | 110 | 11181 | 9.12 | 3578 | 3363 | 857.2 |
| A | 0 | 30 | 10441 | 8.26 | 3578 | 3363 | 857.2 |
| B | 2 | 9 | 10427 | 10.2 | 3535 | 3377 | 691.3 |
| B | 5 | 128 | 8924 | 8.02 | 3535 | 3377 | 691.3 |
| B | 3 | 17 | 8808 | 7.86 | 3535 | 3377 | 691.3 |
| C | 1 | 80 | 10635 | 7.91 | 3600 | 3366 | 919.0 |
| C | 1 | 81 | 10352 | 7.6 | 3600 | 3366 | 919.0 |
| C | 12 | 241 | 9381 | 6.55 | 3600 | 3366 | 919.0 |
| D | 6 | 231 | 6497 | 6.16 | 2571 | 2349 | 673.5 |
| D | 3 | 14 | 6362 | 5.96 | 2571 | 2349 | 673.5 |
| D | 10 | 189 | 6360 | 5.95 | 2571 | 2349 | 673.5 |
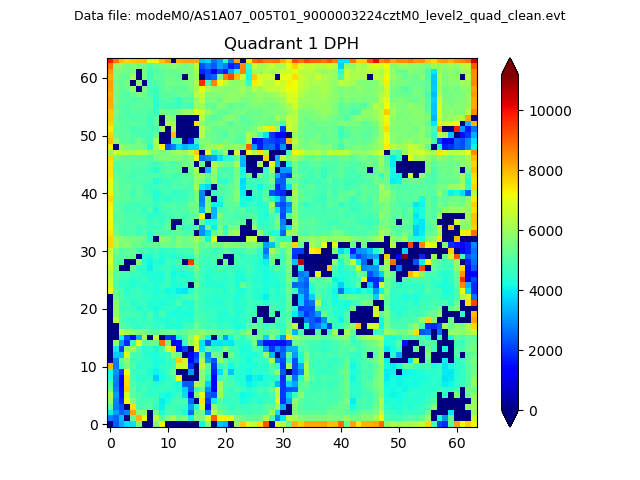
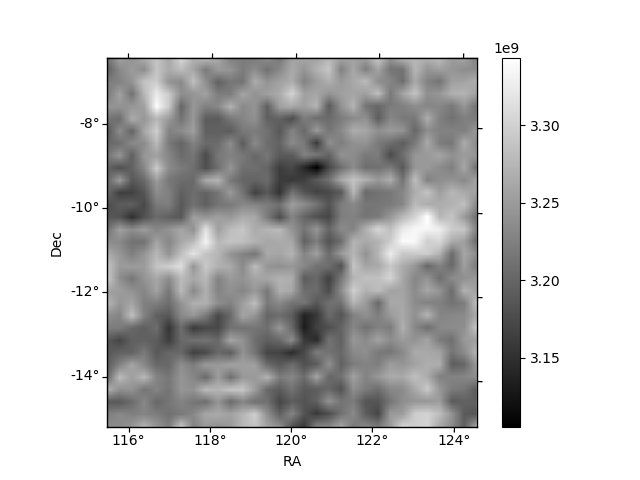
Histogram calculated using DETX and DETY for each event in the final _common_clean file
| Quadrant A |  |
 |
Quadrant B |
|---|---|---|---|
| Quadrant D |  |
 |
Quadrant C |
| Plot type | Count rate plots | Images |
|---|---|---|
| Comparison with Poisson distribution Blue bars denote a histogram of data divided into 1 sec bins. Red curve is a Poisson curve with rate = median count rate of data. |
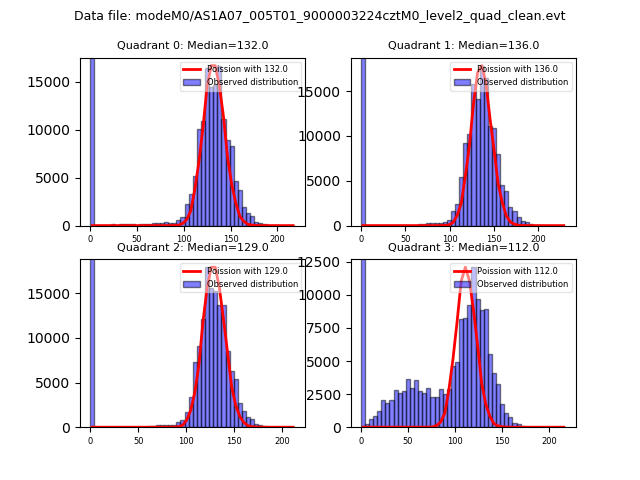 |
 |
| Quadrant-wise count rates Data is divided into 100 sec bins |
 |
|
| Module-wise count rates for Quadrant A Data is divided into 100 sec bins |
 |
 |
| Module-wise count rates for Quadrant B Data is divided into 100 sec bins |
 |
 |
| Module-wise count rates for Quadrant C Data is divided into 100 sec bins |
 |
 |
| Module-wise count rates for Quadrant D Data is divided into 100 sec bins |
 |
 |
| Parameter | Plot |
|---|---|
| CZT HV Monitor |  |
| D_VDD |  |
| Temperature 1 |  |
| Veto HV Monitor | 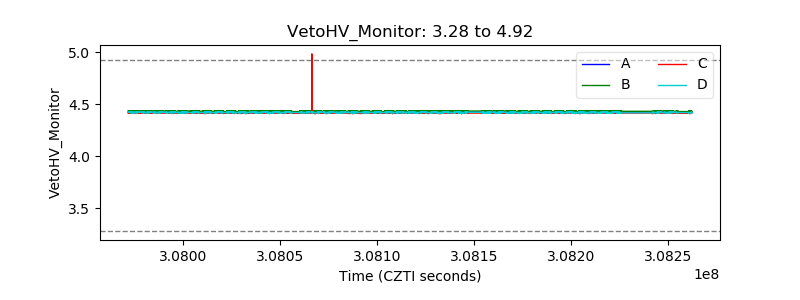 |
| Veto LLD | 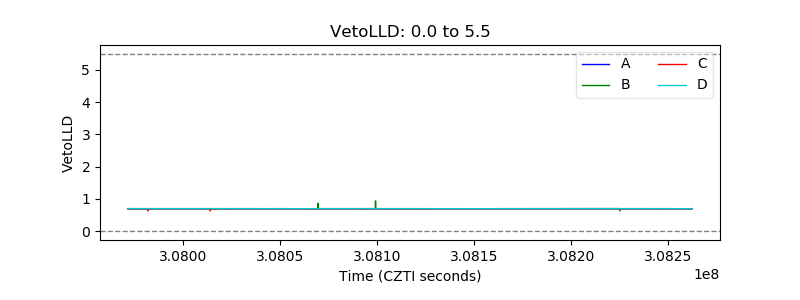 |
| Alpha Counter |  |
| _CPM_Rate | 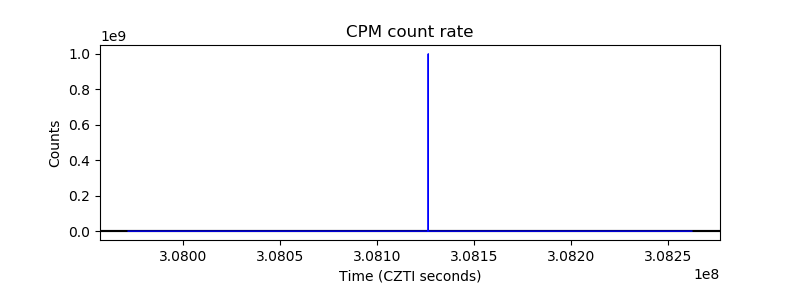 |
| CZT Counter |  |
| +2.5 Volts monitor |  |
| +5 Volts monitor |  |
| _ROLL_ROT |  |
| _Roll_DEC |  |
| _Roll_RA |  |
| Veto Counter |  |