| Param | Original file | Final file |
|---|---|---|
| Filename | modeM0/AS1A07_005T01_9000003224_21735cztM0_level2.evt | modeM0/AS1A07_005T01_9000003224_21735cztM0_level2_quad_clean.evt |
| Size (bytes) | 986,834,880 | 135,616,320 |
| Size | 941.1 MB | 129.3 MB |
| Events in quadrant A | 7,699,584 | 779,353 |
| Events in quadrant B | 6,447,141 | 857,306 |
| Events in quadrant C | 5,941,547 | 813,265 |
| Events in quadrant D | 8,955,286 | 794,820 |
| Mode M9 | |||
|---|---|---|---|
| Quadrant | BADHDUFLAG | Total packets | Discarded packets |
| A | 0 | 21 | 0 |
| B | 0 | 21 | 0 |
| C | 0 | 21 | 0 |
| D | 0 | 21 | 0 |
| Mode M0 | |||
|---|---|---|---|
| Quadrant | BADHDUFLAG | Total packets | Discarded packets |
| A | 0 | 30825 | 3 |
| B | 0 | 26821 | 3 |
| C | 0 | 25474 | 3 |
| D | 0 | 34936 | 3 |
| Mode SS | |||
|---|---|---|---|
| Quadrant | BADHDUFLAG | Total packets | Discarded packets |
| A | 0 | 254 | 0 |
| B | 0 | 254 | 0 |
| C | 0 | 254 | 0 |
| D | 0 | 254 | 0 |
| Quadrant | Total seconds | Saturated seconds | Saturation percentage |
|---|---|---|---|
| A | 12471 | 786 | 6.302622% |
| B | 12471 | 149 | 1.194772% |
| C | 12471 | 148 | 1.186753% |
| D | 12470 | 627 | 5.028067% |
Noise dominated data is calculated using 1-second bins in cleaned event files. If a bin has >2000 counts, and if more than 50% of those come from <1% of pixels, then it is considered to be noise-dominated and hence unusable.
| Quadrant | # 1 sec bins | Bins with >0 counts | Bins with >2000 counts | High rate bins dominated by noise | Noise dominated (total time) | Noise dominated (detector-on time) | Marked lightcurve |
|---|---|---|---|---|---|---|---|
| A | 14021 | 12472 | 699 | 699 | 4.99% | 5.60% | 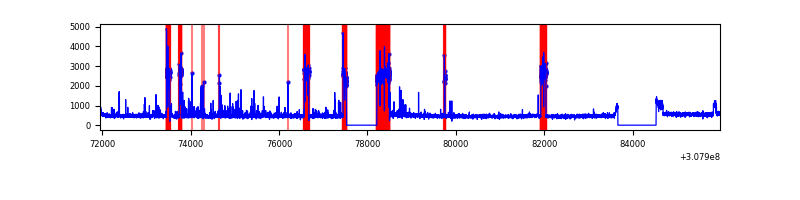 |
| B | 14021 | 12473 | 18 | 18 | 0.13% | 0.14% | 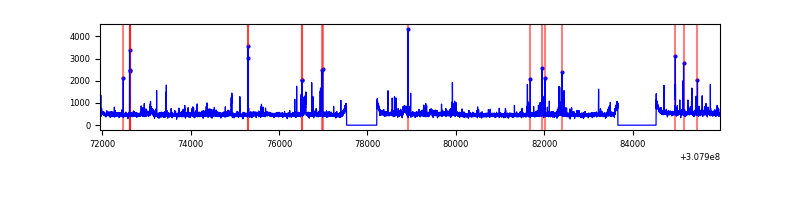 |
| C | 14021 | 12473 | 0 | 0 | 0.00% | 0.00% | 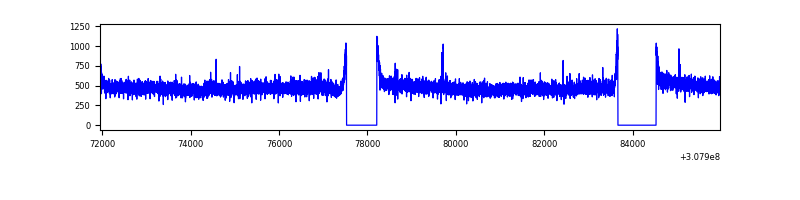 |
| D | 14020 | 12472 | 433 | 433 | 3.09% | 3.47% | 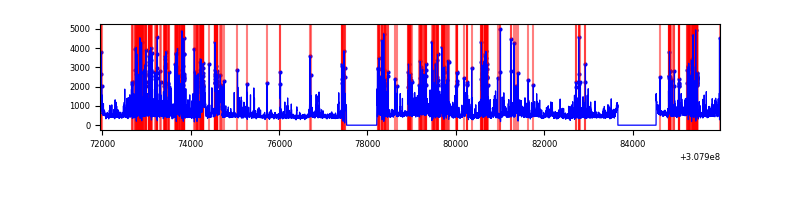 |
Top three noisy pixels from each quadrant. If the there are fewer than three noisy pixels in the level2.evt file, extra rows are filled as -1
| Pixel properties | Quadrant properties | ||||||
|---|---|---|---|---|---|---|---|
| Quadrant | DetID | PixID | Counts | Sigma | Mean | Median | Sigma |
| A | 15 | 236 | 1896525 | 6473.57 | 1451 | 1417 | 292.7 |
| A | 6 | 16 | 158088 | 535.18 | 1451 | 1417 | 292.7 |
| A | 5 | 16 | 52032 | 172.9 | 1451 | 1417 | 292.7 |
| B | 3 | 64 | 186989 | 640.03 | 1517 | 1477 | 289.8 |
| B | 0 | 230 | 145025 | 495.25 | 1517 | 1477 | 289.8 |
| B | 0 | 190 | 66561 | 224.55 | 1517 | 1477 | 289.8 |
| C | 14 | 238 | 229287 | 663.2 | 1463 | 1471 | 343.5 |
| C | 13 | 61 | 10167 | 25.32 | 1463 | 1471 | 343.5 |
| C | 10 | 23 | 8385 | 20.13 | 1463 | 1471 | 343.5 |
| D | 7 | 238 | 1291272 | 3609.77 | 1462 | 1420 | 357.3 |
| D | 12 | 235 | 1276603 | 3568.71 | 1462 | 1420 | 357.3 |
| D | 1 | 52 | 344841 | 961.09 | 1462 | 1420 | 357.3 |
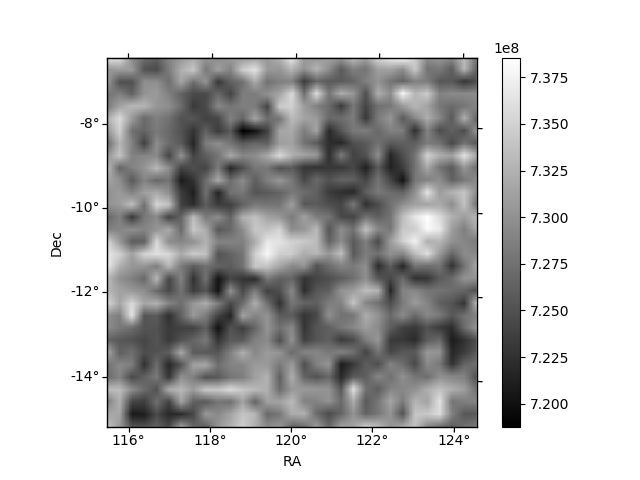
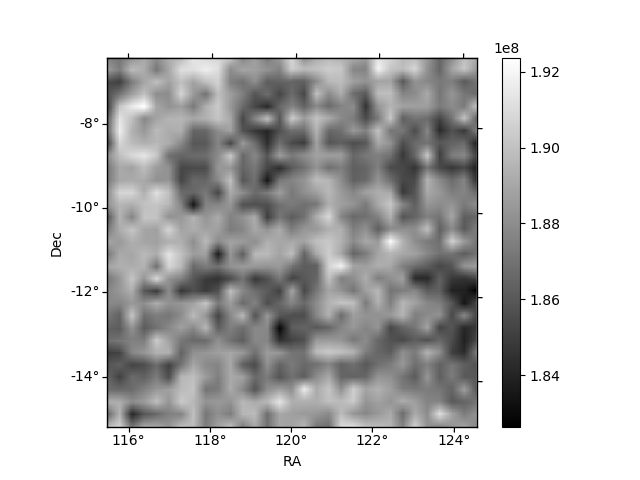
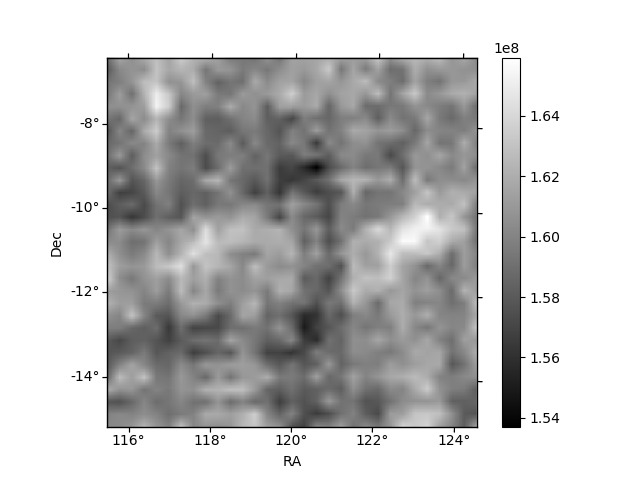
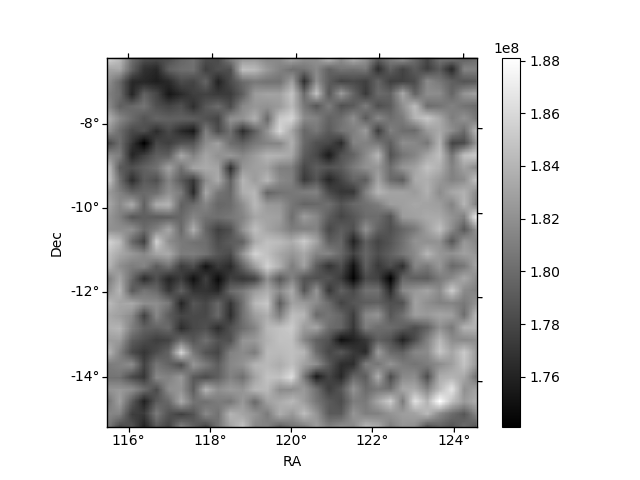
Histogram calculated using DETX and DETY for each event in the final _common_clean file
| Quadrant A | 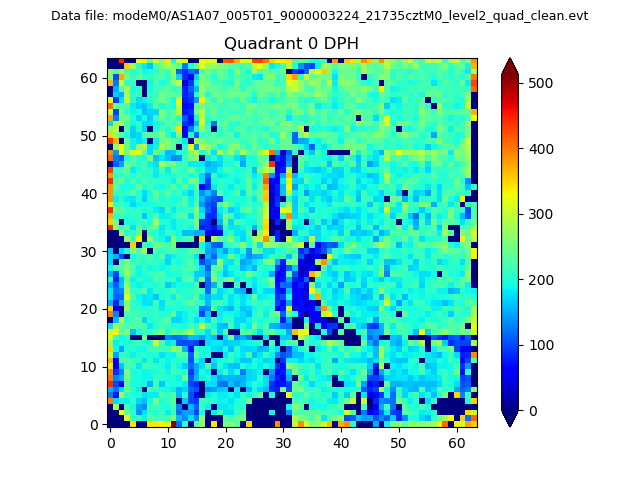 |
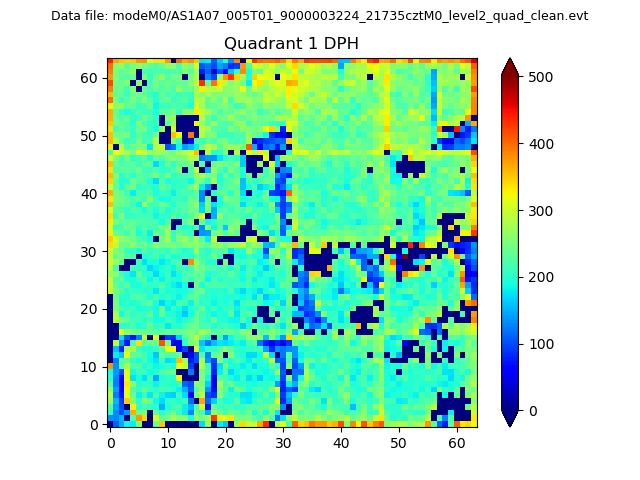 |
Quadrant B |
|---|---|---|---|
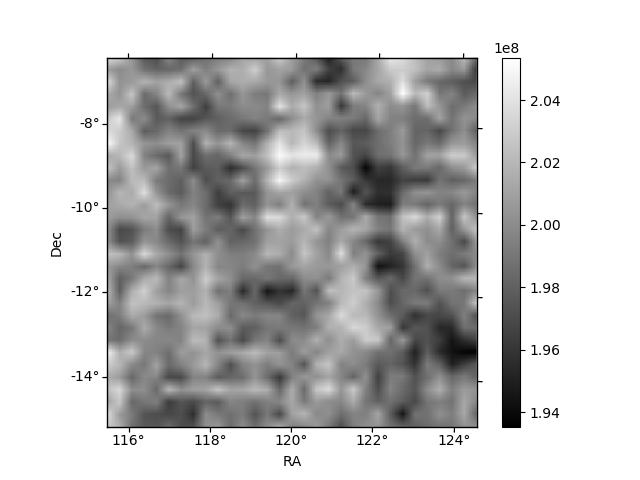
| Quadrant D | 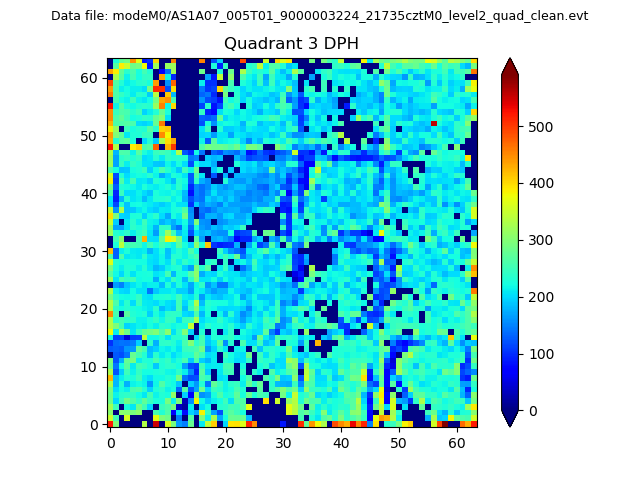 |
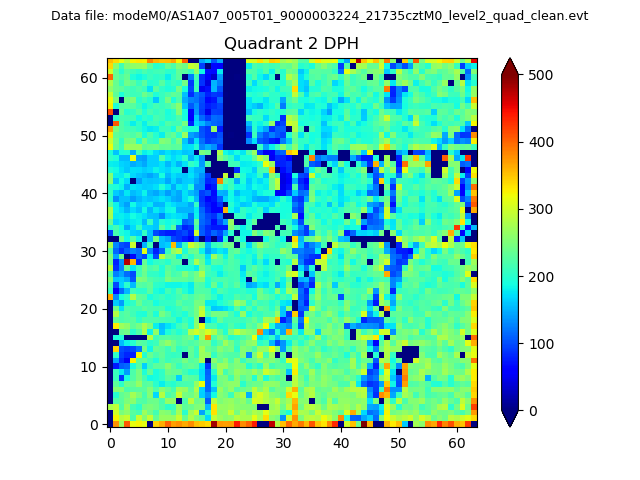 |
Quadrant C |
| Plot type | Count rate plots | Images |
|---|---|---|
| Comparison with Poisson distribution Blue bars denote a histogram of data divided into 1 sec bins. Red curve is a Poisson curve with rate = median count rate of data. |
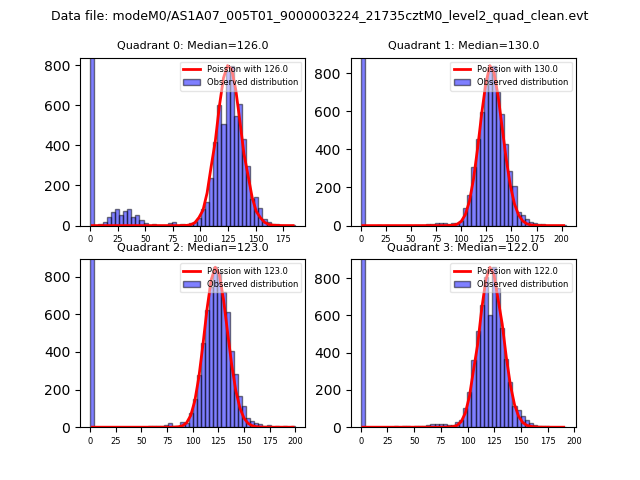 |
 |
| Quadrant-wise count rates Data is divided into 100 sec bins |
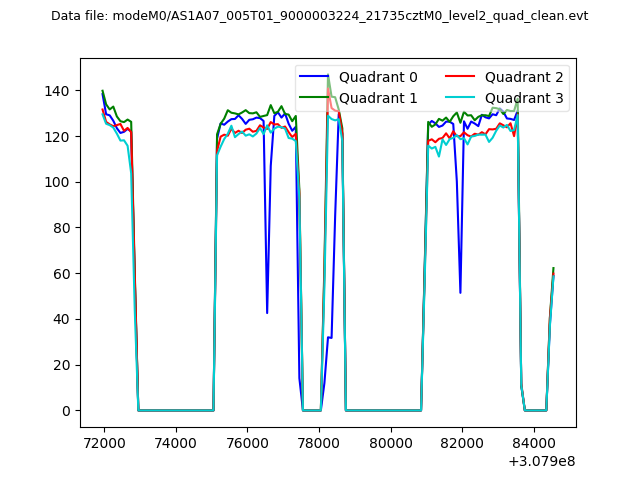 |
|
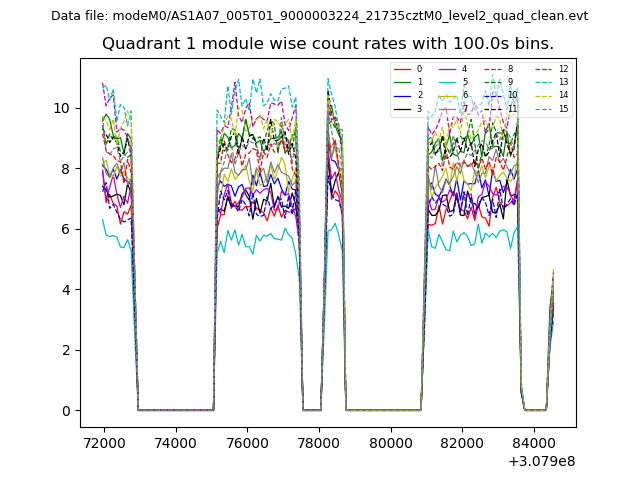
| Module-wise count rates for Quadrant A Data is divided into 100 sec bins |
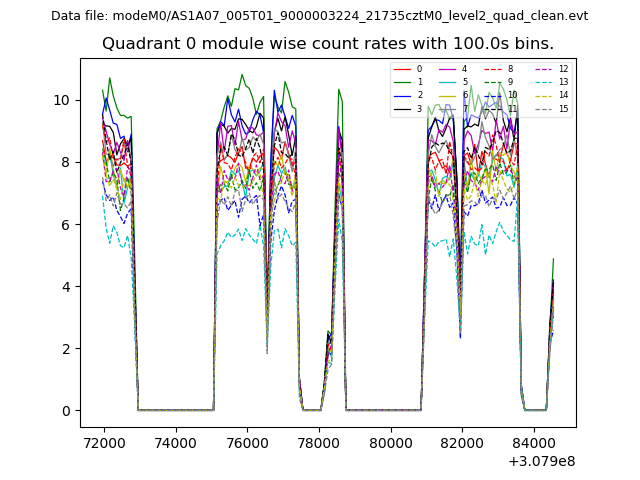 |
 |
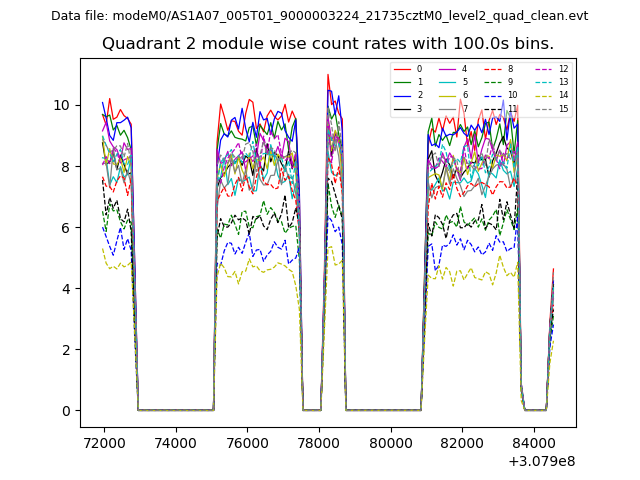
| Module-wise count rates for Quadrant B Data is divided into 100 sec bins |
 |
 |
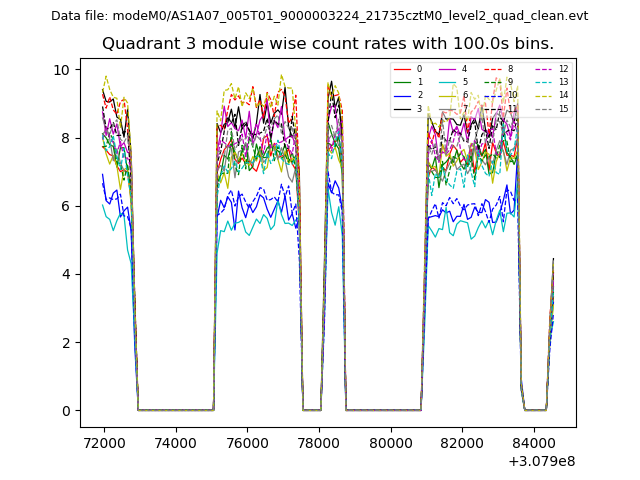
| Module-wise count rates for Quadrant C Data is divided into 100 sec bins |
 |
 |
| Module-wise count rates for Quadrant D Data is divided into 100 sec bins |
 |
 |
| Parameter | Plot |
|---|---|
| CZT HV Monitor | 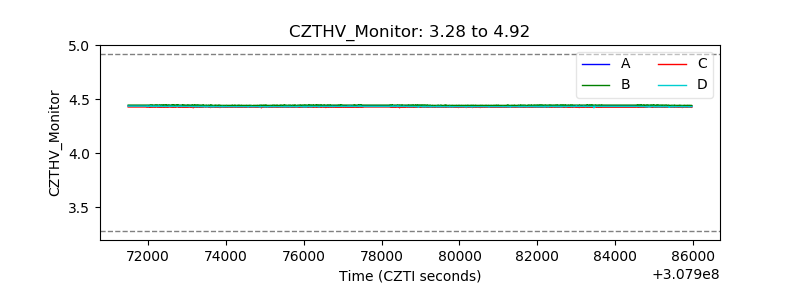 |
| D_VDD | 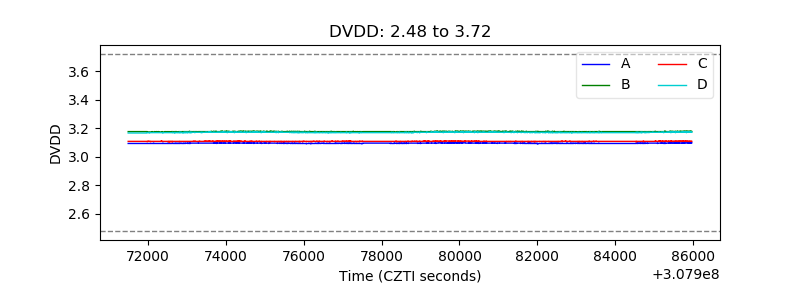 |
| Temperature 1 | 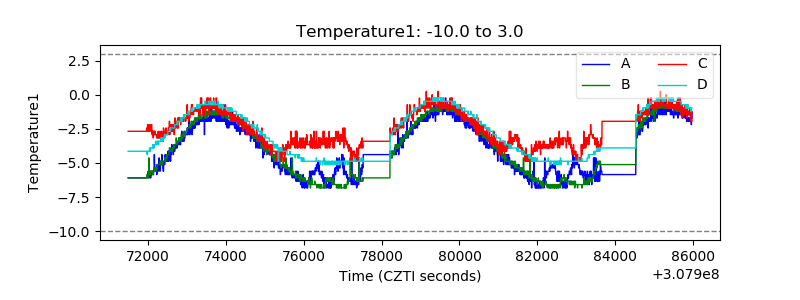 |
| Veto HV Monitor | 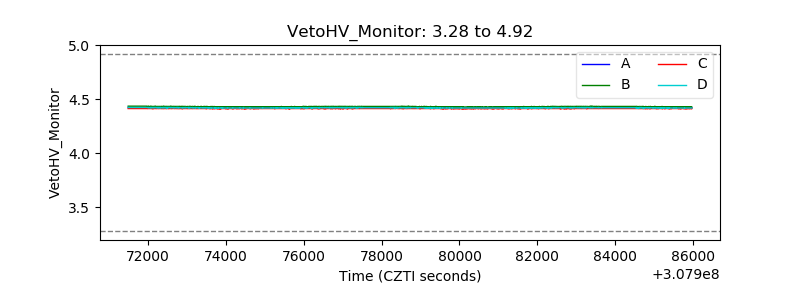 |
| Veto LLD | 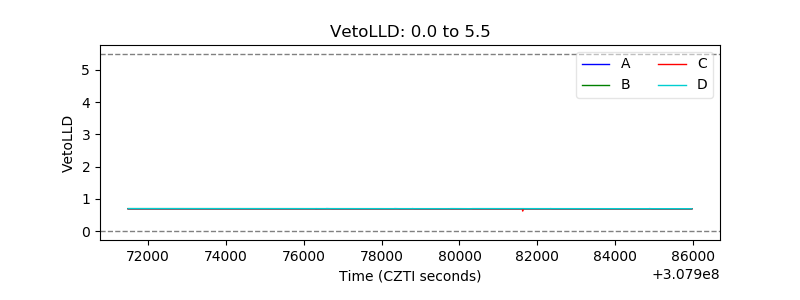 |
| Alpha Counter | 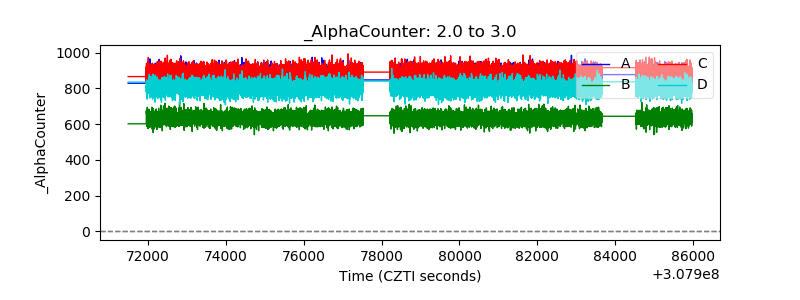 |
| _CPM_Rate | 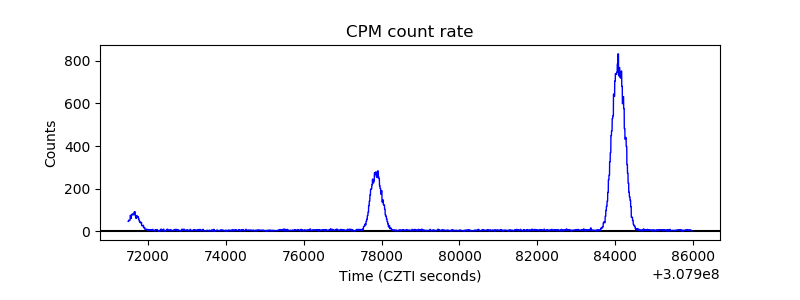 |
| CZT Counter | 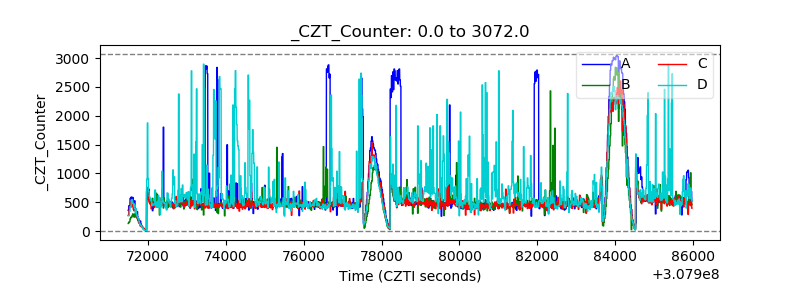 |
| +2.5 Volts monitor |  |
| +5 Volts monitor |  |
| _ROLL_ROT | 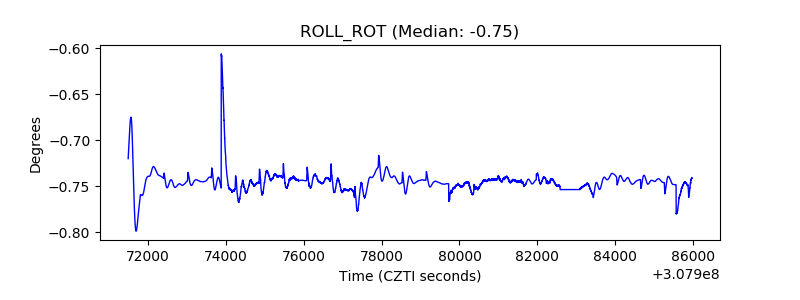 |
| _Roll_DEC | 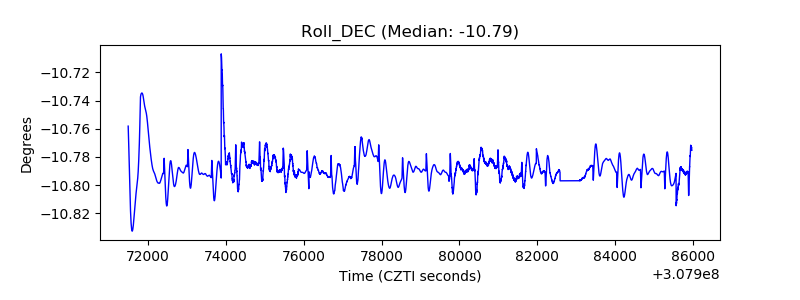 |
| _Roll_RA | 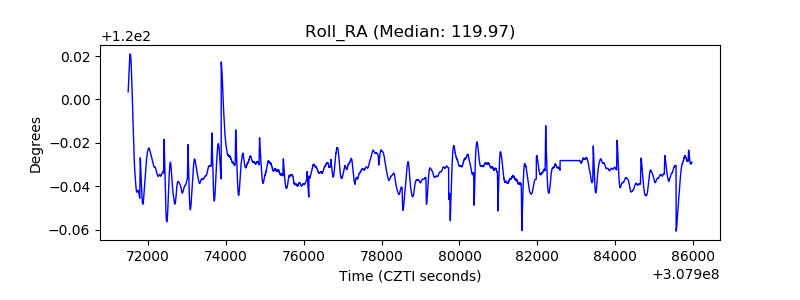 |
| Veto Counter | 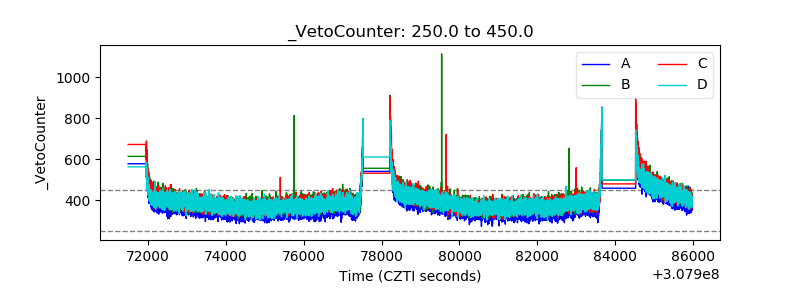 |