| Param | Original file | Final file |
|---|---|---|
| Filename | modeM0/AS1A07_005T01_9000003224_21736cztM0_level2.evt | modeM0/AS1A07_005T01_9000003224_21736cztM0_level2_quad_clean.evt |
| Size (bytes) | 517,780,800 | 63,031,680 |
| Size | 493.8 MB | 60.1 MB |
| Events in quadrant A | 4,164,279 | 355,526 |
| Events in quadrant B | 3,754,988 | 377,349 |
| Events in quadrant C | 3,188,605 | 363,926 |
| Events in quadrant D | 4,133,694 | 359,566 |
| Mode M9 | |||
|---|---|---|---|
| Quadrant | BADHDUFLAG | Total packets | Discarded packets |
| A | 0 | 10 | 0 |
| B | 0 | 10 | 0 |
| C | 0 | 10 | 0 |
| D | 0 | 10 | 0 |
| Mode M0 | |||
|---|---|---|---|
| Quadrant | BADHDUFLAG | Total packets | Discarded packets |
| A | 0 | 16355 | 1 |
| B | 0 | 15276 | 1 |
| C | 0 | 13517 | 2 |
| D | 0 | 16669 | 1 |
| Mode SS | |||
|---|---|---|---|
| Quadrant | BADHDUFLAG | Total packets | Discarded packets |
| A | 0 | 132 | 0 |
| B | 0 | 132 | 0 |
| C | 0 | 132 | 0 |
| D | 0 | 132 | 0 |
| Quadrant | Total seconds | Saturated seconds | Saturation percentage |
|---|---|---|---|
| A | 6474 | 389 | 6.008650% |
| B | 6475 | 200 | 3.088803% |
| C | 6474 | 91 | 1.405622% |
| D | 6474 | 219 | 3.382762% |
Noise dominated data is calculated using 1-second bins in cleaned event files. If a bin has >2000 counts, and if more than 50% of those come from <1% of pixels, then it is considered to be noise-dominated and hence unusable.
| Quadrant | # 1 sec bins | Bins with >0 counts | Bins with >2000 counts | High rate bins dominated by noise | Noise dominated (total time) | Noise dominated (detector-on time) | Marked lightcurve |
|---|---|---|---|---|---|---|---|
| A | 7484 | 6474 | 307 | 307 | 4.10% | 4.74% | 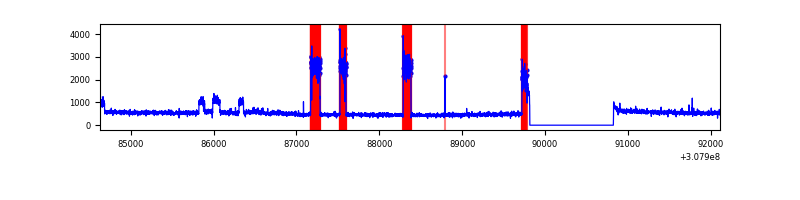 |
| B | 7485 | 6475 | 108 | 108 | 1.44% | 1.67% | 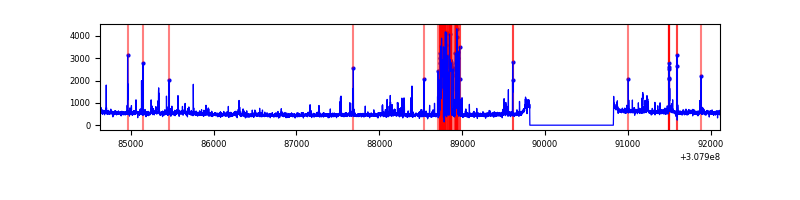 |
| C | 7484 | 6475 | 0 | 0 | 0.00% | 0.00% | 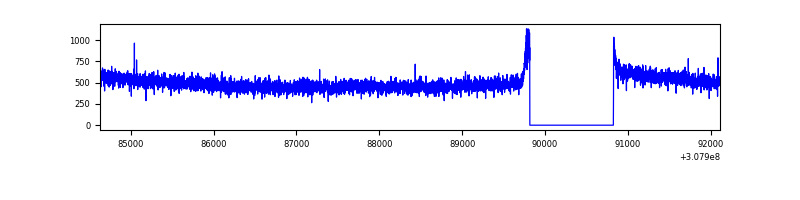 |
| D | 7484 | 6475 | 121 | 121 | 1.62% | 1.87% | 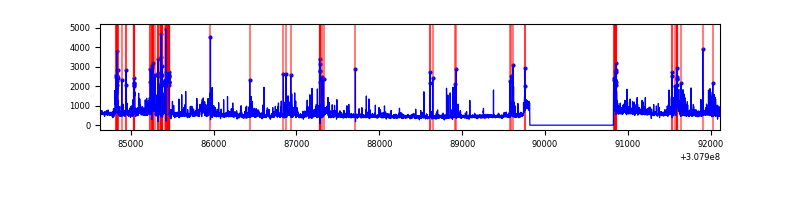 |
Top three noisy pixels from each quadrant. If the there are fewer than three noisy pixels in the level2.evt file, extra rows are filled as -1
| Pixel properties | Quadrant properties | ||||||
|---|---|---|---|---|---|---|---|
| Quadrant | DetID | PixID | Counts | Sigma | Mean | Median | Sigma |
| A | 15 | 236 | 1086122 | 6731.97 | 798 | 780 | 161.2 |
| A | 13 | 254 | 11197 | 64.61 | 798 | 780 | 161.2 |
| A | 0 | 226 | 6879 | 37.83 | 798 | 780 | 161.2 |
| B | 3 | 64 | 395754 | 2553.1 | 811 | 792 | 154.7 |
| B | 0 | 190 | 53645 | 341.65 | 811 | 792 | 154.7 |
| B | 0 | 230 | 38728 | 245.22 | 811 | 792 | 154.7 |
| C | 14 | 238 | 125685 | 679.27 | 785 | 789 | 183.9 |
| C | 13 | 61 | 5484 | 25.53 | 785 | 789 | 183.9 |
| C | 14 | 111 | 1964 | 6.39 | 785 | 789 | 183.9 |
| D | 12 | 235 | 322744 | 1651.04 | 794 | 769 | 195.0 |
| D | 7 | 238 | 276773 | 1415.31 | 794 | 769 | 195.0 |
| D | 1 | 52 | 212526 | 1085.86 | 794 | 769 | 195.0 |
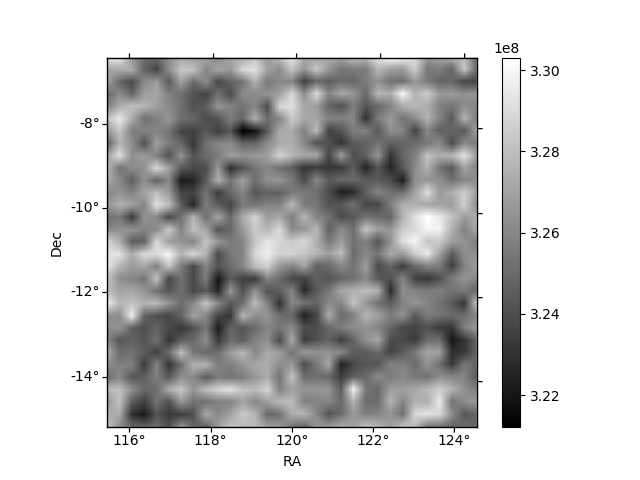
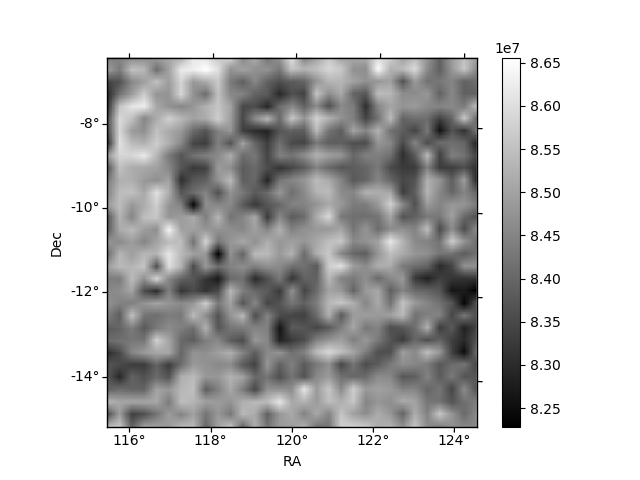
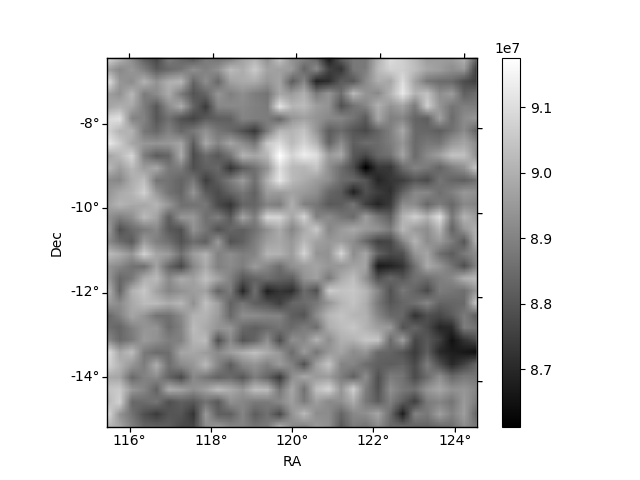
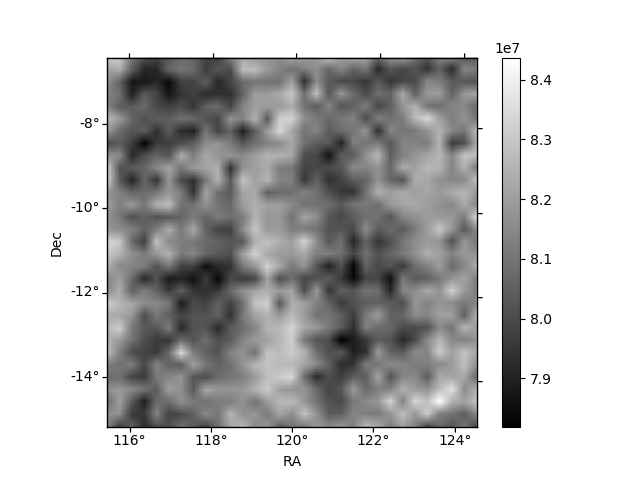
Histogram calculated using DETX and DETY for each event in the final _common_clean file
| Quadrant A | 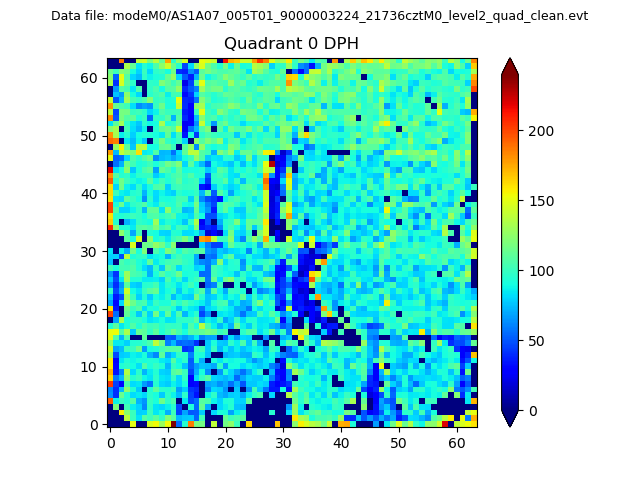 |
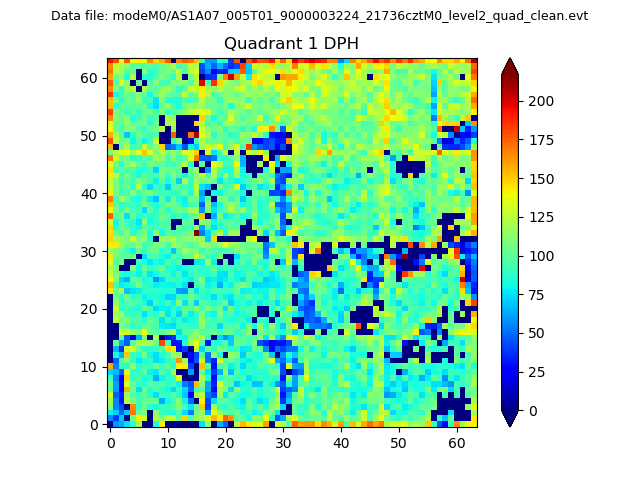 |
Quadrant B |
|---|---|---|---|
| Quadrant D | 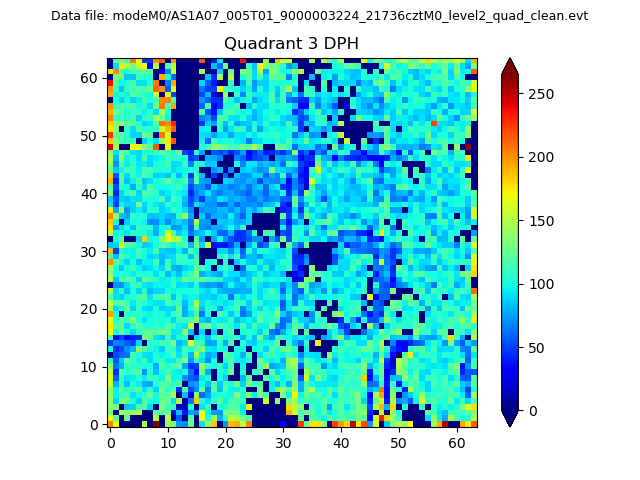 |
 |
Quadrant C |
| Plot type | Count rate plots | Images |
|---|---|---|
| Comparison with Poisson distribution Blue bars denote a histogram of data divided into 1 sec bins. Red curve is a Poisson curve with rate = median count rate of data. |
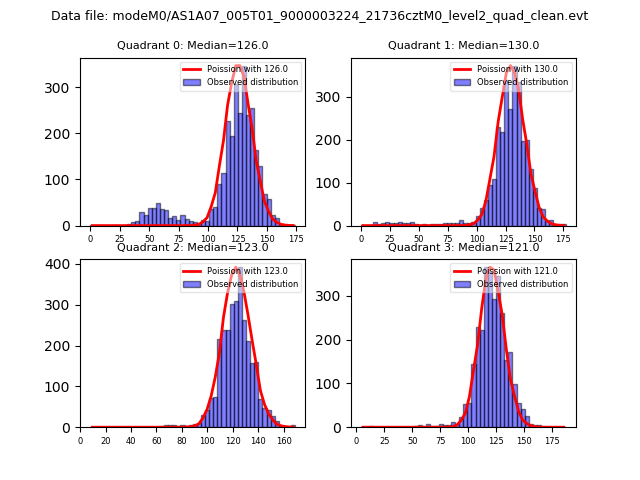 |
 |
| Quadrant-wise count rates Data is divided into 100 sec bins |
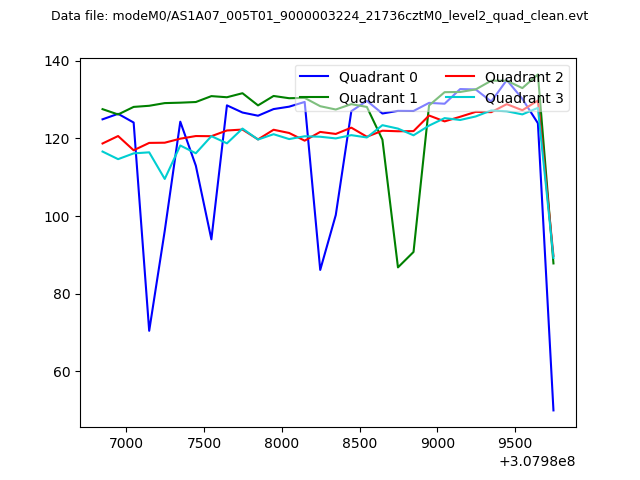 |
|
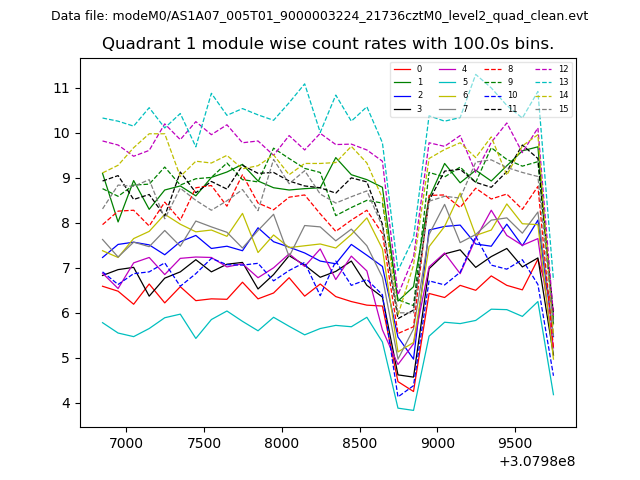
| Module-wise count rates for Quadrant A Data is divided into 100 sec bins |
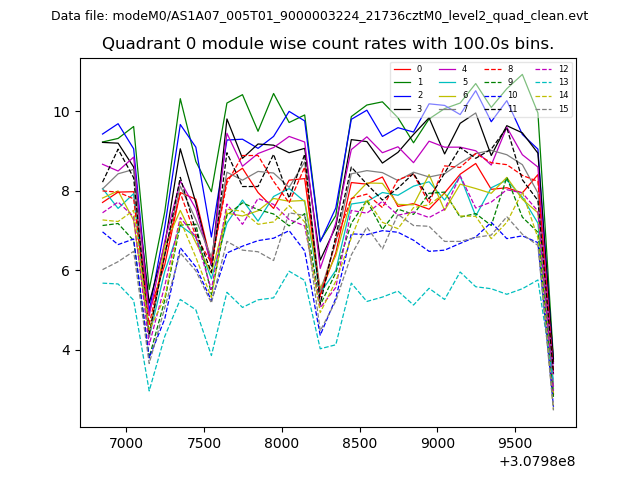 |
 |
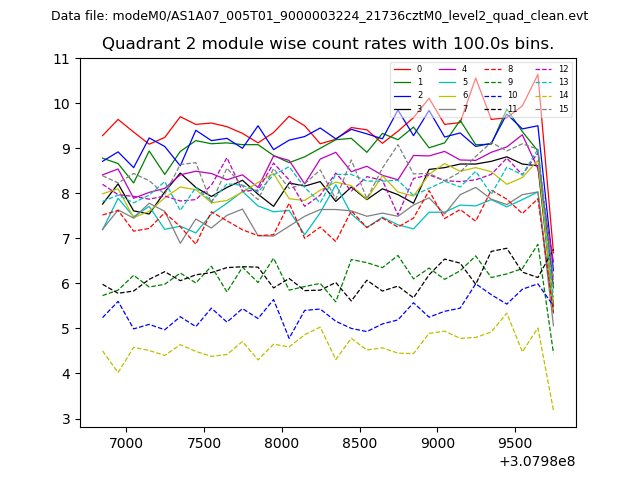
| Module-wise count rates for Quadrant B Data is divided into 100 sec bins |
 |
 |
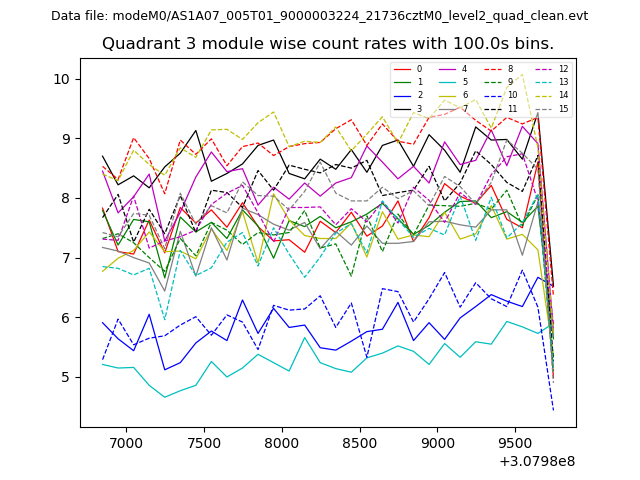
| Module-wise count rates for Quadrant C Data is divided into 100 sec bins |
 |
 |
| Module-wise count rates for Quadrant D Data is divided into 100 sec bins |
 |
 |
| Parameter | Plot |
|---|---|
| CZT HV Monitor | 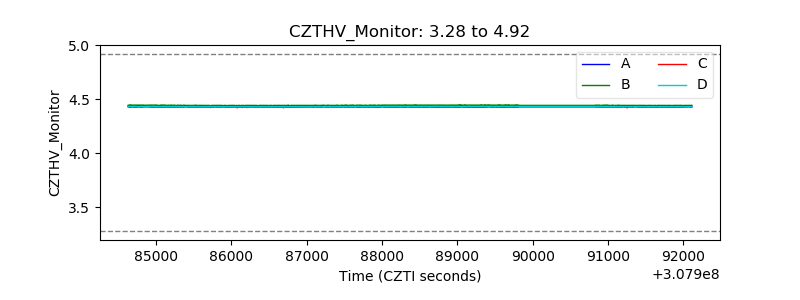 |
| D_VDD | 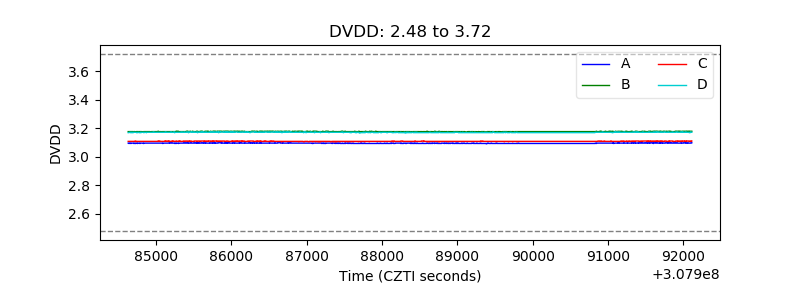 |
| Temperature 1 | 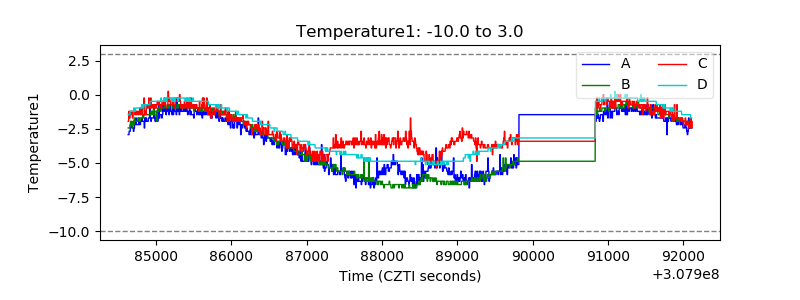 |
| Veto HV Monitor |  |
| Veto LLD | 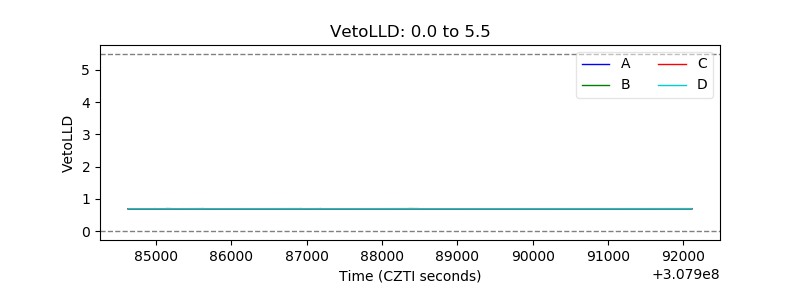 |
| Alpha Counter | 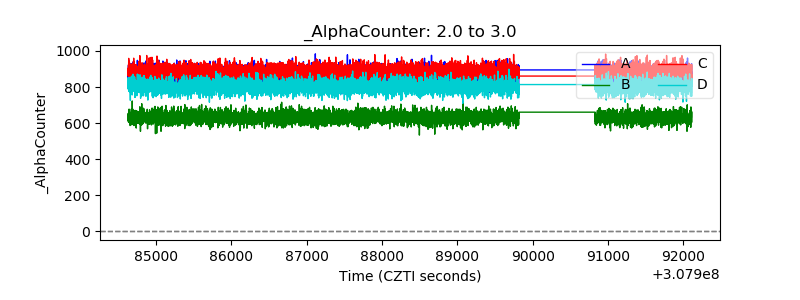 |
| _CPM_Rate | 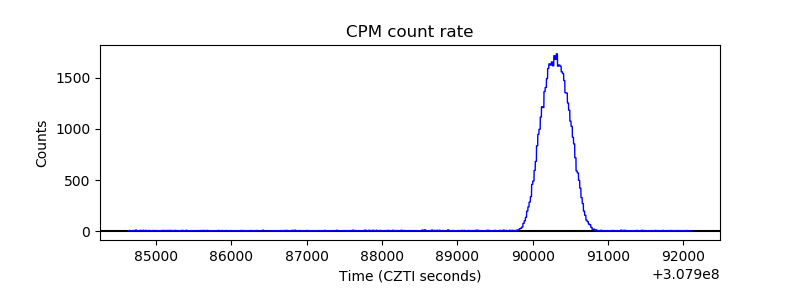 |
| CZT Counter |  |
| +2.5 Volts monitor |  |
| +5 Volts monitor |  |
| _ROLL_ROT | 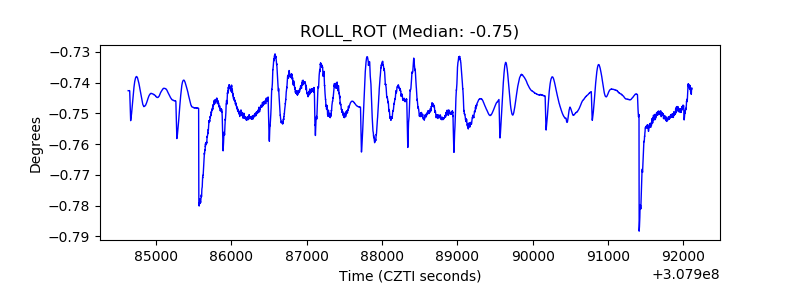 |
| _Roll_DEC | 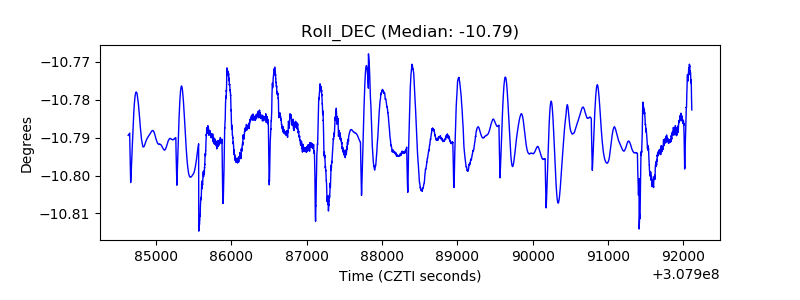 |
| _Roll_RA |  |
| Veto Counter | 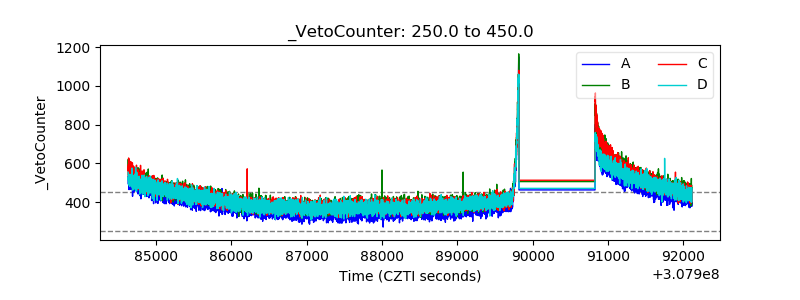 |