| Param | Original file | Final file |
|---|---|---|
| Filename | modeM0/AS1A07_005T01_9000003224_21738cztM0_level2.evt | modeM0/AS1A07_005T01_9000003224_21738cztM0_level2_quad_clean.evt |
| Size (bytes) | 532,224,000 | 70,704,000 |
| Size | 507.6 MB | 67.4 MB |
| Events in quadrant A | 3,513,254 | 432,168 |
| Events in quadrant B | 3,525,327 | 440,814 |
| Events in quadrant C | 3,297,453 | 415,509 |
| Events in quadrant D | 5,347,771 | 405,021 |
| Mode M9 | |||
|---|---|---|---|
| Quadrant | BADHDUFLAG | Total packets | Discarded packets |
| A | 0 | 20 | 0 |
| B | 0 | 21 | 0 |
| C | 0 | 21 | 0 |
| D | 0 | 21 | 0 |
| Mode M0 | |||
|---|---|---|---|
| Quadrant | BADHDUFLAG | Total packets | Discarded packets |
| A | 0 | 14732 | 2 |
| B | 0 | 14666 | 2 |
| C | 0 | 13896 | 2 |
| D | 0 | 20295 | 3 |
| Mode SS | |||
|---|---|---|---|
| Quadrant | BADHDUFLAG | Total packets | Discarded packets |
| A | 0 | 128 | 0 |
| B | 0 | 128 | 0 |
| C | 0 | 128 | 0 |
| D | 0 | 128 | 0 |
| Quadrant | Total seconds | Saturated seconds | Saturation percentage |
|---|---|---|---|
| A | 6420 | 69 | 1.074766% |
| B | 6420 | 110 | 1.713396% |
| C | 6420 | 113 | 1.760125% |
| D | 6419 | 432 | 6.730020% |
Noise dominated data is calculated using 1-second bins in cleaned event files. If a bin has >2000 counts, and if more than 50% of those come from <1% of pixels, then it is considered to be noise-dominated and hence unusable.
| Quadrant | # 1 sec bins | Bins with >0 counts | Bins with >2000 counts | High rate bins dominated by noise | Noise dominated (total time) | Noise dominated (detector-on time) | Marked lightcurve |
|---|---|---|---|---|---|---|---|
| A | 7545 | 6420 | 0 | 0 | 0.00% | 0.00% | 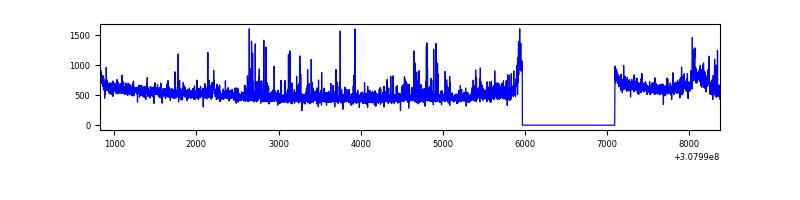 |
| B | 7545 | 6420 | 15 | 15 | 0.20% | 0.23% | 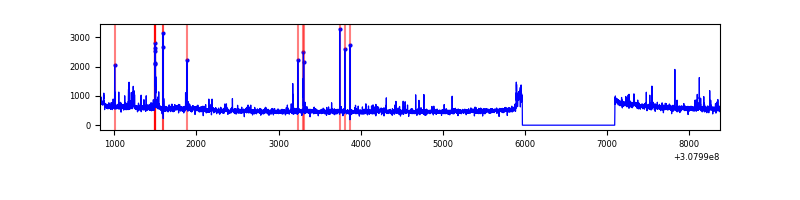 |
| C | 7545 | 6421 | 0 | 0 | 0.00% | 0.00% | 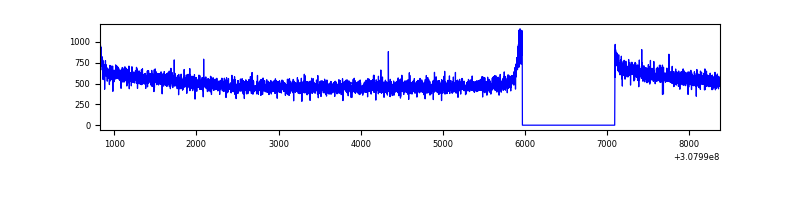 |
| D | 7544 | 6419 | 284 | 284 | 3.76% | 4.42% | 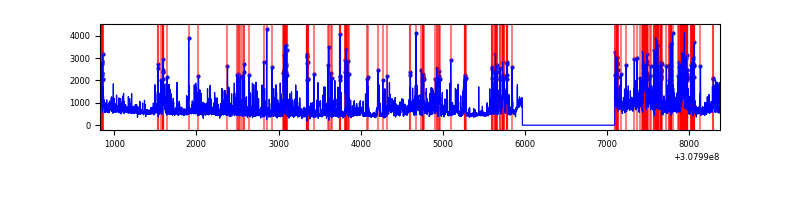 |
Top three noisy pixels from each quadrant. If the there are fewer than three noisy pixels in the level2.evt file, extra rows are filled as -1
| Pixel properties | Quadrant properties | ||||||
|---|---|---|---|---|---|---|---|
| Quadrant | DetID | PixID | Counts | Sigma | Mean | Median | Sigma |
| A | 6 | 16 | 96809 | 565.44 | 849 | 833 | 169.7 |
| A | 15 | 174 | 87364 | 509.79 | 849 | 833 | 169.7 |
| A | 15 | 236 | 51446 | 298.18 | 849 | 833 | 169.7 |
| B | 3 | 64 | 58555 | 361.04 | 852 | 833 | 159.9 |
| B | 0 | 190 | 33855 | 206.55 | 852 | 833 | 159.9 |
| B | 0 | 228 | 31918 | 194.43 | 852 | 833 | 159.9 |
| C | 14 | 238 | 129892 | 682.18 | 812 | 817 | 189.2 |
| C | 13 | 61 | 5752 | 26.08 | 812 | 817 | 189.2 |
| C | 5 | 4 | 2490 | 8.84 | 812 | 817 | 189.2 |
| D | 12 | 235 | 1150750 | 5887.02 | 808 | 786 | 195.3 |
| D | 7 | 238 | 293509 | 1498.54 | 808 | 786 | 195.3 |
| D | 1 | 52 | 266543 | 1360.49 | 808 | 786 | 195.3 |
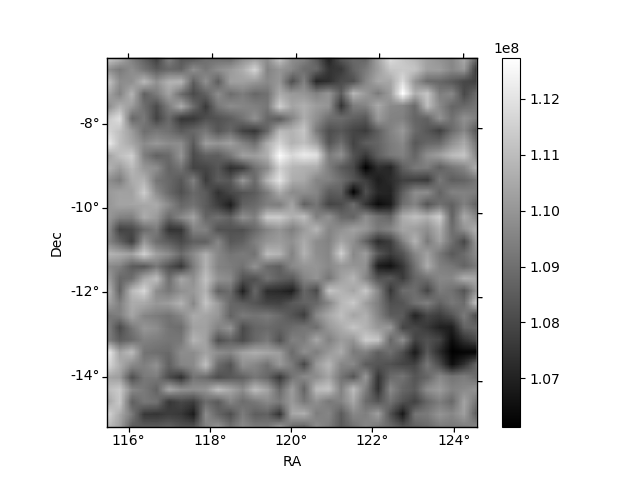
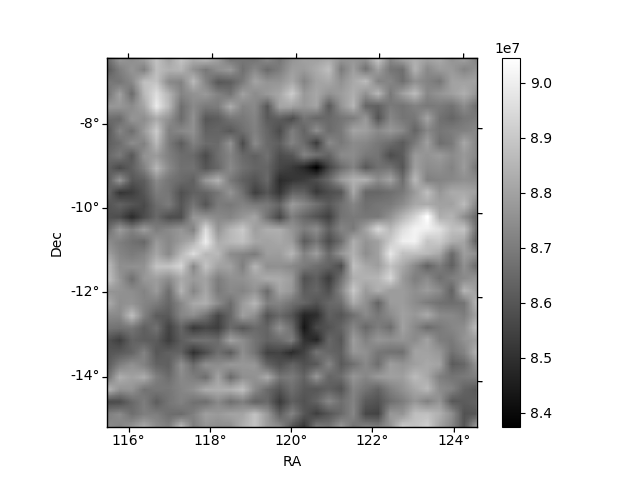
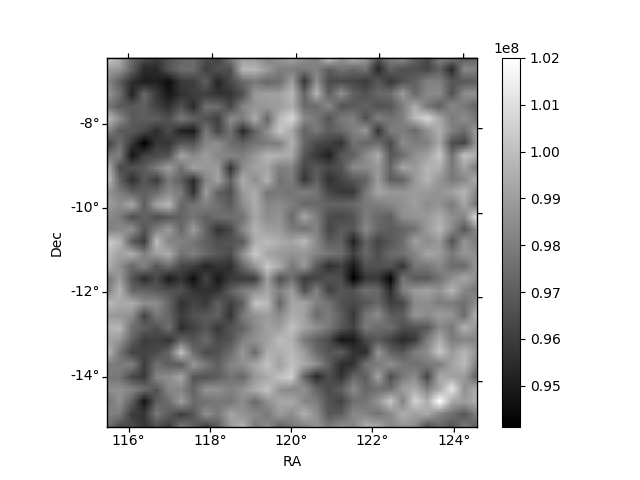
Histogram calculated using DETX and DETY for each event in the final _common_clean file
| Quadrant A | 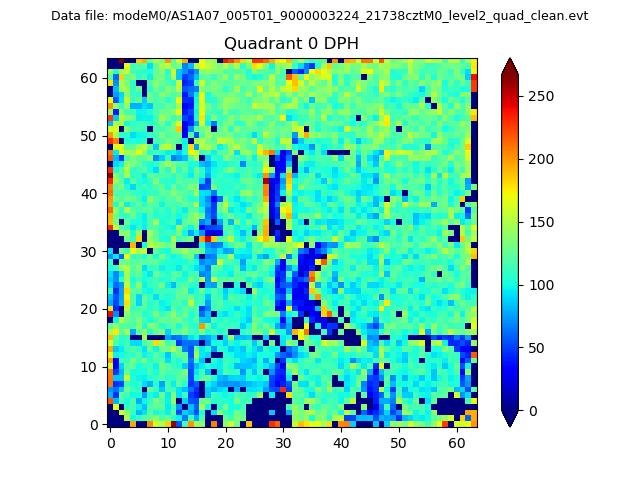 |
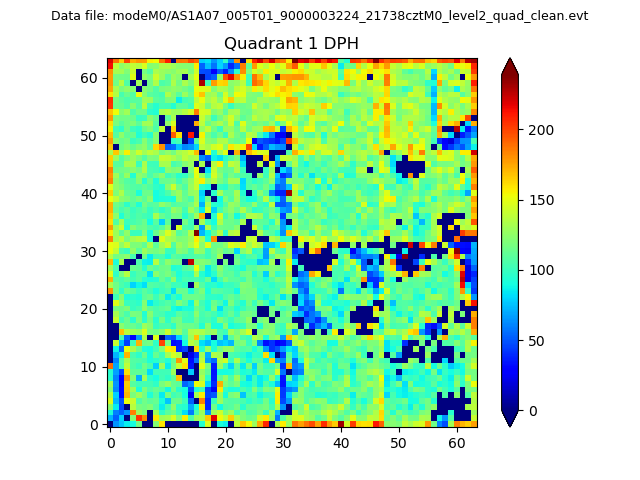 |
Quadrant B |
|---|---|---|---|
| Quadrant D | 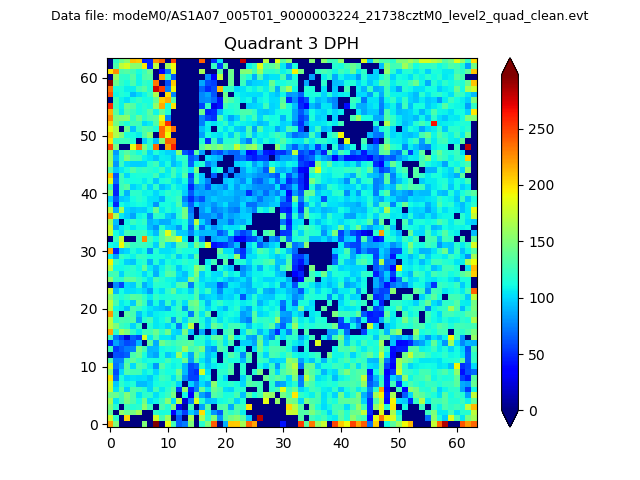 |
 |
Quadrant C |
| Plot type | Count rate plots | Images |
|---|---|---|
| Comparison with Poisson distribution Blue bars denote a histogram of data divided into 1 sec bins. Red curve is a Poisson curve with rate = median count rate of data. |
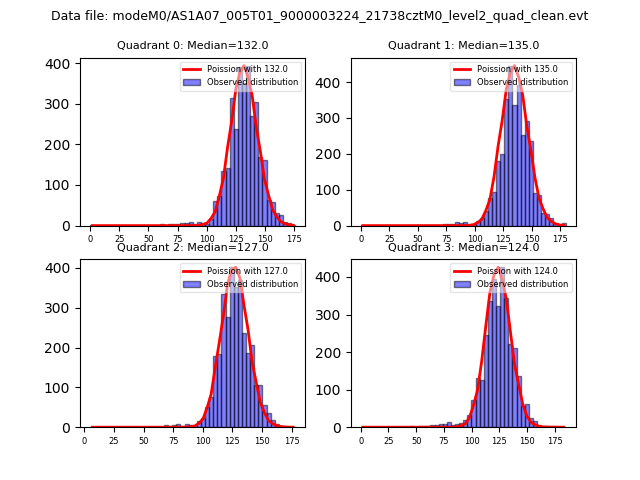 |
 |
| Quadrant-wise count rates Data is divided into 100 sec bins |
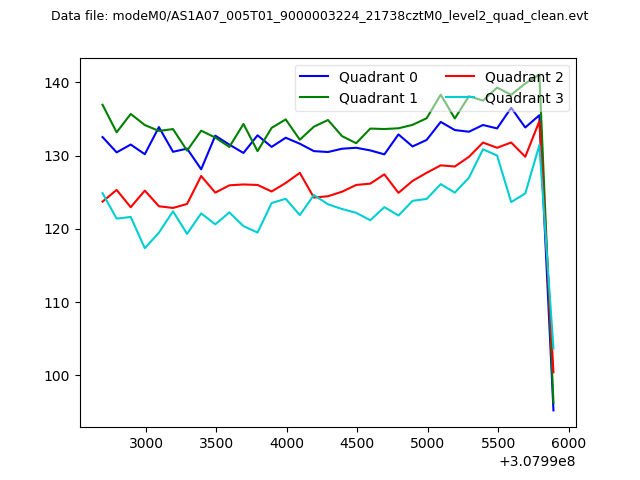 |
|
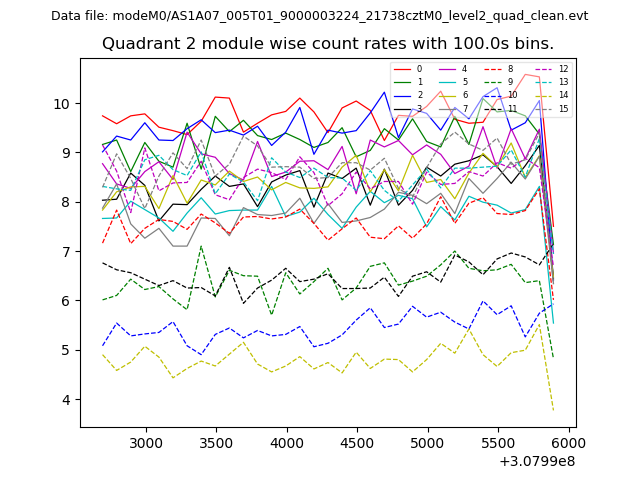
| Module-wise count rates for Quadrant A Data is divided into 100 sec bins |
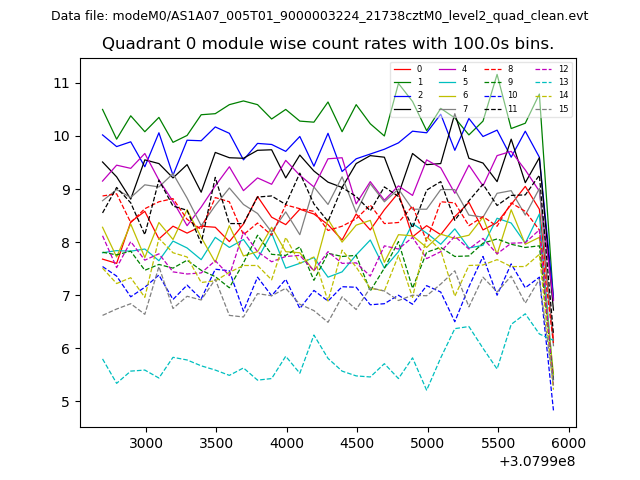 |
 |
| Module-wise count rates for Quadrant B Data is divided into 100 sec bins |
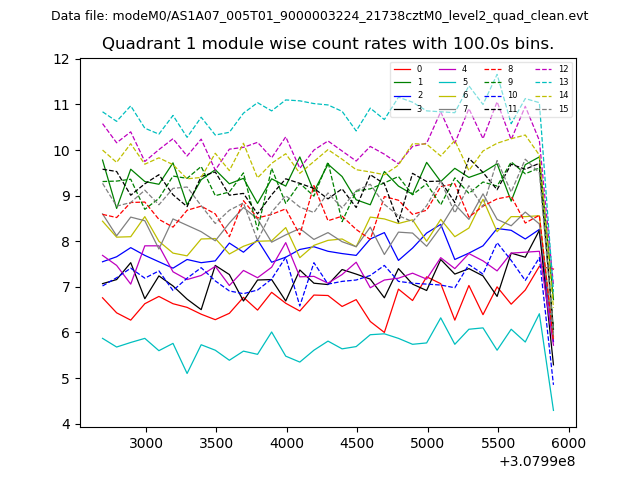 |
 |
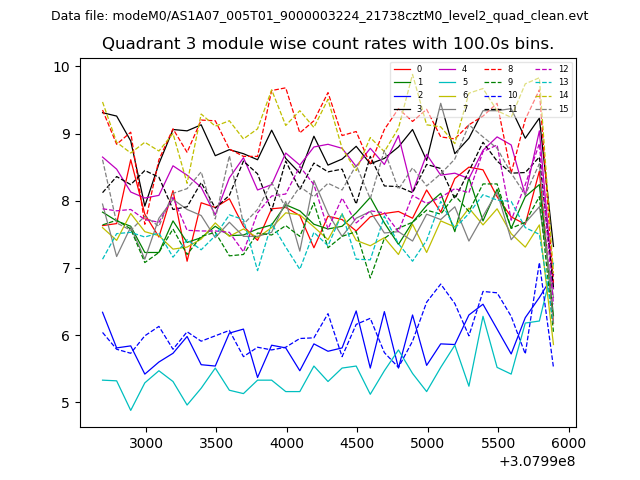
| Module-wise count rates for Quadrant C Data is divided into 100 sec bins |
 |
 |
| Module-wise count rates for Quadrant D Data is divided into 100 sec bins |
 |
 |
| Parameter | Plot |
|---|---|
| CZT HV Monitor | 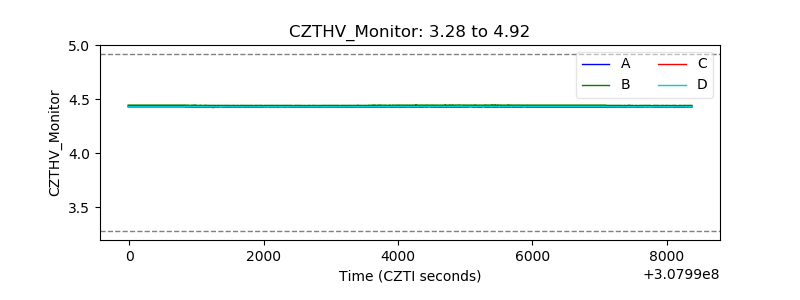 |
| D_VDD | 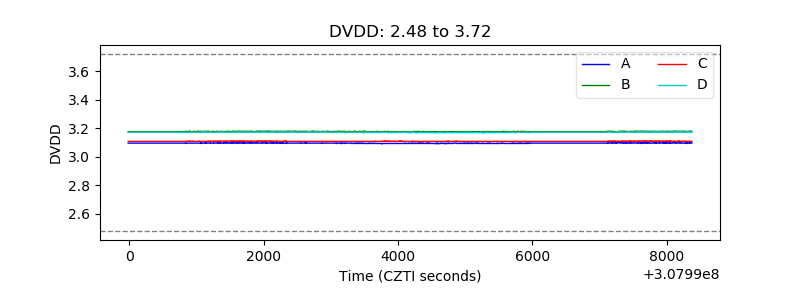 |
| Temperature 1 | 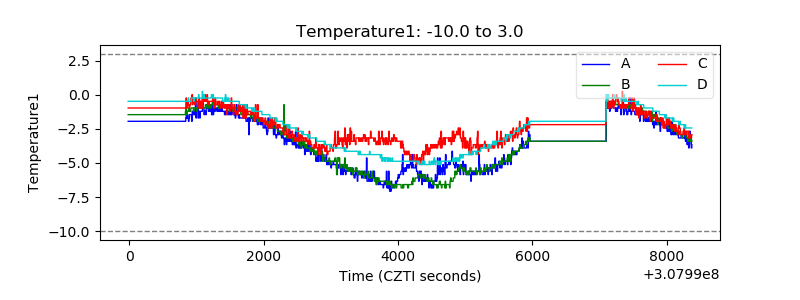 |
| Veto HV Monitor |  |
| Veto LLD | 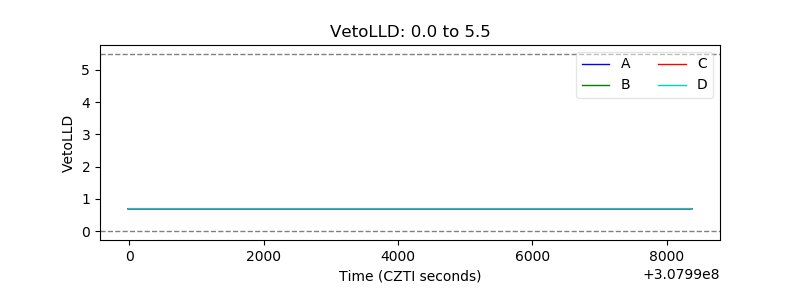 |
| Alpha Counter | 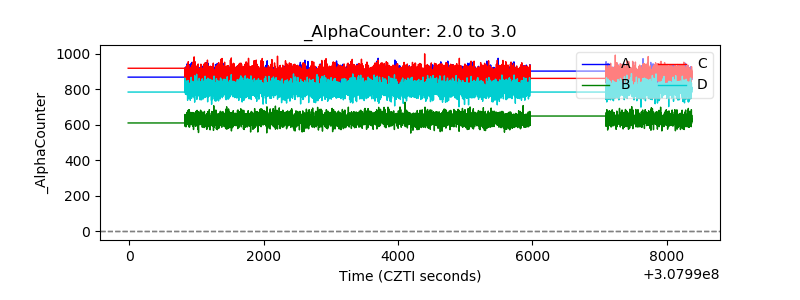 |
| _CPM_Rate | 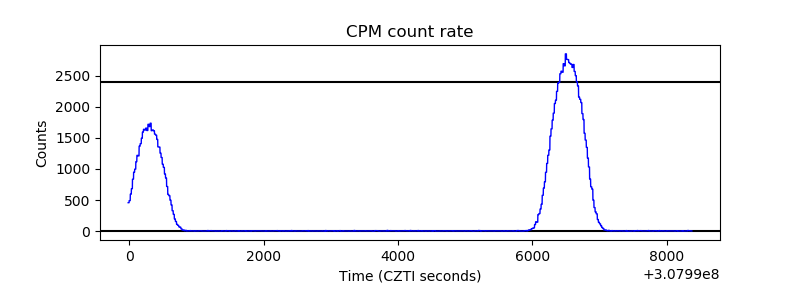 |
| CZT Counter |  |
| +2.5 Volts monitor |  |
| +5 Volts monitor |  |
| _ROLL_ROT | 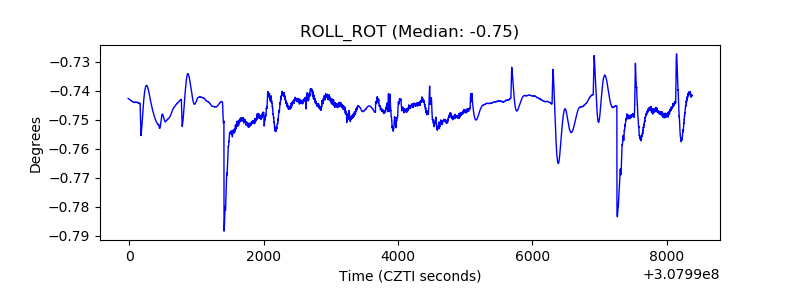 |
| _Roll_DEC | 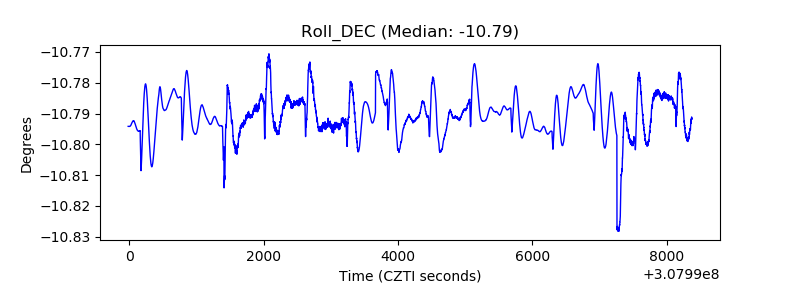 |
| _Roll_RA |  |
| Veto Counter | 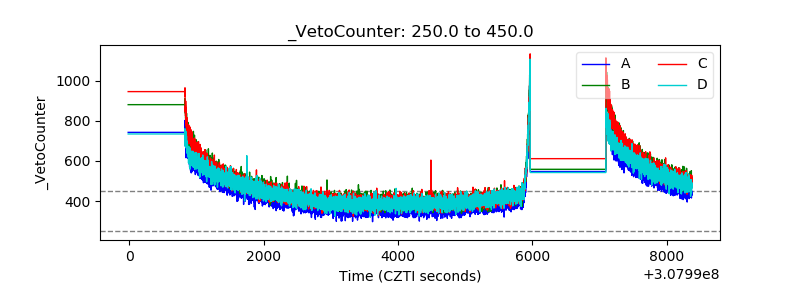 |