| Param | Original file | Final file |
|---|---|---|
| Filename | modeM0/AS1A07_005T01_9000003224_21739cztM0_level2.evt | modeM0/AS1A07_005T01_9000003224_21739cztM0_level2_quad_clean.evt |
| Size (bytes) | 551,445,120 | 83,249,280 |
| Size | 525.9 MB | 79.4 MB |
| Events in quadrant A | 3,756,878 | 531,100 |
| Events in quadrant B | 3,595,703 | 546,339 |
| Events in quadrant C | 3,345,732 | 514,853 |
| Events in quadrant D | 5,575,977 | 489,260 |
| Mode M9 | |||
|---|---|---|---|
| Quadrant | BADHDUFLAG | Total packets | Discarded packets |
| A | 0 | 20 | 0 |
| B | 0 | 21 | 0 |
| C | 0 | 21 | 0 |
| D | 0 | 21 | 0 |
| Mode M0 | |||
|---|---|---|---|
| Quadrant | BADHDUFLAG | Total packets | Discarded packets |
| A | 0 | 15403 | 2 |
| B | 0 | 14783 | 2 |
| C | 0 | 13941 | 2 |
| D | 0 | 20879 | 2 |
| Mode SS | |||
|---|---|---|---|
| Quadrant | BADHDUFLAG | Total packets | Discarded packets |
| A | 0 | 128 | 0 |
| B | 0 | 128 | 0 |
| C | 0 | 128 | 0 |
| D | 0 | 128 | 0 |
| Quadrant | Total seconds | Saturated seconds | Saturation percentage |
|---|---|---|---|
| A | 6294 | 114 | 1.811249% |
| B | 6293 | 105 | 1.668521% |
| C | 6293 | 107 | 1.700302% |
| D | 6293 | 613 | 9.740982% |
Noise dominated data is calculated using 1-second bins in cleaned event files. If a bin has >2000 counts, and if more than 50% of those come from <1% of pixels, then it is considered to be noise-dominated and hence unusable.
| Quadrant | # 1 sec bins | Bins with >0 counts | Bins with >2000 counts | High rate bins dominated by noise | Noise dominated (total time) | Noise dominated (detector-on time) | Marked lightcurve |
|---|---|---|---|---|---|---|---|
| A | 7529 | 6294 | 29 | 29 | 0.39% | 0.46% | 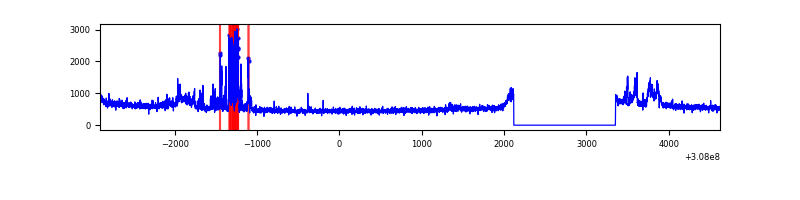 |
| B | 7528 | 6293 | 10 | 10 | 0.13% | 0.16% | 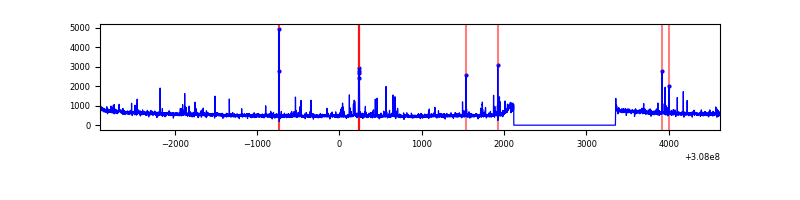 |
| C | 7528 | 6294 | 0 | 0 | 0.00% | 0.00% | 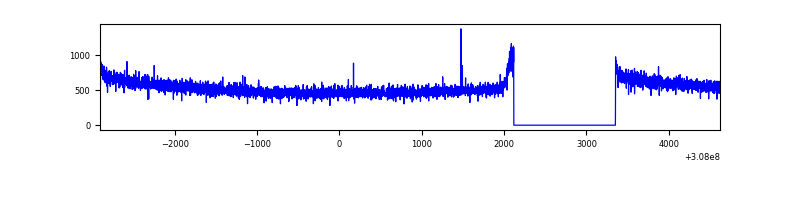 |
| D | 7528 | 6294 | 391 | 391 | 5.19% | 6.21% | 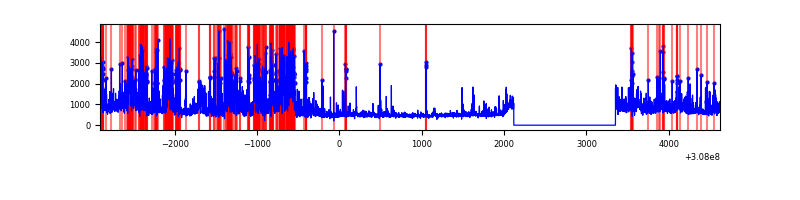 |
Top three noisy pixels from each quadrant. If the there are fewer than three noisy pixels in the level2.evt file, extra rows are filled as -1
| Pixel properties | Quadrant properties | ||||||
|---|---|---|---|---|---|---|---|
| Quadrant | DetID | PixID | Counts | Sigma | Mean | Median | Sigma |
| A | 15 | 236 | 219492 | 1273.83 | 859 | 845 | 171.6 |
| A | 15 | 174 | 217659 | 1263.15 | 859 | 845 | 171.6 |
| A | 13 | 254 | 10755 | 57.74 | 859 | 845 | 171.6 |
| B | 3 | 64 | 138412 | 852.87 | 864 | 845 | 161.3 |
| B | 0 | 230 | 18264 | 107.99 | 864 | 845 | 161.3 |
| B | 12 | 111 | 17479 | 103.13 | 864 | 845 | 161.3 |
| C | 14 | 238 | 131231 | 680.75 | 823 | 830 | 191.6 |
| C | 13 | 61 | 5656 | 25.19 | 823 | 830 | 191.6 |
| C | 10 | 22 | 3773 | 15.36 | 823 | 830 | 191.6 |
| D | 12 | 235 | 783749 | 3997.56 | 808 | 789 | 195.9 |
| D | 2 | 136 | 652520 | 3327.54 | 808 | 789 | 195.9 |
| D | 7 | 238 | 327028 | 1665.68 | 808 | 789 | 195.9 |
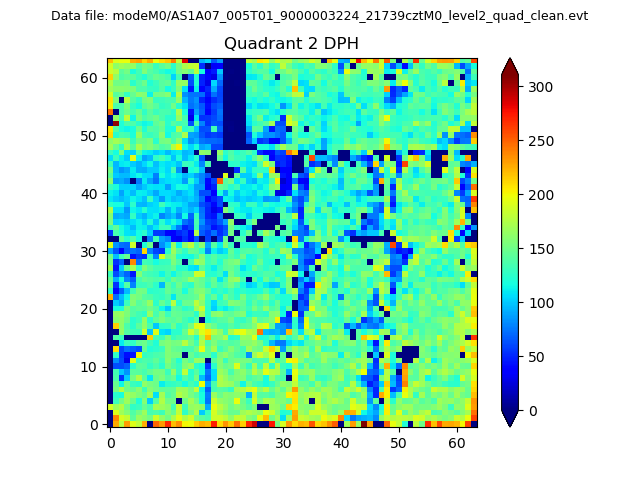
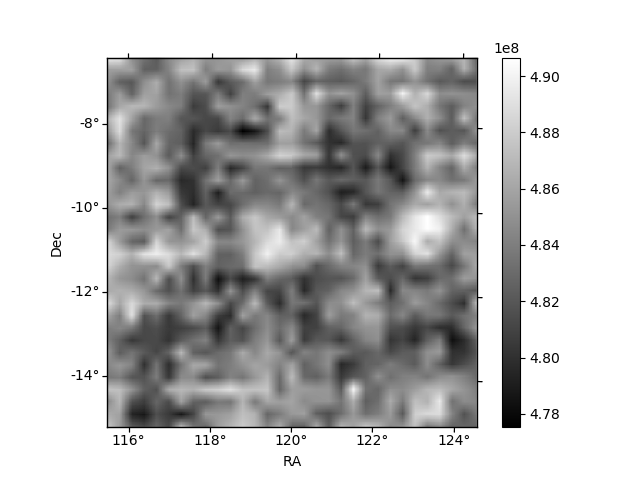
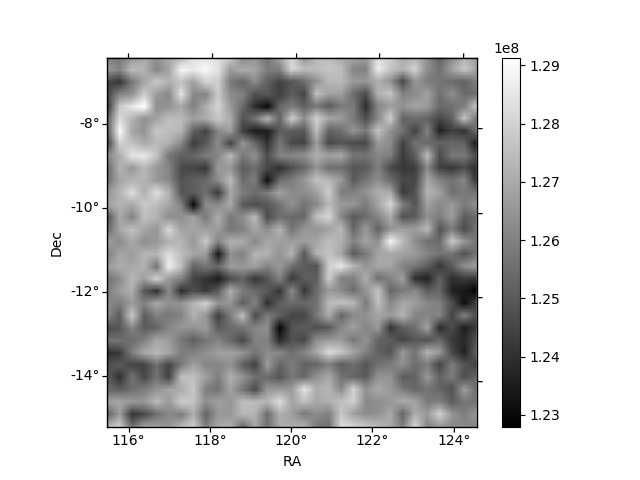
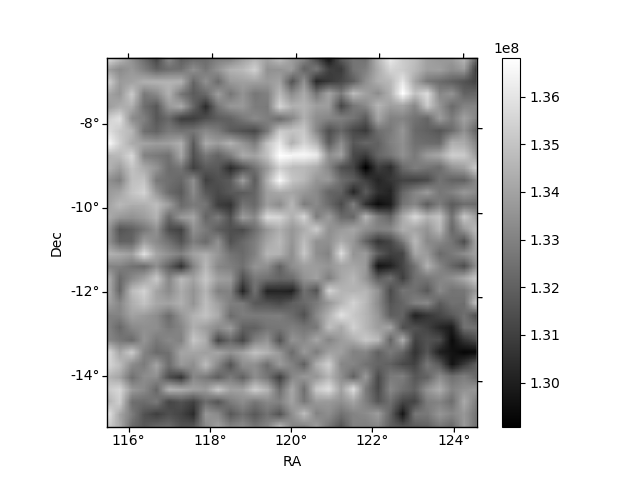
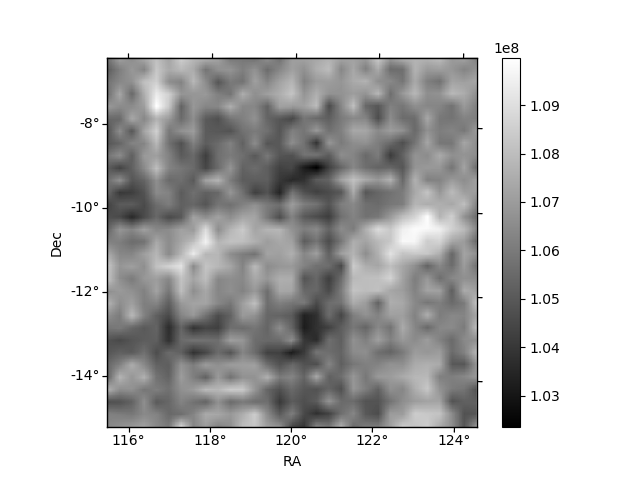
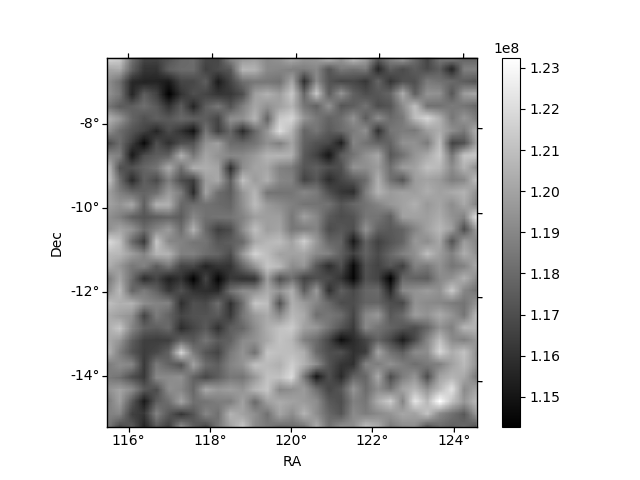
Histogram calculated using DETX and DETY for each event in the final _common_clean file
| Quadrant A | 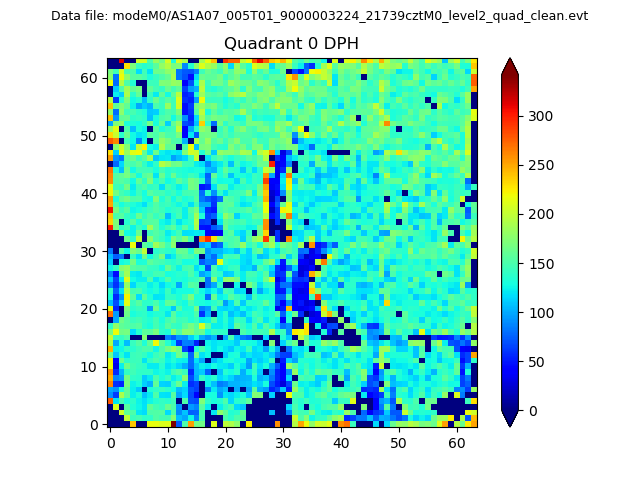 |
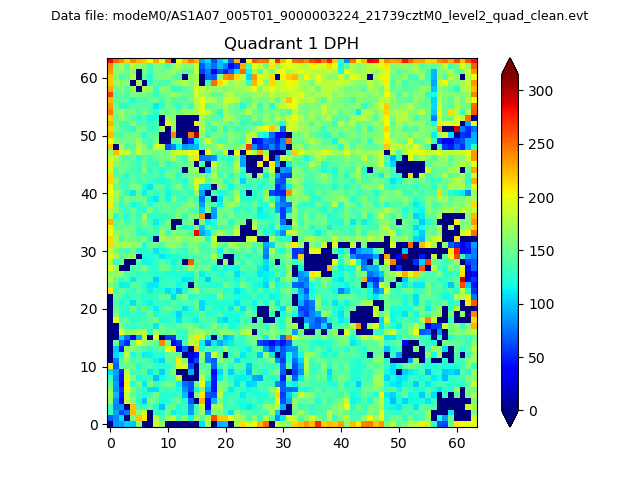 |
Quadrant B |
|---|---|---|---|
| Quadrant D | 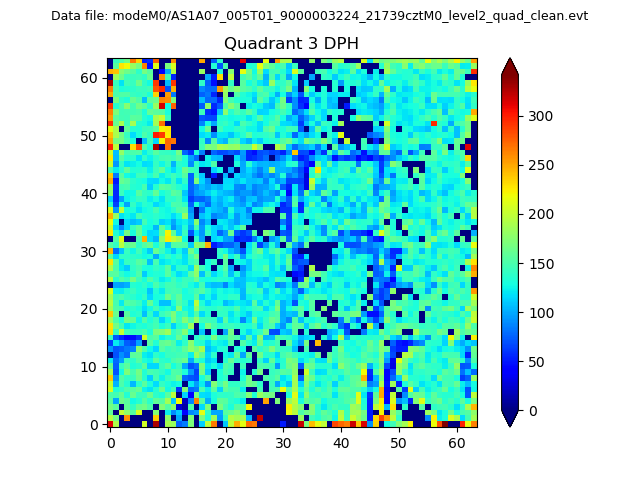 |
 |
Quadrant C |
| Plot type | Count rate plots | Images |
|---|---|---|
| Comparison with Poisson distribution Blue bars denote a histogram of data divided into 1 sec bins. Red curve is a Poisson curve with rate = median count rate of data. |
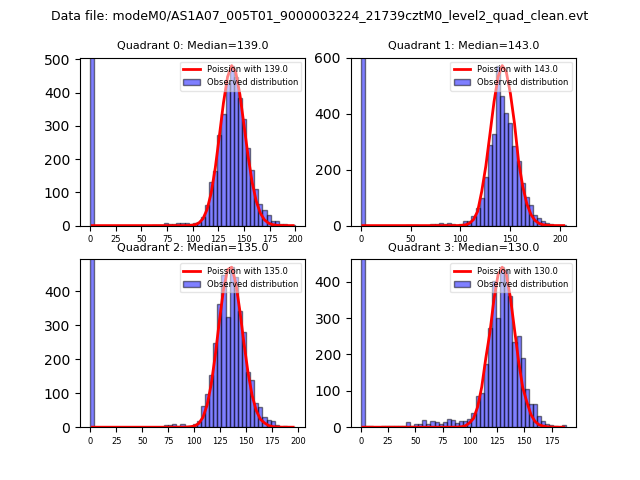 |
 |
| Quadrant-wise count rates Data is divided into 100 sec bins |
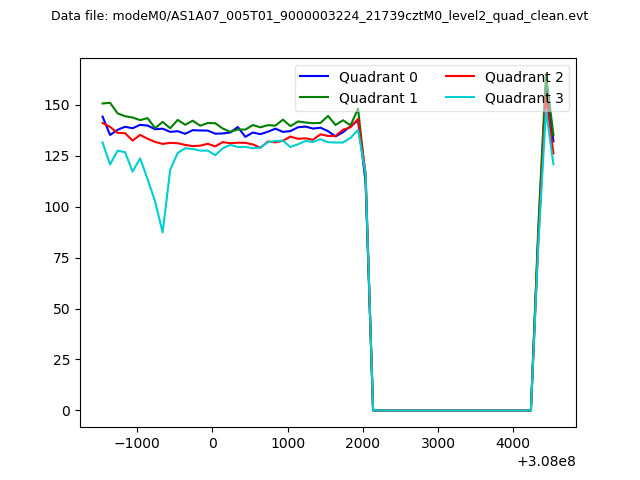 |
|
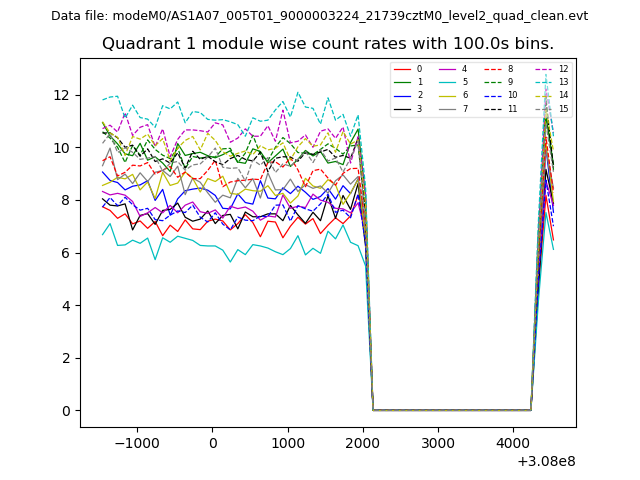
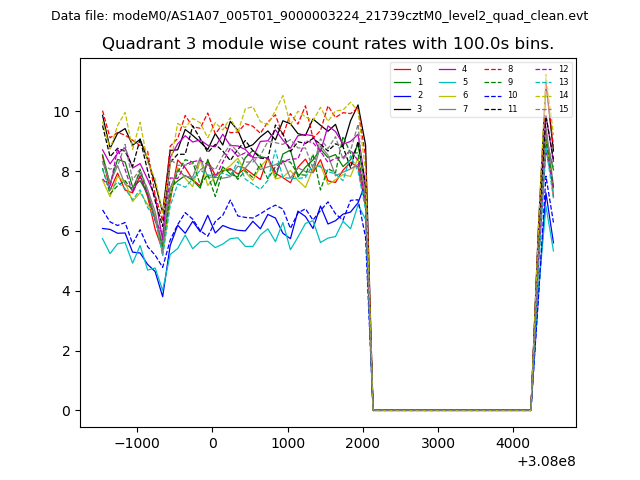
| Module-wise count rates for Quadrant A Data is divided into 100 sec bins |
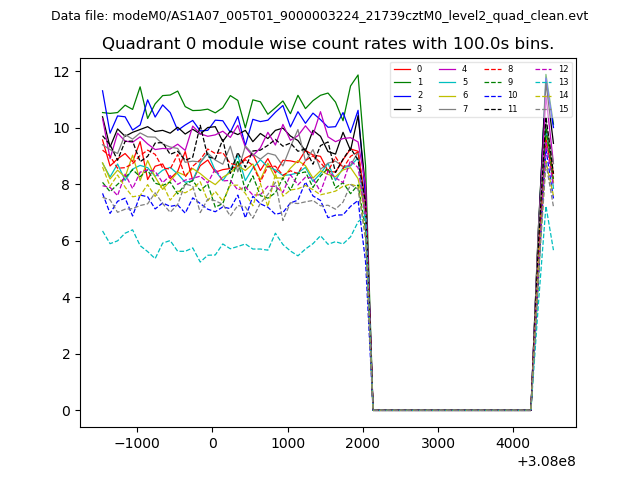 |
 |
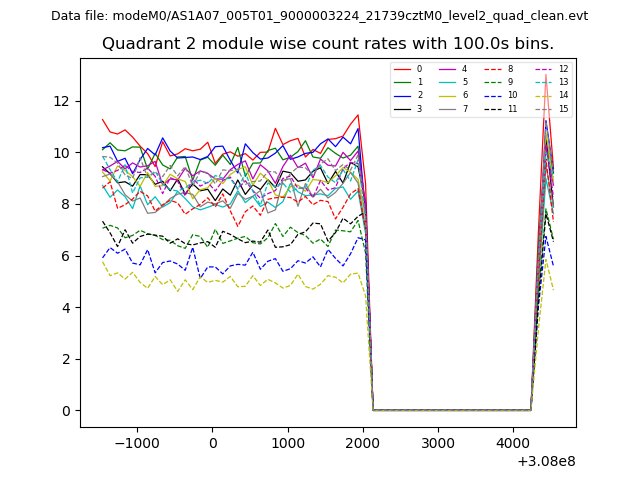
| Module-wise count rates for Quadrant B Data is divided into 100 sec bins |
 |
 |
| Module-wise count rates for Quadrant C Data is divided into 100 sec bins |
 |
 |
| Module-wise count rates for Quadrant D Data is divided into 100 sec bins |
 |
 |
| Parameter | Plot |
|---|---|
| CZT HV Monitor | 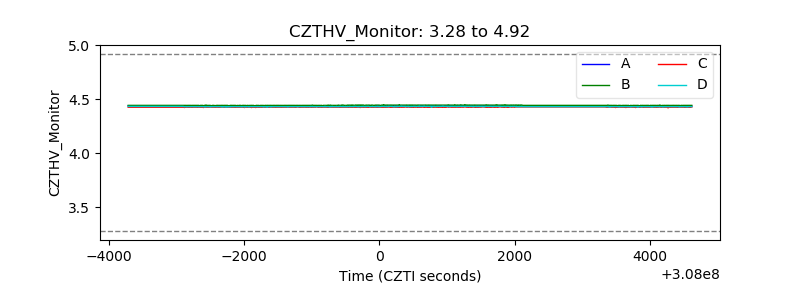 |
| D_VDD | 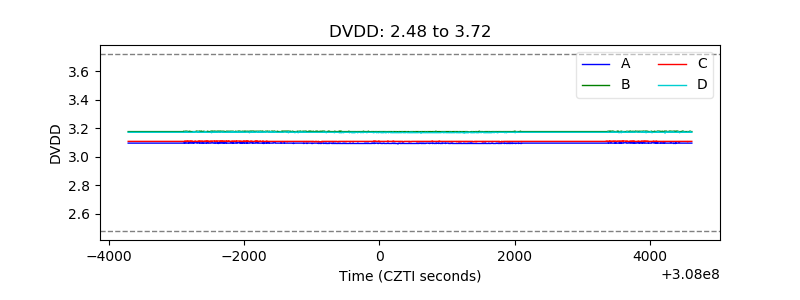 |
| Temperature 1 | 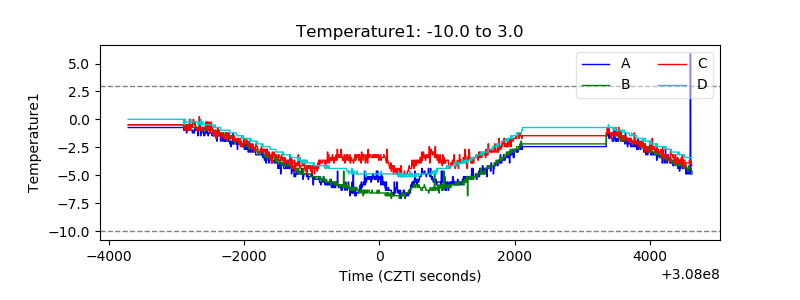 |
| Veto HV Monitor | 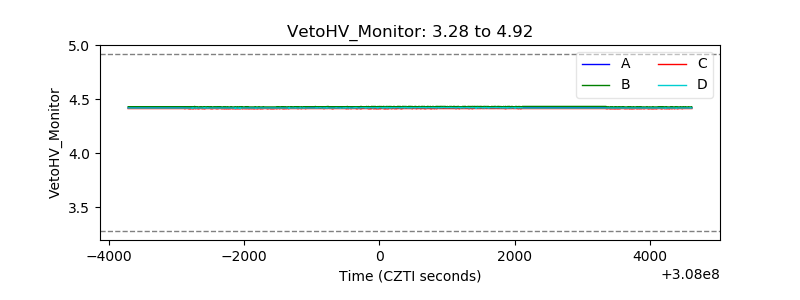 |
| Veto LLD | 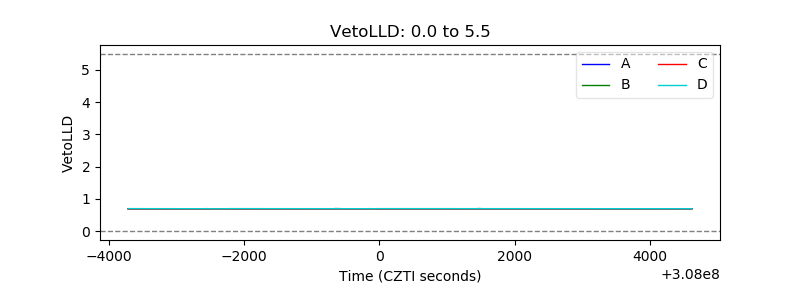 |
| Alpha Counter | 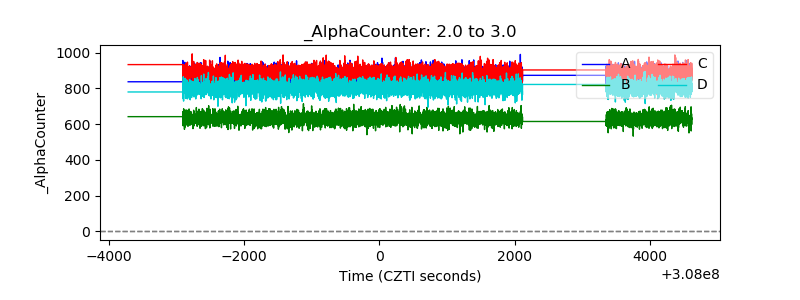 |
| _CPM_Rate | 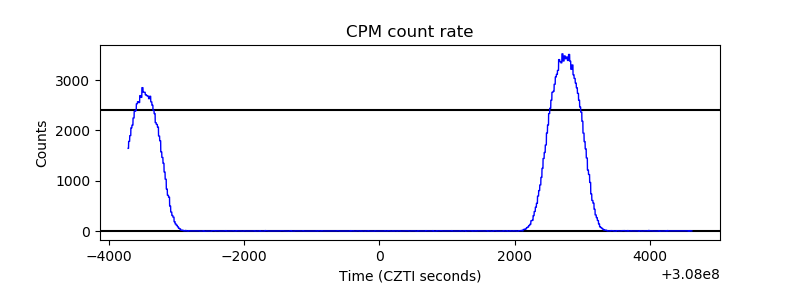 |
| CZT Counter | 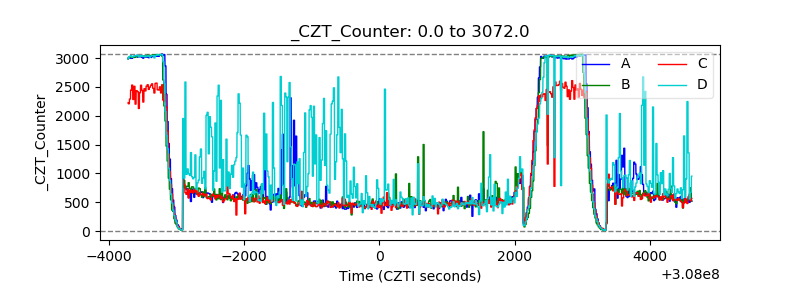 |
| +2.5 Volts monitor | 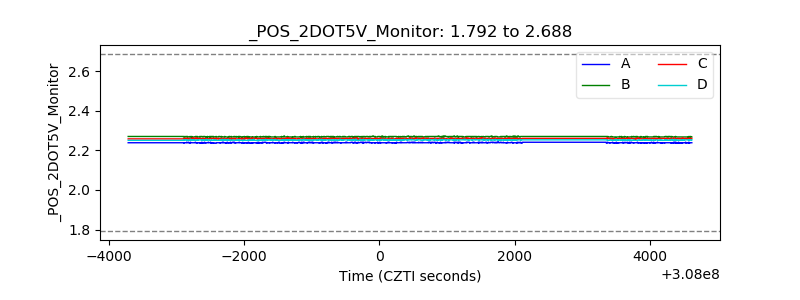 |
| +5 Volts monitor | 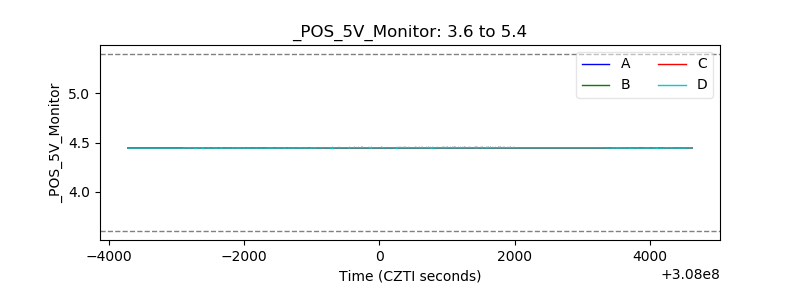 |
| _ROLL_ROT | 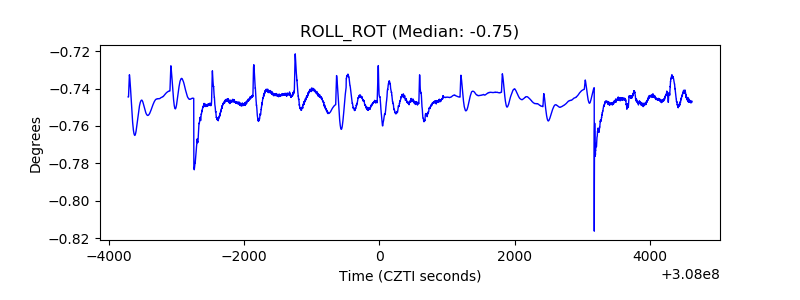 |
| _Roll_DEC | 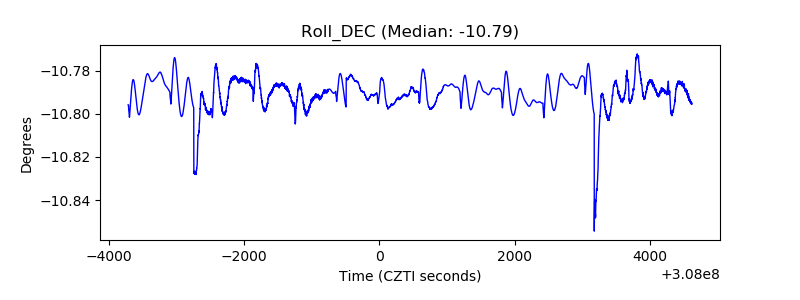 |
| _Roll_RA | 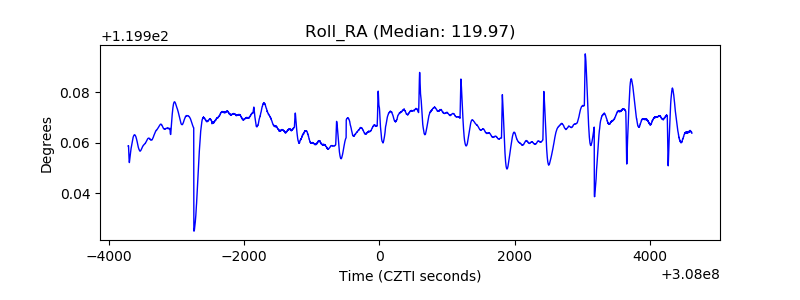 |
| Veto Counter | 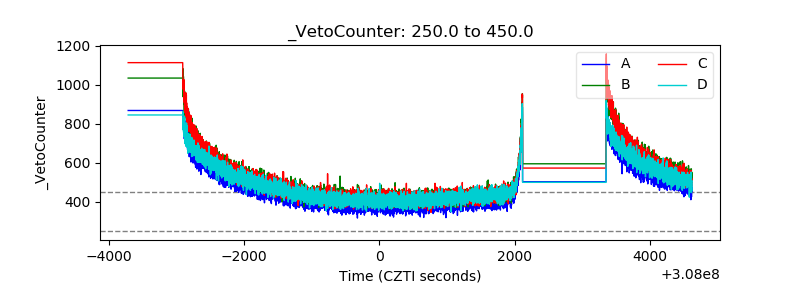 |