| Param | Original file | Final file |
|---|---|---|
| Filename | modeM0/AS1A07_005T01_9000003224_21741cztM0_level2.evt | modeM0/AS1A07_005T01_9000003224_21741cztM0_level2_quad_clean.evt |
| Size (bytes) | 582,606,720 | 102,349,440 |
| Size | 555.6 MB | 97.6 MB |
| Events in quadrant A | 4,354,700 | 669,388 |
| Events in quadrant B | 3,567,789 | 711,300 |
| Events in quadrant C | 3,268,473 | 664,230 |
| Events in quadrant D | 6,035,941 | 624,082 |
| Mode M9 | |||
|---|---|---|---|
| Quadrant | BADHDUFLAG | Total packets | Discarded packets |
| A | 0 | 15 | 0 |
| B | 0 | 16 | 0 |
| C | 0 | 16 | 0 |
| D | 0 | 16 | 0 |
| Mode M0 | |||
|---|---|---|---|
| Quadrant | BADHDUFLAG | Total packets | Discarded packets |
| A | 0 | 16962 | 2 |
| B | 0 | 14620 | 2 |
| C | 0 | 13513 | 2 |
| D | 0 | 22234 | 2 |
| Mode SS | |||
|---|---|---|---|
| Quadrant | BADHDUFLAG | Total packets | Discarded packets |
| A | 0 | 126 | 0 |
| B | 0 | 126 | 0 |
| C | 0 | 126 | 0 |
| D | 0 | 126 | 0 |
| Quadrant | Total seconds | Saturated seconds | Saturation percentage |
|---|---|---|---|
| A | 6167 | 277 | 4.491649% |
| B | 6167 | 123 | 1.994487% |
| C | 6166 | 88 | 1.427181% |
| D | 6166 | 744 | 12.066169% |
Noise dominated data is calculated using 1-second bins in cleaned event files. If a bin has >2000 counts, and if more than 50% of those come from <1% of pixels, then it is considered to be noise-dominated and hence unusable.
| Quadrant | # 1 sec bins | Bins with >0 counts | Bins with >2000 counts | High rate bins dominated by noise | Noise dominated (total time) | Noise dominated (detector-on time) | Marked lightcurve |
|---|---|---|---|---|---|---|---|
| A | 7507 | 6168 | 161 | 161 | 2.14% | 2.61% | 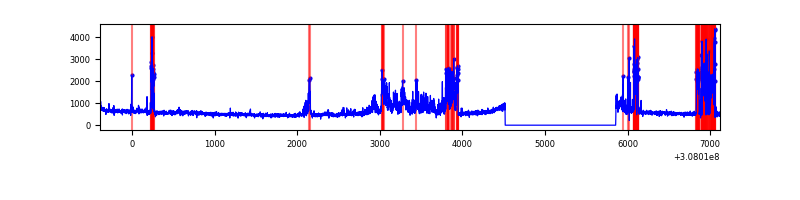 |
| B | 7507 | 6168 | 15 | 15 | 0.20% | 0.24% |  |
| C | 7506 | 6167 | 0 | 0 | 0.00% | 0.00% | 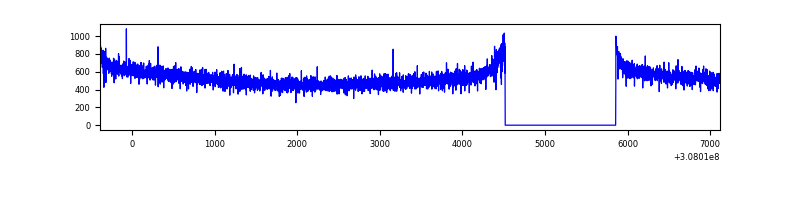 |
| D | 7506 | 6167 | 528 | 528 | 7.03% | 8.56% | 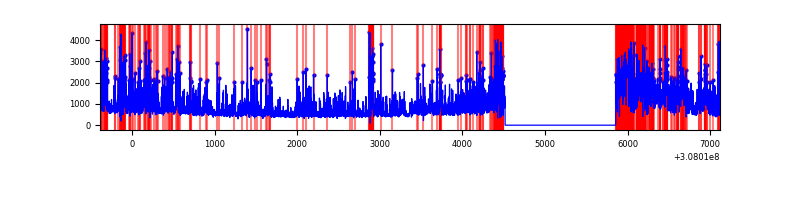 |
Top three noisy pixels from each quadrant. If the there are fewer than three noisy pixels in the level2.evt file, extra rows are filled as -1
| Pixel properties | Quadrant properties | ||||||
|---|---|---|---|---|---|---|---|
| Quadrant | DetID | PixID | Counts | Sigma | Mean | Median | Sigma |
| A | 13 | 252 | 679419 | 4122.34 | 822 | 806 | 164.6 |
| A | 15 | 236 | 441175 | 2675.09 | 822 | 806 | 164.6 |
| A | 15 | 174 | 65975 | 395.88 | 822 | 806 | 164.6 |
| B | 3 | 64 | 88787 | 559.85 | 842 | 824 | 157.1 |
| B | 6 | 36 | 52787 | 330.72 | 842 | 824 | 157.1 |
| B | 0 | 230 | 41624 | 259.68 | 842 | 824 | 157.1 |
| C | 14 | 238 | 128337 | 679.25 | 803 | 811 | 187.7 |
| C | 13 | 61 | 5522 | 25.09 | 803 | 811 | 187.7 |
| C | 8 | 128 | 3819 | 16.02 | 803 | 811 | 187.7 |
| D | 1 | 52 | 1186550 | 6515.74 | 761 | 741 | 182.0 |
| D | 12 | 235 | 776275 | 4261.37 | 761 | 741 | 182.0 |
| D | 7 | 238 | 510446 | 2800.71 | 761 | 741 | 182.0 |
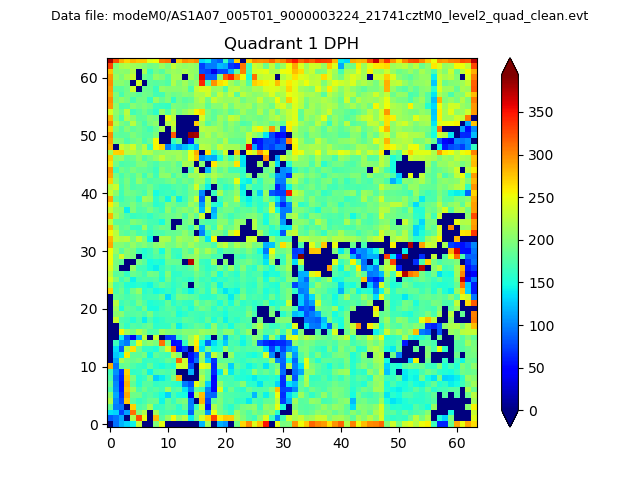
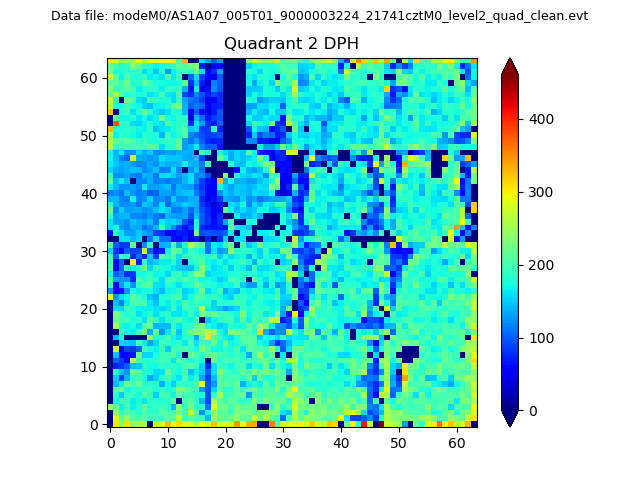
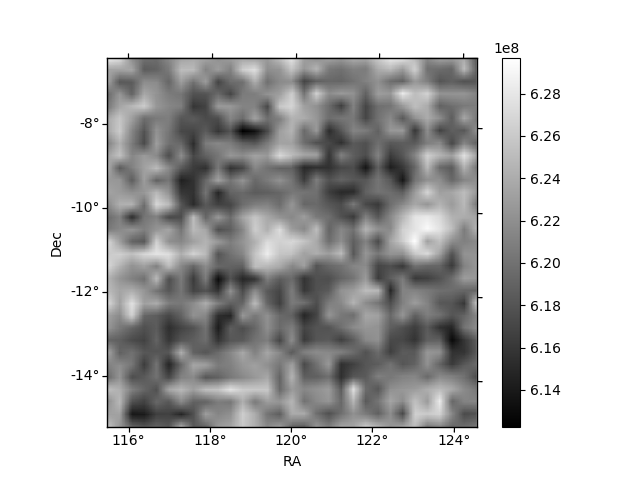
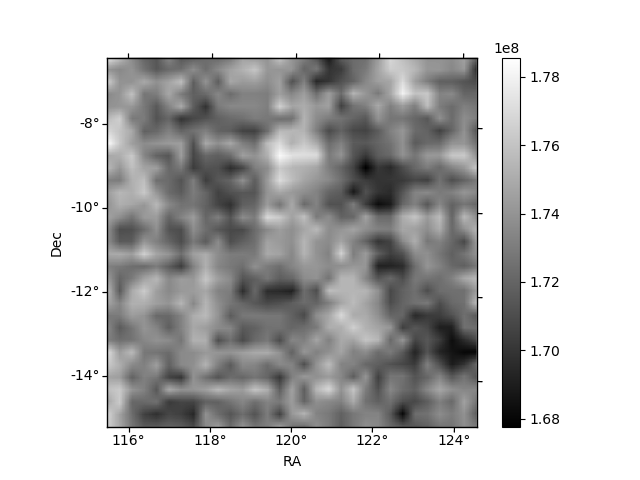
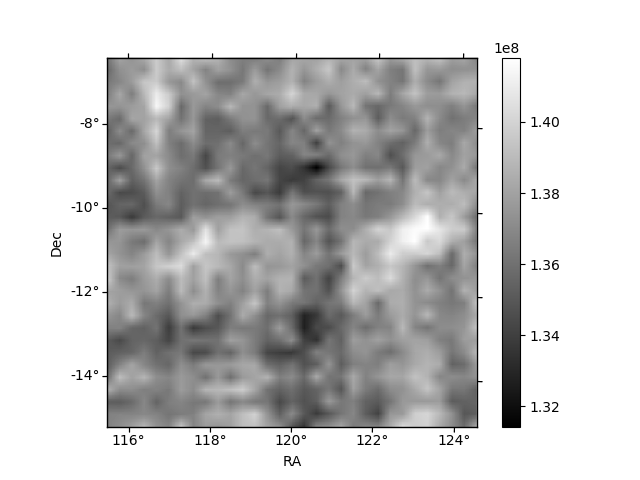
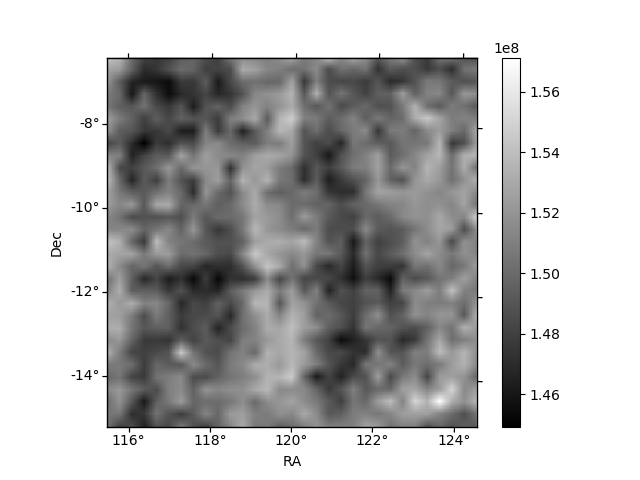
Histogram calculated using DETX and DETY for each event in the final _common_clean file
| Quadrant A | 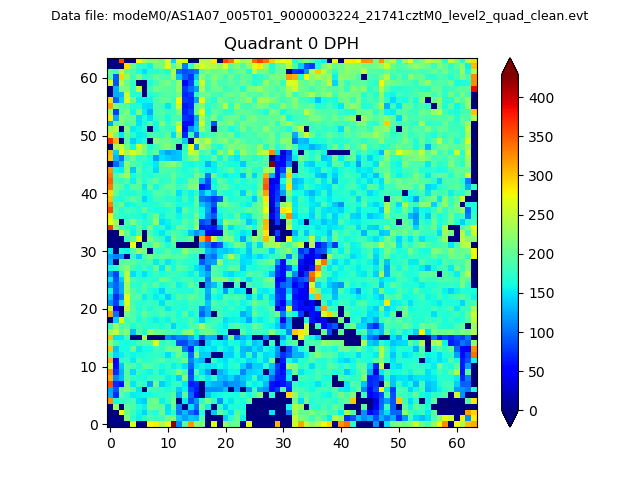 |
 |
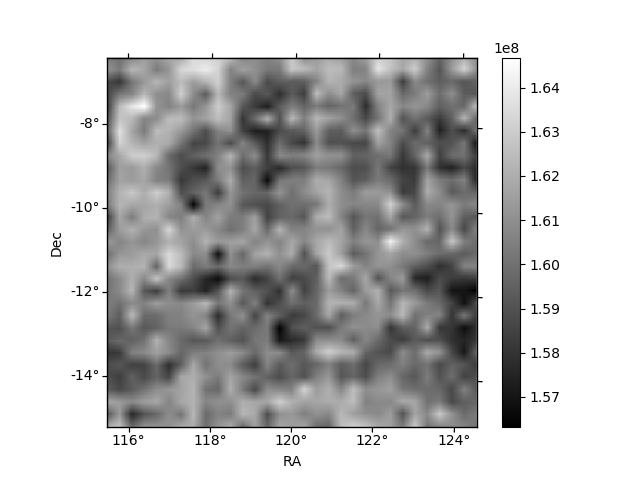
Quadrant B |
|---|---|---|---|
| Quadrant D | 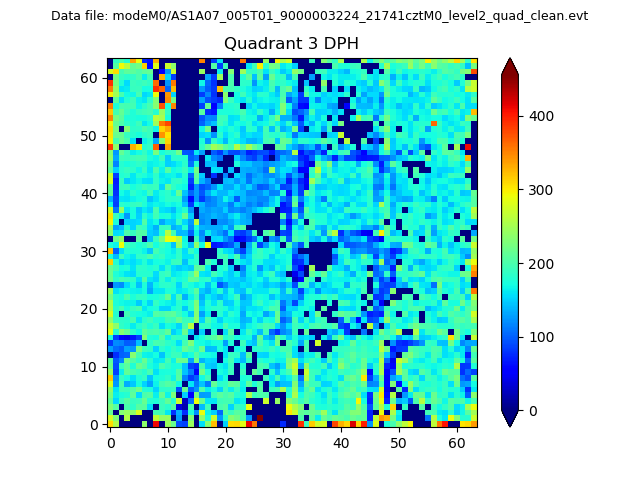 |
 |
Quadrant C |
| Plot type | Count rate plots | Images |
|---|---|---|
| Comparison with Poisson distribution Blue bars denote a histogram of data divided into 1 sec bins. Red curve is a Poisson curve with rate = median count rate of data. |
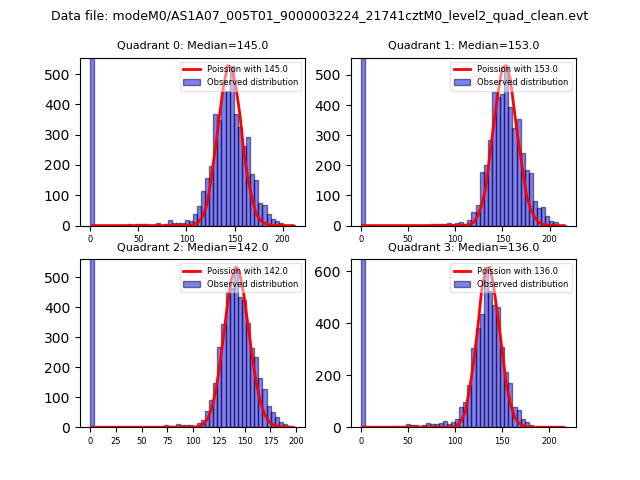 |
 |
| Quadrant-wise count rates Data is divided into 100 sec bins |
 |
|
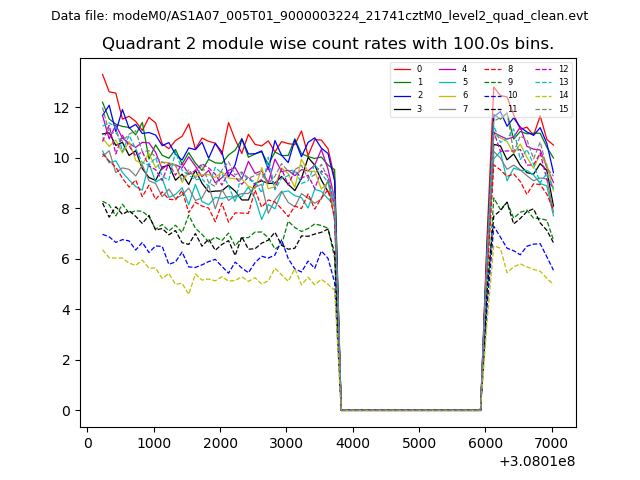
| Module-wise count rates for Quadrant A Data is divided into 100 sec bins |
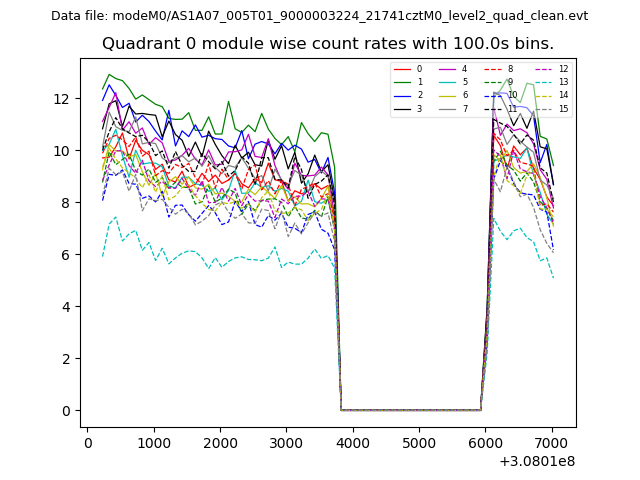 |
 |
| Module-wise count rates for Quadrant B Data is divided into 100 sec bins |
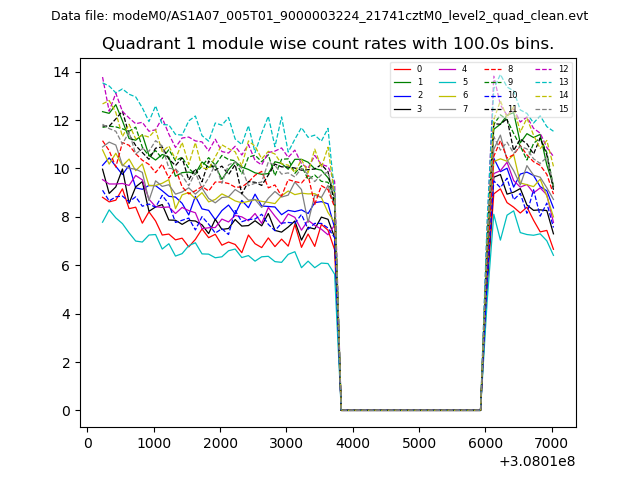 |
 |
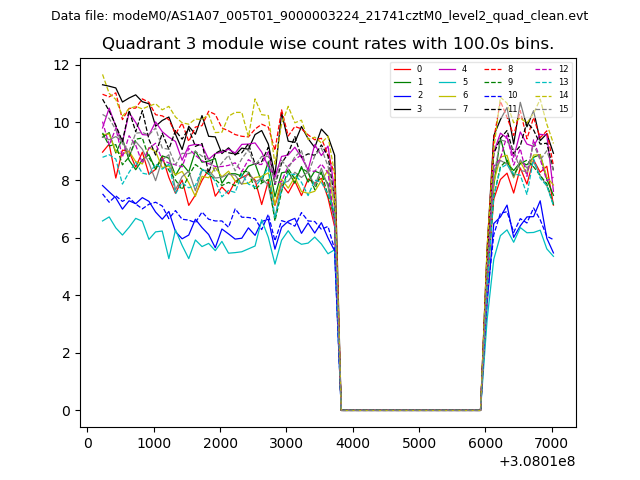
| Module-wise count rates for Quadrant C Data is divided into 100 sec bins |
 |
 |
| Module-wise count rates for Quadrant D Data is divided into 100 sec bins |
 |
 |
| Parameter | Plot |
|---|---|
| CZT HV Monitor | 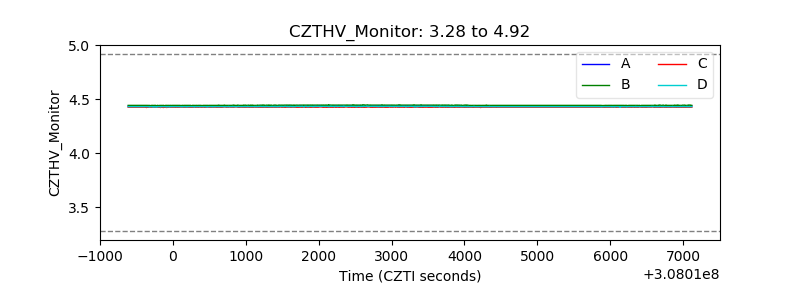 |
| D_VDD |  |
| Temperature 1 | 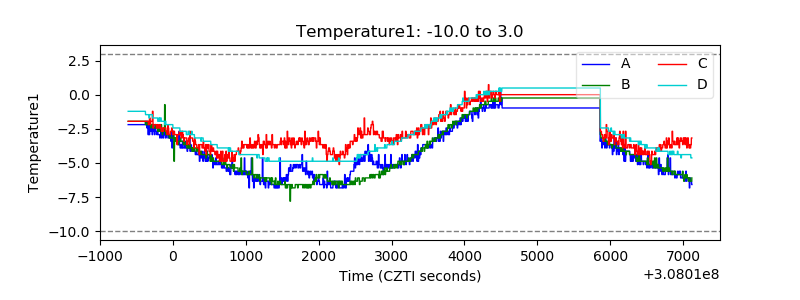 |
| Veto HV Monitor | 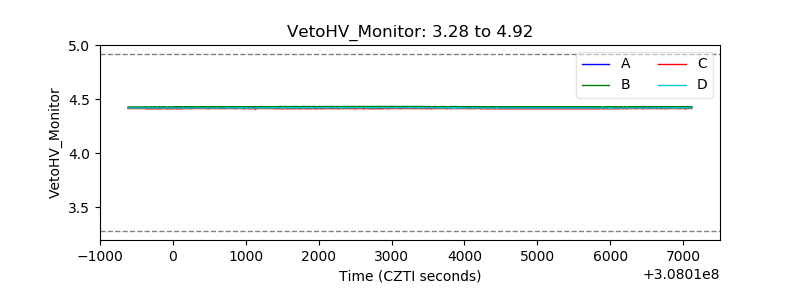 |
| Veto LLD | 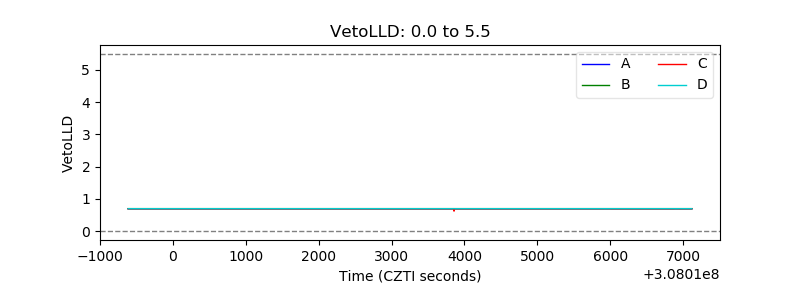 |
| Alpha Counter | 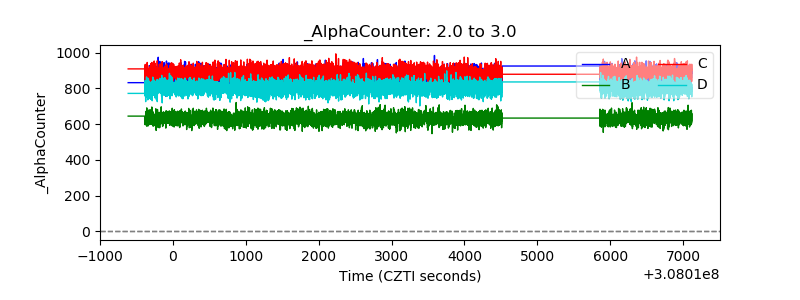 |
| _CPM_Rate | 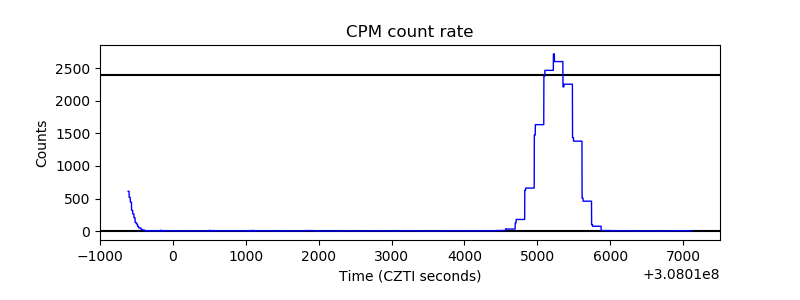 |
| CZT Counter | 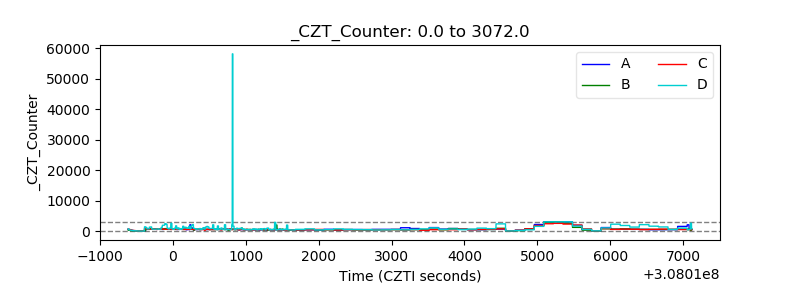 |
| +2.5 Volts monitor |  |
| +5 Volts monitor |  |
| _ROLL_ROT | 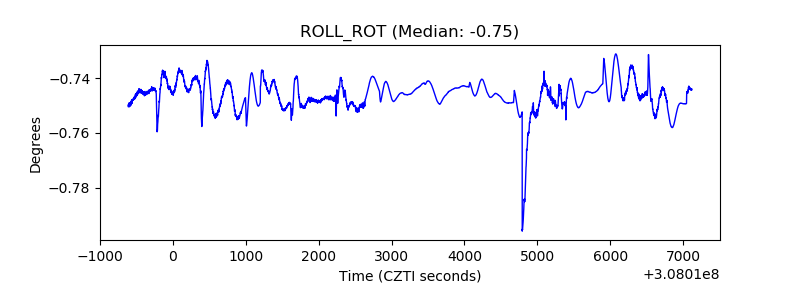 |
| _Roll_DEC | 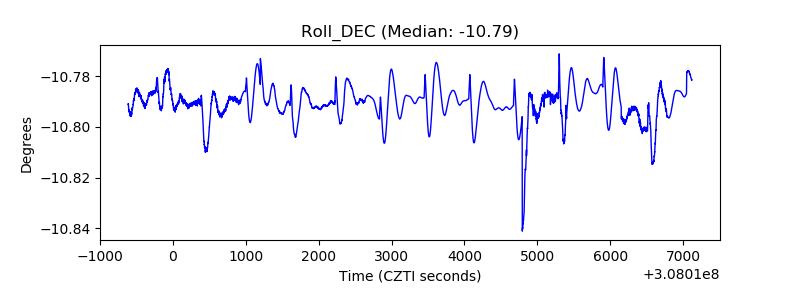 |
| _Roll_RA | 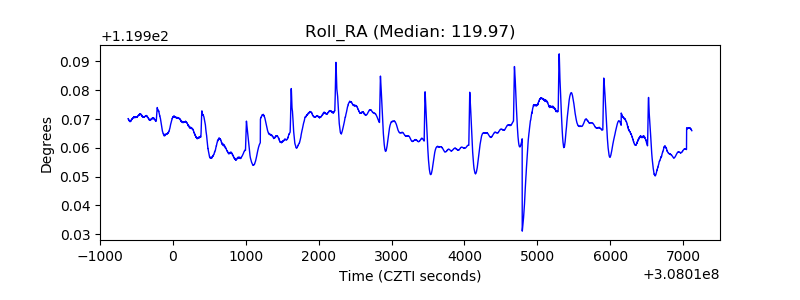 |
| Veto Counter | 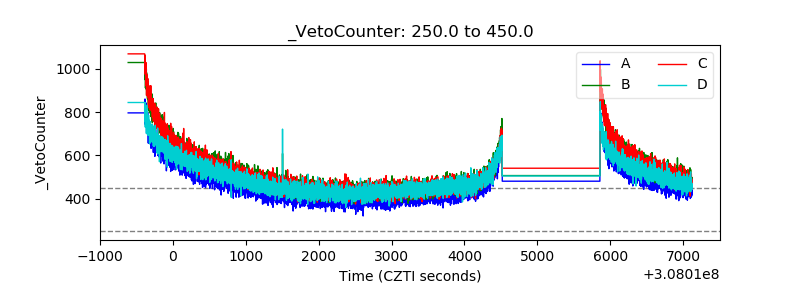 |