| Param | Original file | Final file |
|---|---|---|
| Filename | modeM0/AS1A07_005T01_9000003224_21743cztM0_level2.evt | modeM0/AS1A07_005T01_9000003224_21743cztM0_level2_quad_clean.evt |
| Size (bytes) | 680,376,960 | 97,822,080 |
| Size | 648.9 MB | 93.3 MB |
| Events in quadrant A | 6,742,029 | 605,375 |
| Events in quadrant B | 3,837,250 | 672,021 |
| Events in quadrant C | 3,270,527 | 637,129 |
| Events in quadrant D | 6,305,814 | 584,504 |
| Mode M9 | |||
|---|---|---|---|
| Quadrant | BADHDUFLAG | Total packets | Discarded packets |
| A | 0 | 15 | 0 |
| B | 0 | 16 | 0 |
| C | 0 | 16 | 0 |
| D | 0 | 16 | 0 |
| Mode M0 | |||
|---|---|---|---|
| Quadrant | BADHDUFLAG | Total packets | Discarded packets |
| A | 0 | 24479 | 2 |
| B | 0 | 15647 | 2 |
| C | 0 | 13845 | 2 |
| D | 0 | 23361 | 2 |
| Mode SS | |||
|---|---|---|---|
| Quadrant | BADHDUFLAG | Total packets | Discarded packets |
| A | 0 | 134 | 0 |
| B | 0 | 134 | 0 |
| C | 0 | 134 | 0 |
| D | 0 | 134 | 0 |
| Quadrant | Total seconds | Saturated seconds | Saturation percentage |
|---|---|---|---|
| A | 6641 | 1938 | 29.182352% |
| B | 6641 | 165 | 2.484566% |
| C | 6641 | 80 | 1.204638% |
| D | 6641 | 744 | 11.203132% |
Noise dominated data is calculated using 1-second bins in cleaned event files. If a bin has >2000 counts, and if more than 50% of those come from <1% of pixels, then it is considered to be noise-dominated and hence unusable.
| Quadrant | # 1 sec bins | Bins with >0 counts | Bins with >2000 counts | High rate bins dominated by noise | Noise dominated (total time) | Noise dominated (detector-on time) | Marked lightcurve |
|---|---|---|---|---|---|---|---|
| A | 7626 | 6641 | 1114 | 1114 | 14.61% | 16.77% | 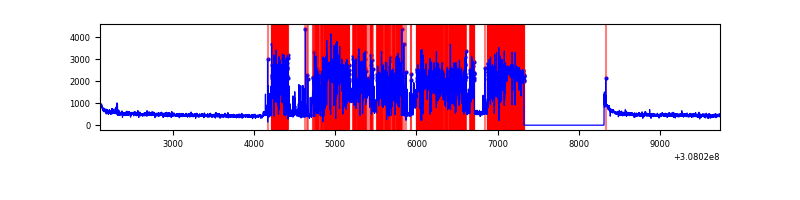 |
| B | 7626 | 6642 | 52 | 52 | 0.68% | 0.78% | 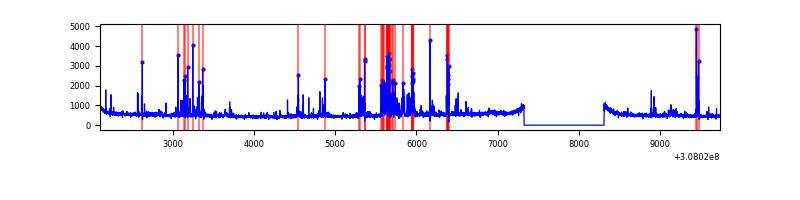 |
| C | 7626 | 6642 | 0 | 0 | 0.00% | 0.00% | 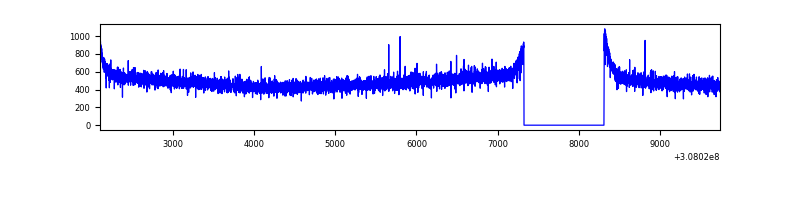 |
| D | 7626 | 6642 | 454 | 454 | 5.95% | 6.84% | 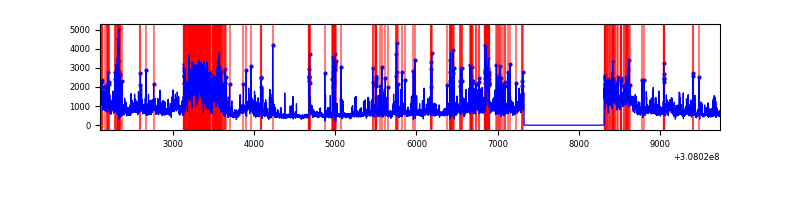 |
Top three noisy pixels from each quadrant. If the there are fewer than three noisy pixels in the level2.evt file, extra rows are filled as -1
| Pixel properties | Quadrant properties | ||||||
|---|---|---|---|---|---|---|---|
| Quadrant | DetID | PixID | Counts | Sigma | Mean | Median | Sigma |
| A | 15 | 236 | 4018857 | 28335.08 | 706 | 693 | 141.8 |
| A | 13 | 254 | 10211 | 67.12 | 706 | 693 | 141.8 |
| A | 0 | 226 | 6044 | 37.73 | 706 | 693 | 141.8 |
| B | 6 | 36 | 255484 | 1590.65 | 839 | 820 | 160.1 |
| B | 3 | 64 | 151530 | 941.35 | 839 | 820 | 160.1 |
| B | 0 | 190 | 33654 | 205.08 | 839 | 820 | 160.1 |
| C | 14 | 238 | 125283 | 656.92 | 807 | 816 | 189.5 |
| C | 13 | 61 | 5523 | 24.84 | 807 | 816 | 189.5 |
| C | 10 | 23 | 2207 | 7.34 | 807 | 816 | 189.5 |
| D | 7 | 238 | 1819867 | 9588.83 | 779 | 758 | 189.7 |
| D | 1 | 52 | 680617 | 3583.65 | 779 | 758 | 189.7 |
| D | 12 | 235 | 566545 | 2982.36 | 779 | 758 | 189.7 |
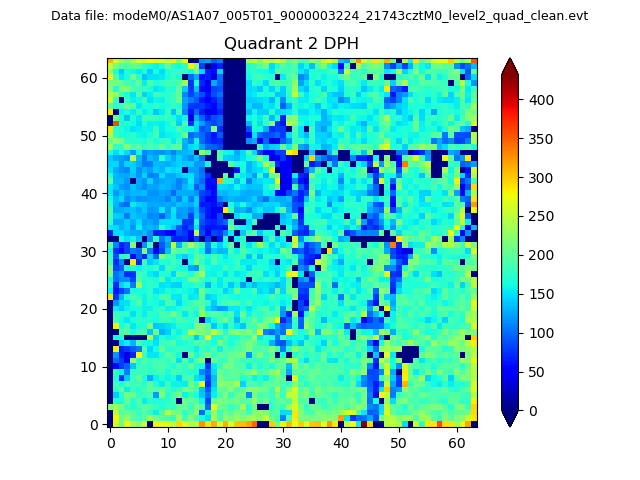
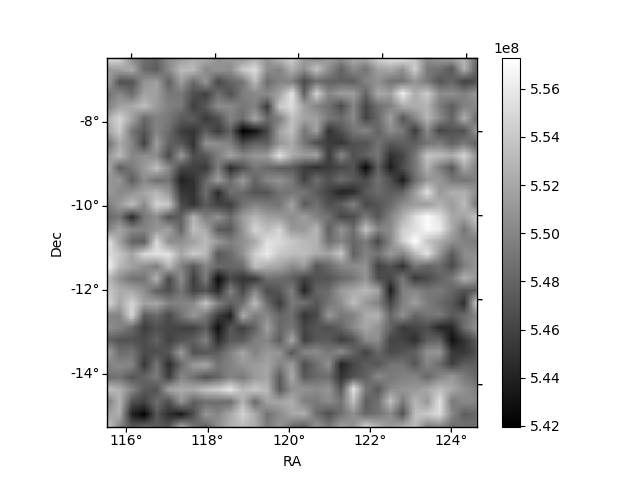
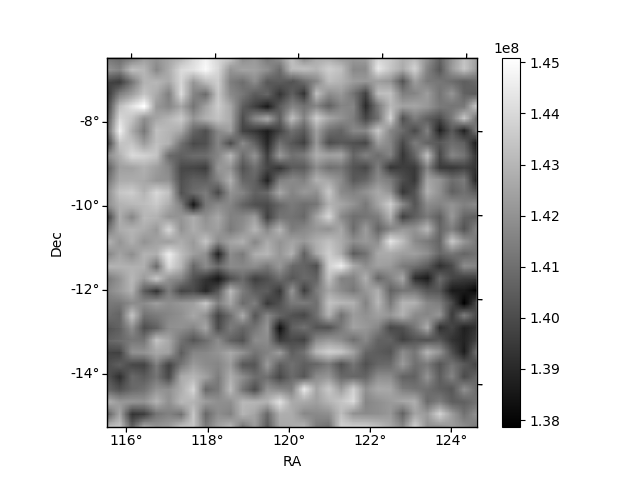
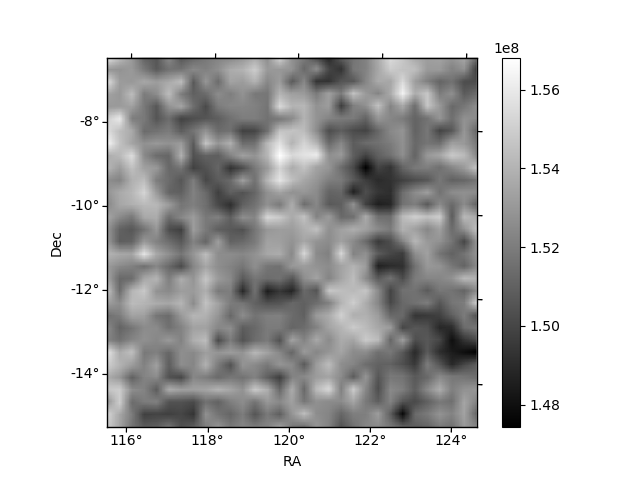
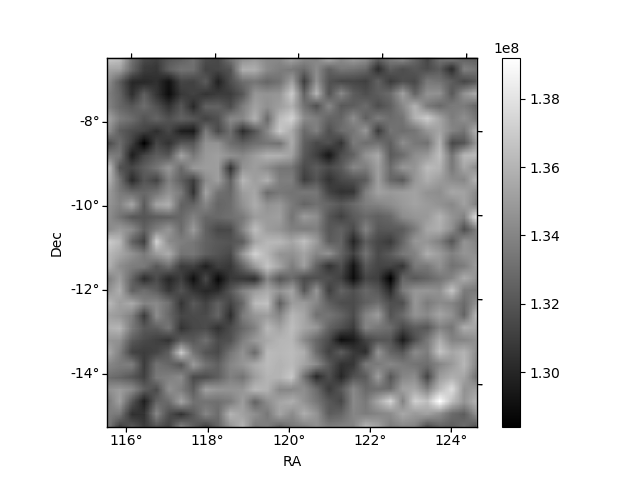
Histogram calculated using DETX and DETY for each event in the final _common_clean file
| Quadrant A | 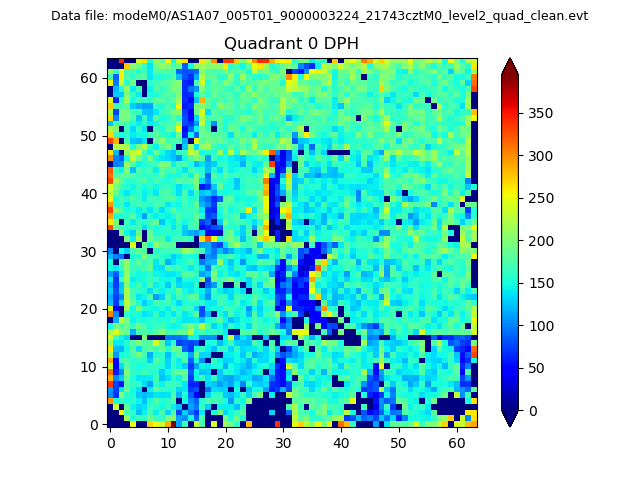 |
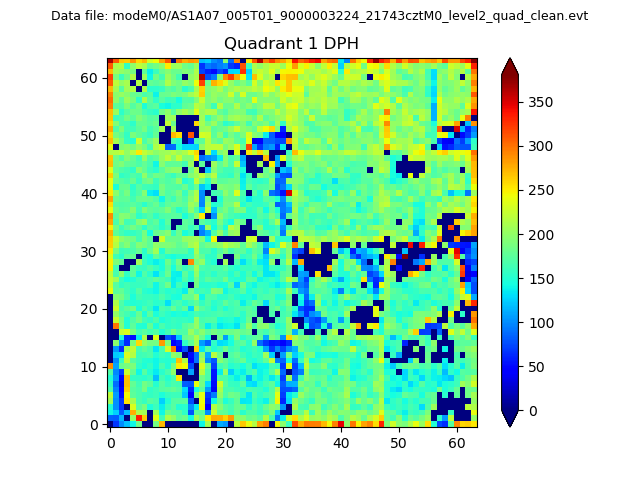 |
Quadrant B |
|---|---|---|---|
| Quadrant D | 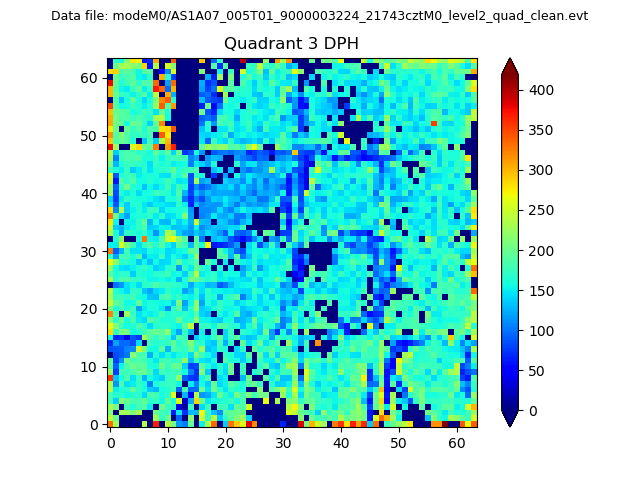 |
 |
Quadrant C |
| Plot type | Count rate plots | Images |
|---|---|---|
| Comparison with Poisson distribution Blue bars denote a histogram of data divided into 1 sec bins. Red curve is a Poisson curve with rate = median count rate of data. |
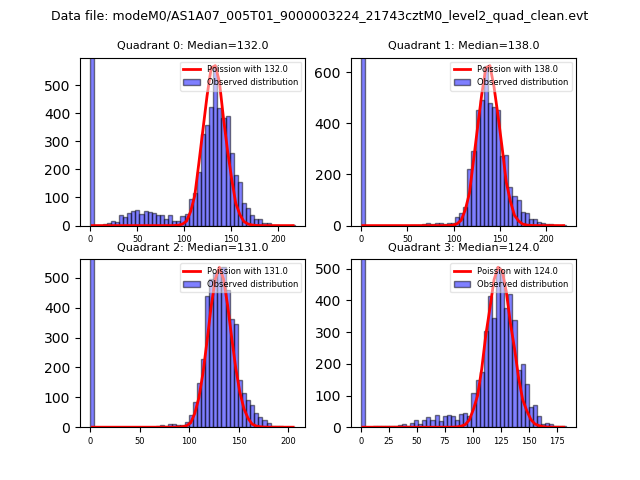 |
 |
| Quadrant-wise count rates Data is divided into 100 sec bins |
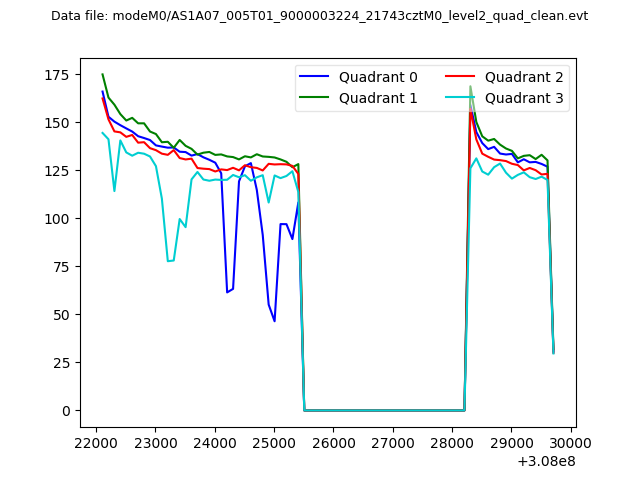 |
|
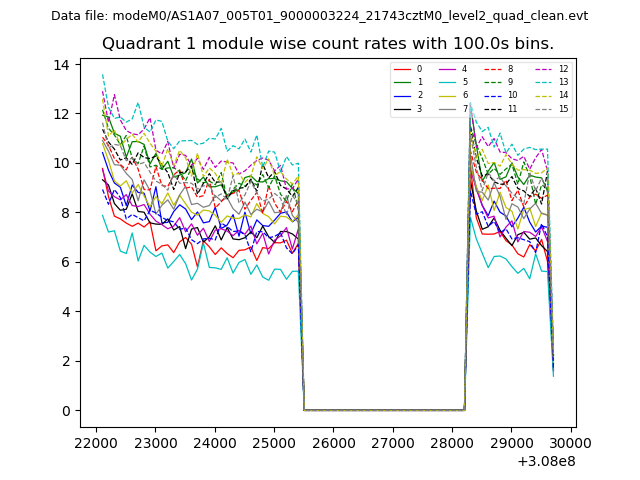
| Module-wise count rates for Quadrant A Data is divided into 100 sec bins |
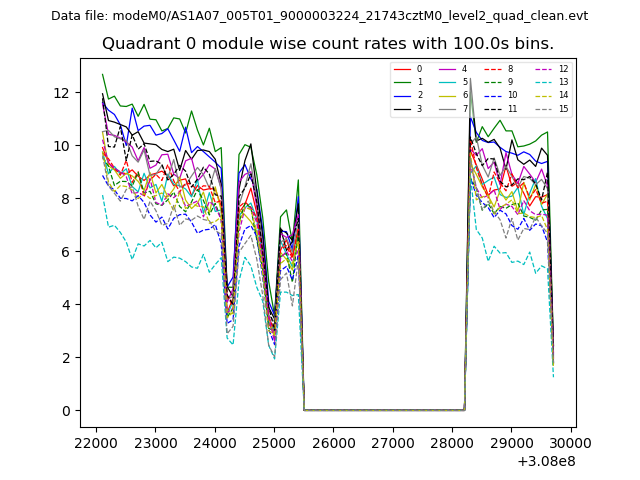 |
 |
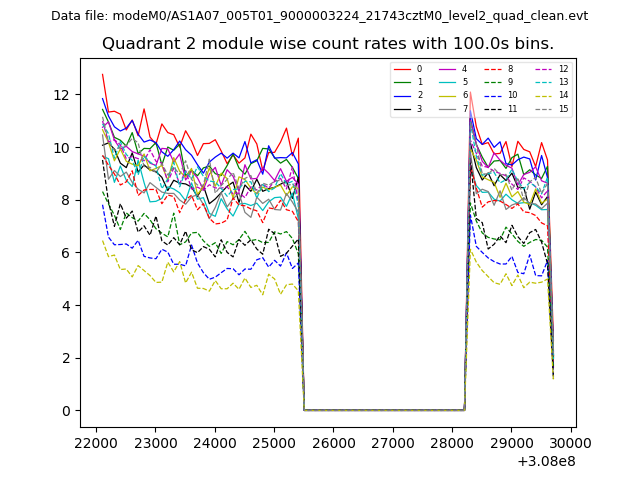
| Module-wise count rates for Quadrant B Data is divided into 100 sec bins |
 |
 |
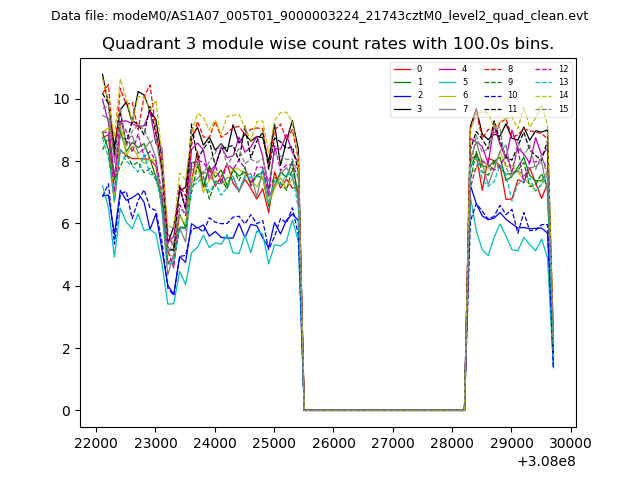
| Module-wise count rates for Quadrant C Data is divided into 100 sec bins |
 |
 |
| Module-wise count rates for Quadrant D Data is divided into 100 sec bins |
 |
 |
| Parameter | Plot |
|---|---|
| CZT HV Monitor | 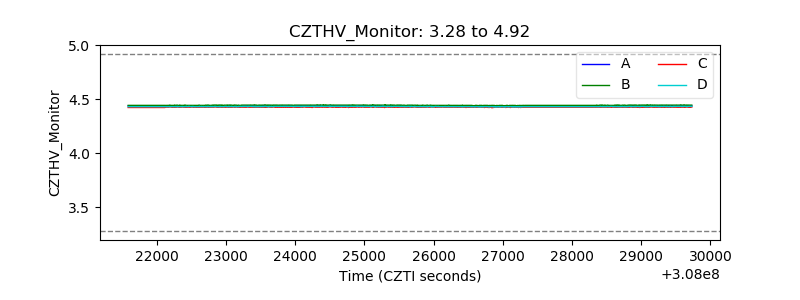 |
| D_VDD | 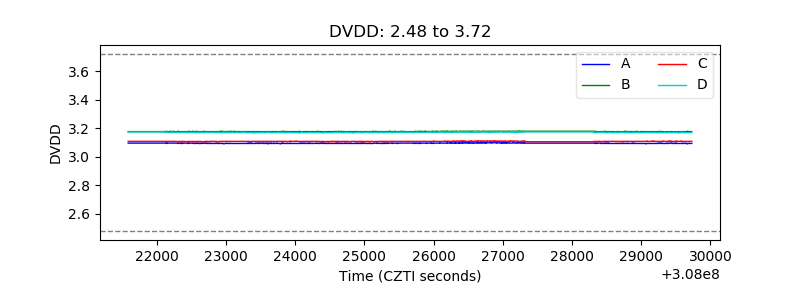 |
| Temperature 1 | 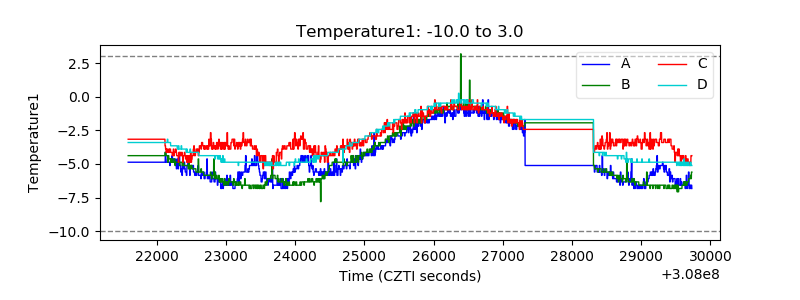 |
| Veto HV Monitor |  |
| Veto LLD | 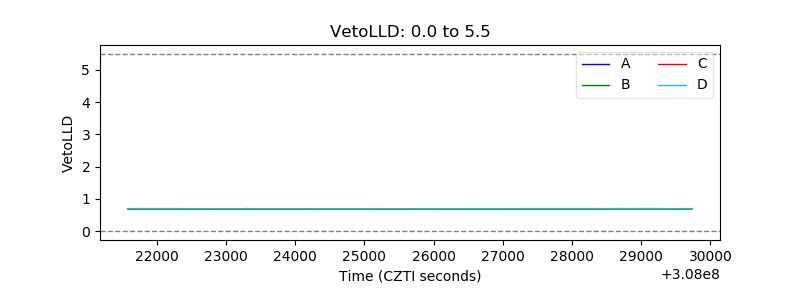 |
| Alpha Counter | 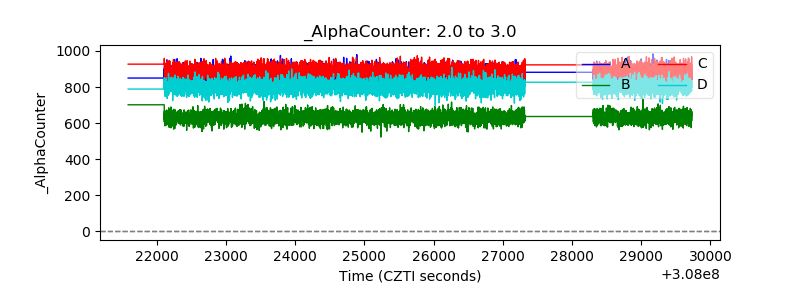 |
| _CPM_Rate | 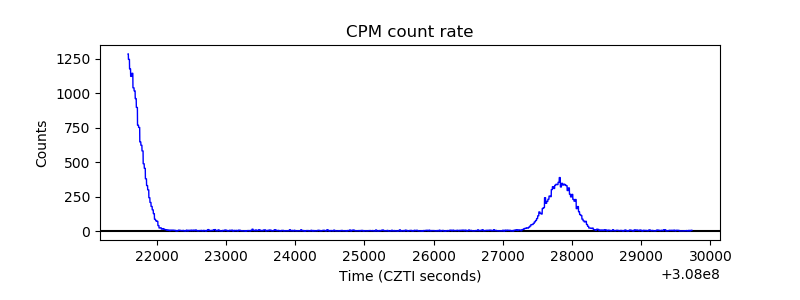 |
| CZT Counter | 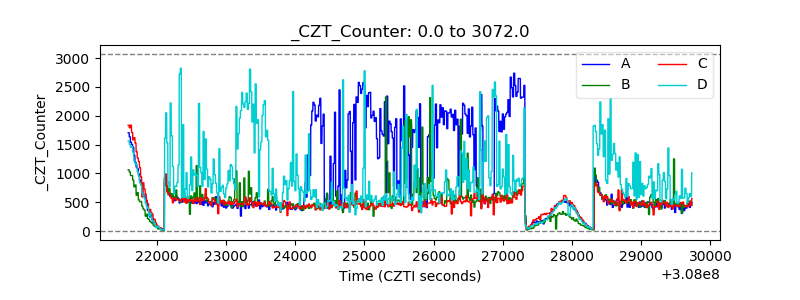 |
| +2.5 Volts monitor | 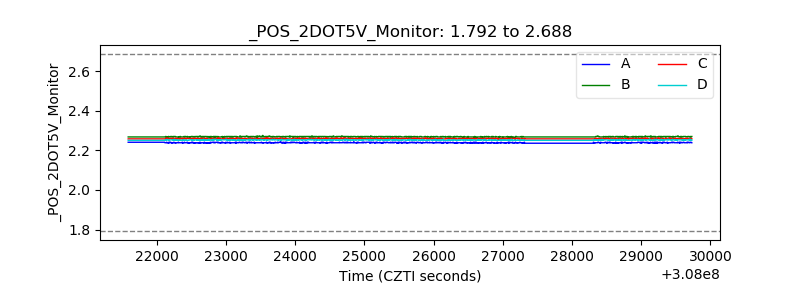 |
| +5 Volts monitor |  |
| _ROLL_ROT | 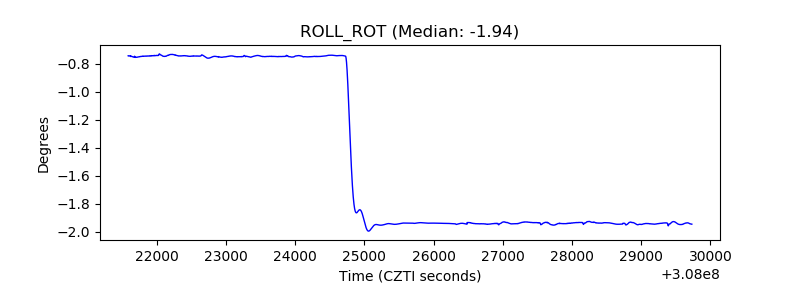 |
| _Roll_DEC | 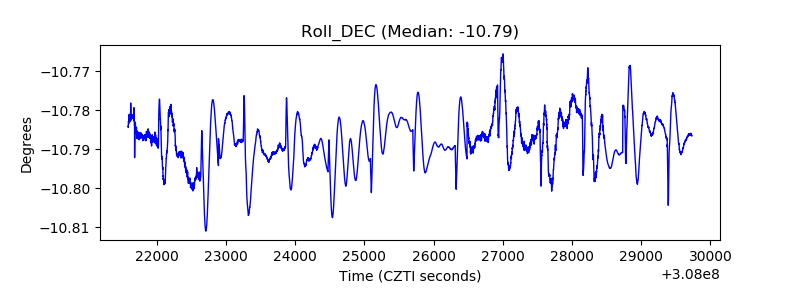 |
| _Roll_RA | 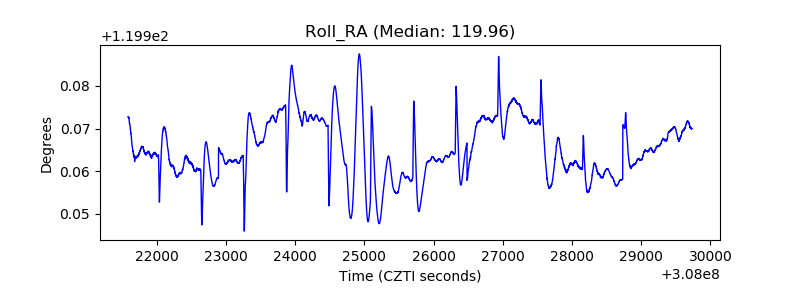 |
| Veto Counter | 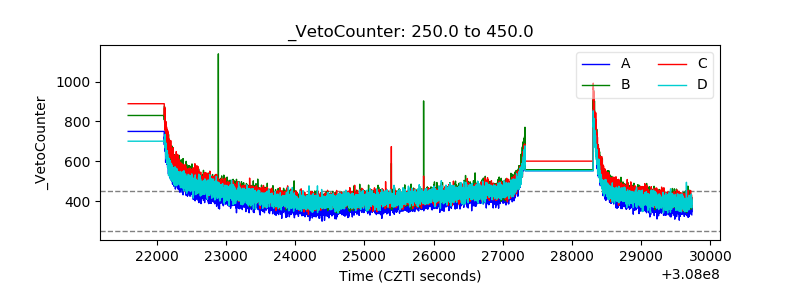 |