| Param | Original file | Final file |
|---|---|---|
| Filename | modeM0/AS1A07_005T01_9000003224_21746cztM0_level2.evt | modeM0/AS1A07_005T01_9000003224_21746cztM0_level2_quad_clean.evt |
| Size (bytes) | 203,852,160 | 32,618,880 |
| Size | 194.4 MB | 31.1 MB |
| Events in quadrant A | 1,333,425 | 195,650 |
| Events in quadrant B | 1,563,422 | 196,240 |
| Events in quadrant C | 1,349,307 | 193,168 |
| Events in quadrant D | 1,714,999 | 182,364 |
| Mode M0 | |||
|---|---|---|---|
| Quadrant | BADHDUFLAG | Total packets | Discarded packets |
| A | 0 | 9308 | 3238 |
| B | 0 | 10144 | 3554 |
| C | 0 | 9156 | 3094 |
| D | 0 | 11423 | 4364 |
| Mode SS | |||
|---|---|---|---|
| Quadrant | BADHDUFLAG | Total packets | Discarded packets |
| A | 0 | 140028184017800 | 46 |
| B | 0 | -1 | -1 |
| C | 0 | -1 | -1 |
| D | 0 | -1 | -1 |
| Quadrant | Total seconds | Saturated seconds | Saturation percentage |
|---|---|---|---|
| A | 3014 | 3 | 0.099536% |
| B | 2983 | 30 | 1.005699% |
| C | 3026 | 10 | 0.330469% |
| D | 2937 | 23 | 0.783112% |
Noise dominated data is calculated using 1-second bins in cleaned event files. If a bin has >2000 counts, and if more than 50% of those come from <1% of pixels, then it is considered to be noise-dominated and hence unusable.
| Quadrant | # 1 sec bins | Bins with >0 counts | Bins with >2000 counts | High rate bins dominated by noise | Noise dominated (total time) | Noise dominated (detector-on time) | Marked lightcurve |
|---|---|---|---|---|---|---|---|
| A | 4597 | 3368 | 0 | 0 | 0.00% | 0.00% | 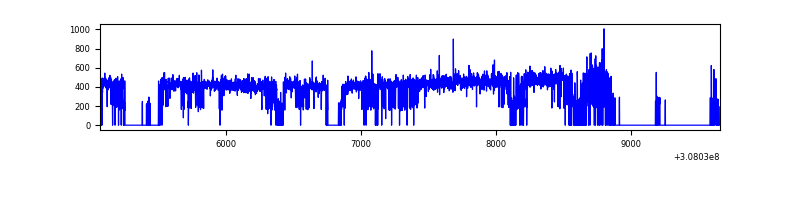 |
| B | 4588 | 3297 | 15 | 15 | 0.33% | 0.45% | 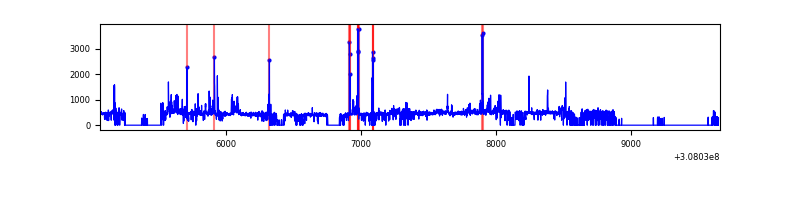 |
| C | 4596 | 3361 | 0 | 0 | 0.00% | 0.00% | 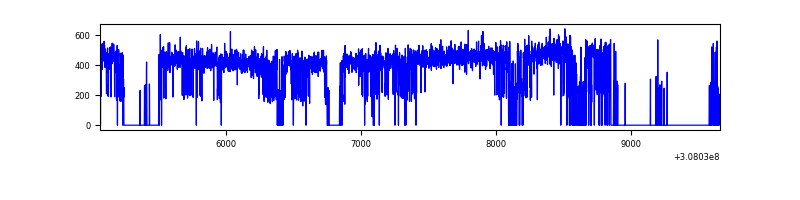 |
| D | 4583 | 3294 | 16 | 16 | 0.35% | 0.49% | 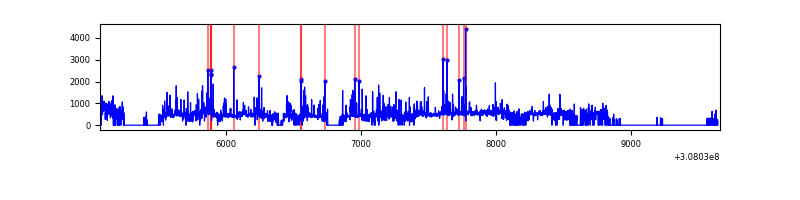 |
Top three noisy pixels from each quadrant. If the there are fewer than three noisy pixels in the level2.evt file, extra rows are filled as -1
| Pixel properties | Quadrant properties | ||||||
|---|---|---|---|---|---|---|---|
| Quadrant | DetID | PixID | Counts | Sigma | Mean | Median | Sigma |
| A | 6 | 16 | 6862 | 92.34 | 342 | 335 | 70.7 |
| A | 13 | 254 | 5180 | 68.55 | 342 | 335 | 70.7 |
| A | 13 | 252 | 3319 | 42.22 | 342 | 335 | 70.7 |
| B | 3 | 64 | 141240 | 2121.26 | 338 | 329 | 66.4 |
| B | 0 | 230 | 30158 | 449.04 | 338 | 329 | 66.4 |
| B | 0 | 190 | 26747 | 397.69 | 338 | 329 | 66.4 |
| C | 14 | 238 | 51850 | 650.61 | 332 | 335 | 79.2 |
| C | 13 | 61 | 2378 | 25.8 | 332 | 335 | 79.2 |
| C | 15 | 78 | 827 | 6.21 | 332 | 335 | 79.2 |
| D | 1 | 52 | 223383 | 2736.37 | 328 | 319 | 81.5 |
| D | 7 | 238 | 130631 | 1598.56 | 328 | 319 | 81.5 |
| D | 13 | 153 | 36873 | 448.42 | 328 | 319 | 81.5 |
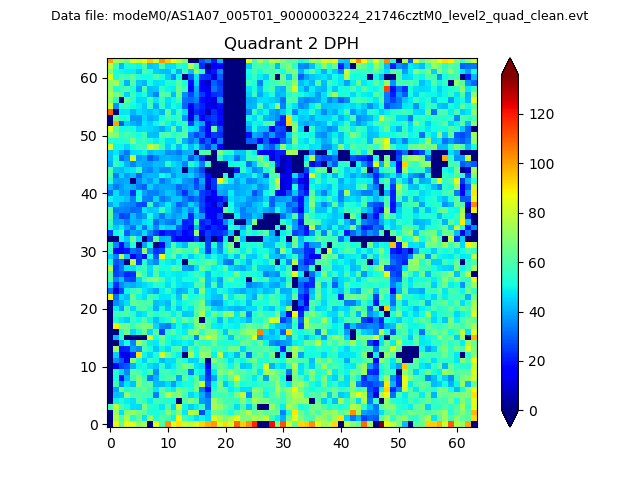
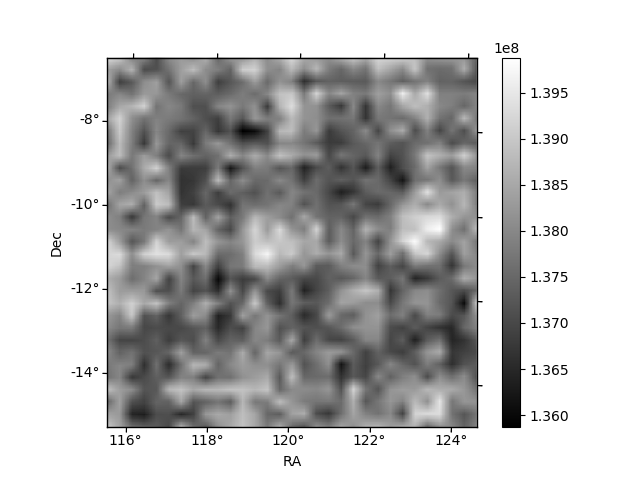
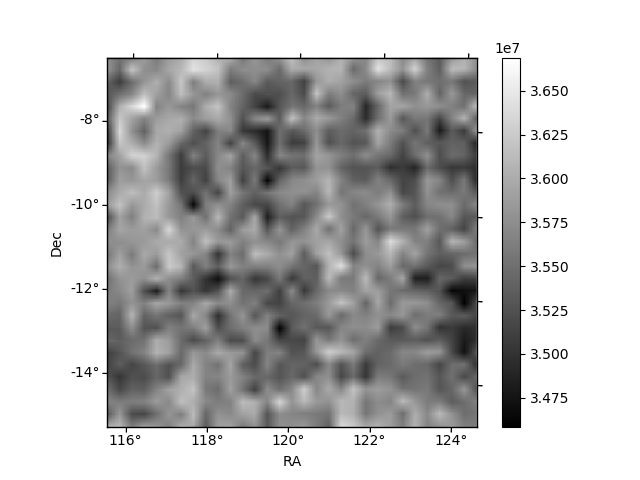
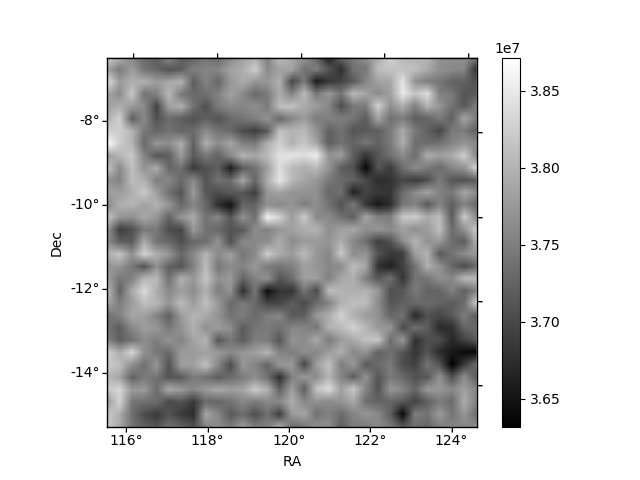
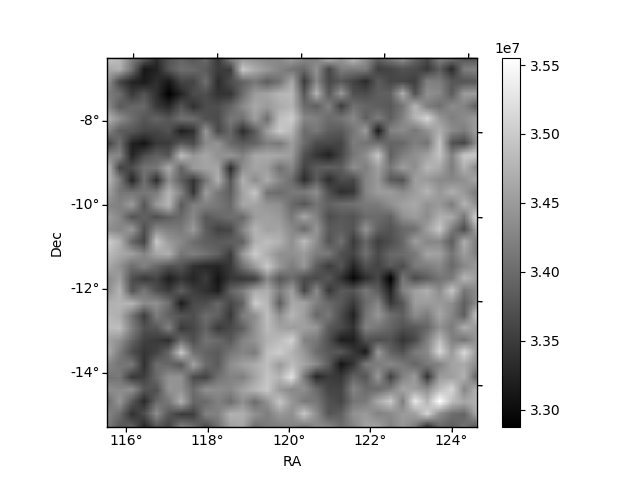
Histogram calculated using DETX and DETY for each event in the final _common_clean file
| Quadrant A | 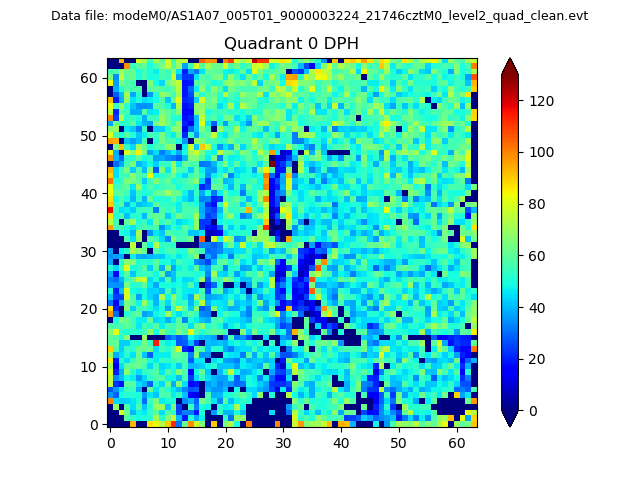 |
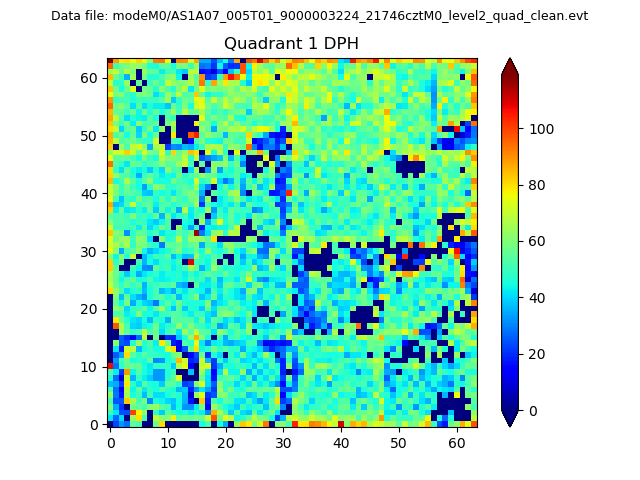 |
Quadrant B |
|---|---|---|---|
| Quadrant D | 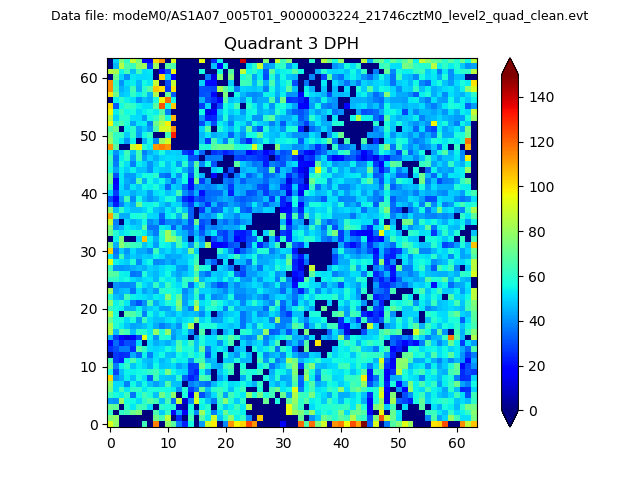 |
 |
Quadrant C |
| Plot type | Count rate plots | Images |
|---|---|---|
| Comparison with Poisson distribution Blue bars denote a histogram of data divided into 1 sec bins. Red curve is a Poisson curve with rate = median count rate of data. |
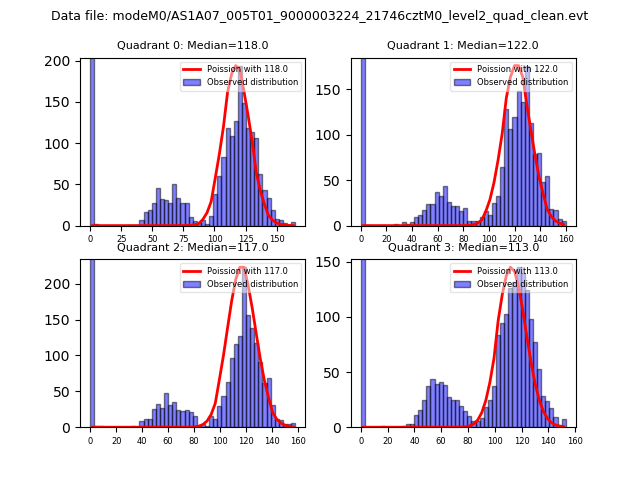 |
 |
| Quadrant-wise count rates Data is divided into 100 sec bins |
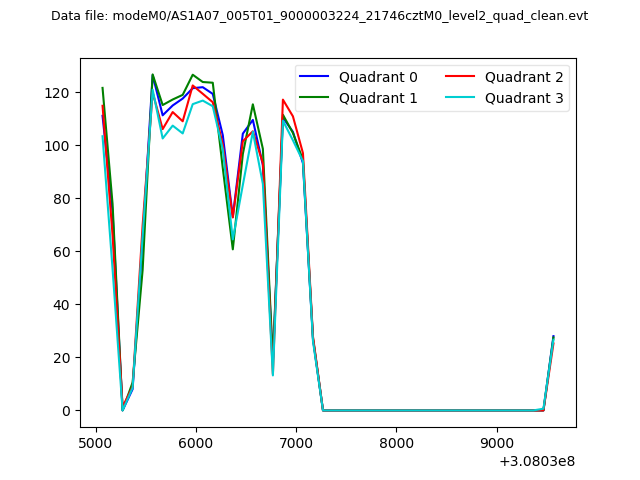 |
|
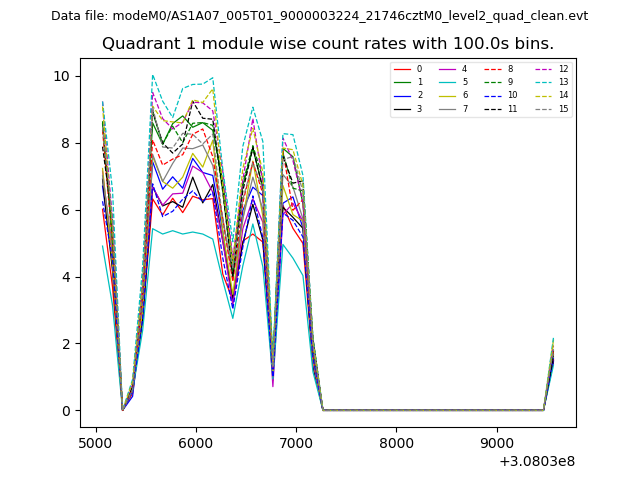
| Module-wise count rates for Quadrant A Data is divided into 100 sec bins |
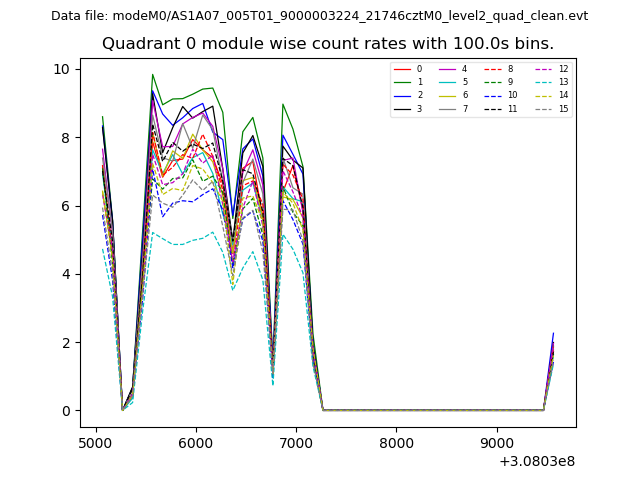 |
 |
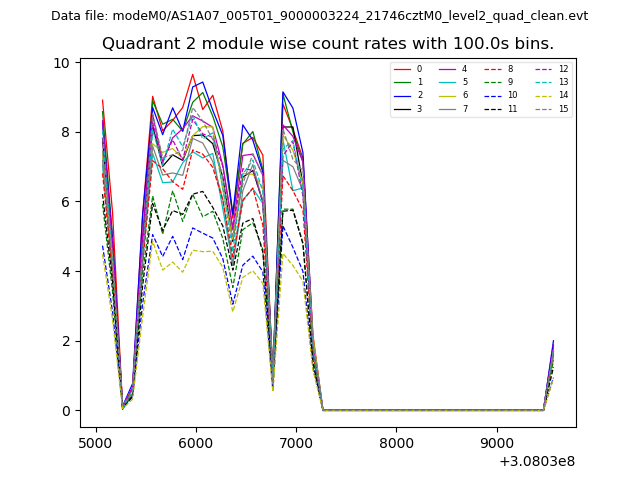
| Module-wise count rates for Quadrant B Data is divided into 100 sec bins |
 |
 |
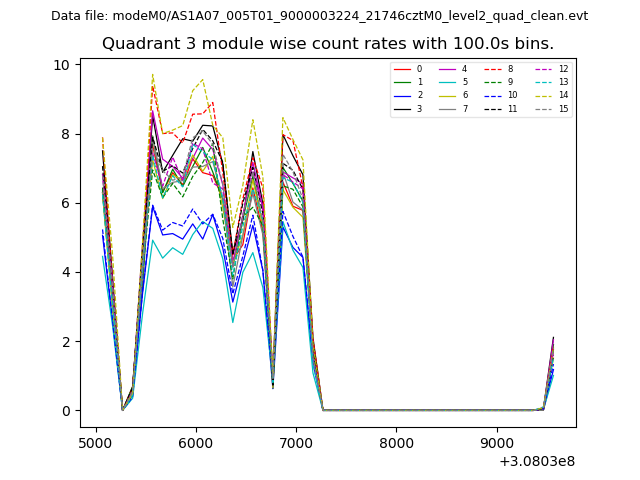
| Module-wise count rates for Quadrant C Data is divided into 100 sec bins |
 |
 |
| Module-wise count rates for Quadrant D Data is divided into 100 sec bins |
 |
 |
| Parameter | Plot |
|---|---|
| CZT HV Monitor | 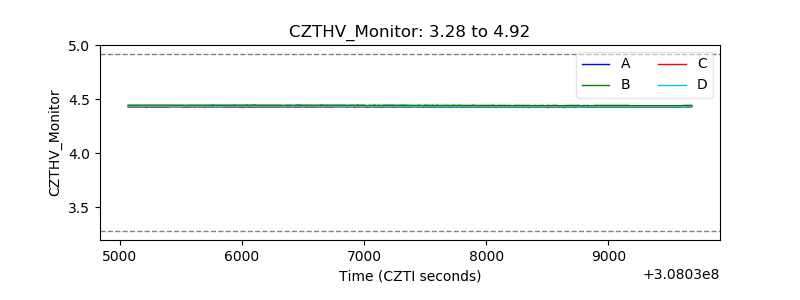 |
| D_VDD | 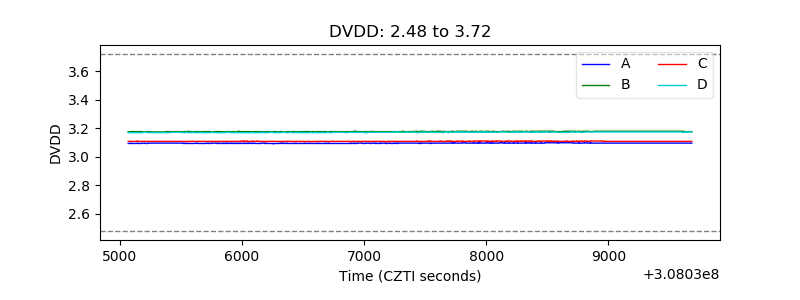 |
| Temperature 1 | 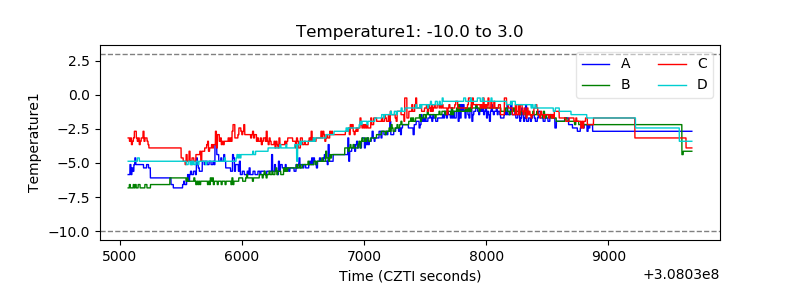 |
| Veto HV Monitor | 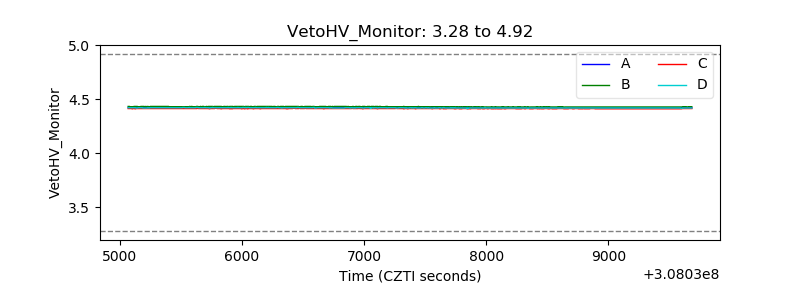 |
| Veto LLD | 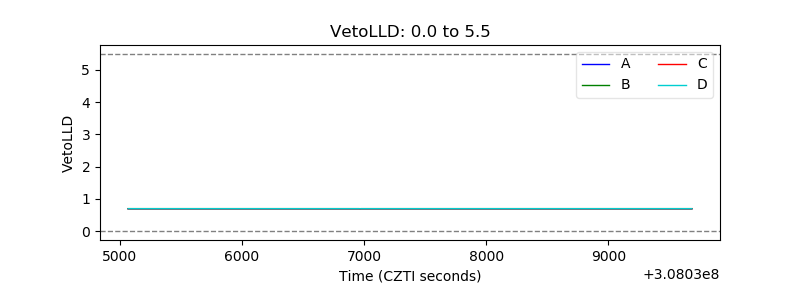 |
| Alpha Counter | 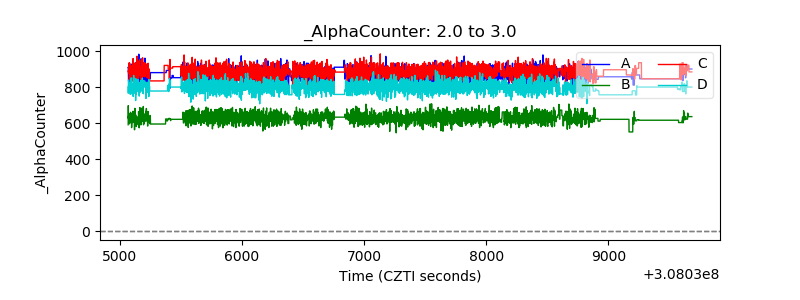 |
| _CPM_Rate | 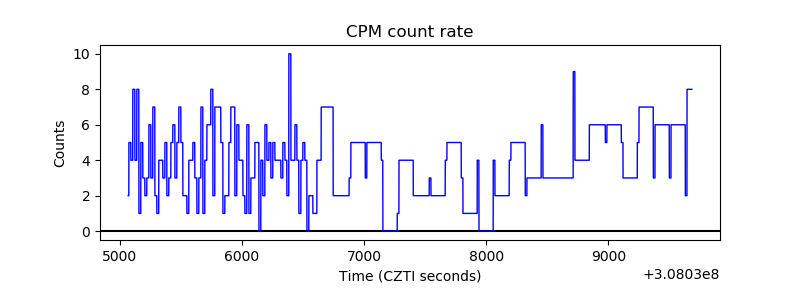 |
| CZT Counter | 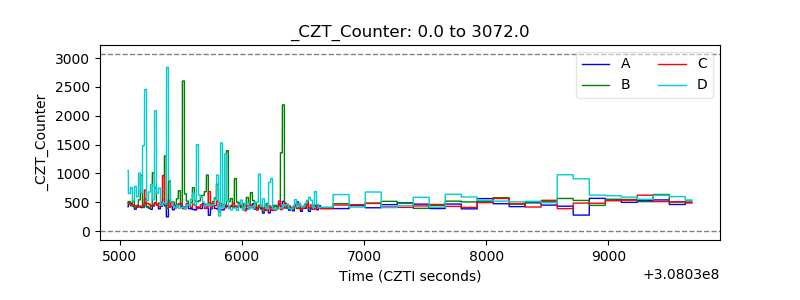 |
| +2.5 Volts monitor |  |
| +5 Volts monitor |  |
| _ROLL_ROT | 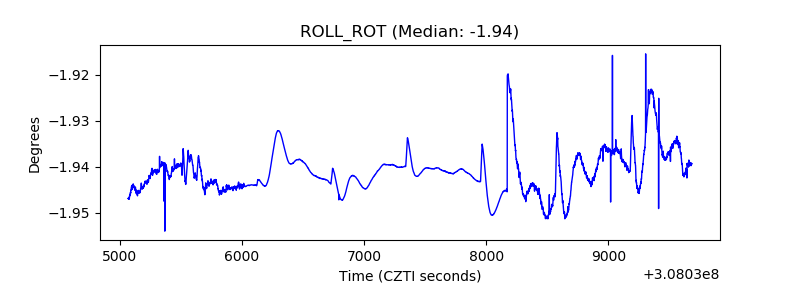 |
| _Roll_DEC | 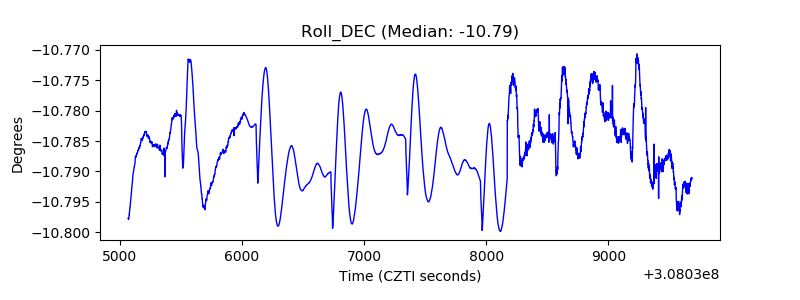 |
| _Roll_RA | 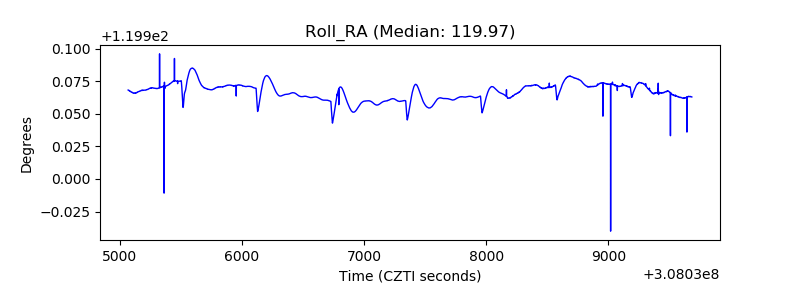 |
| Veto Counter | 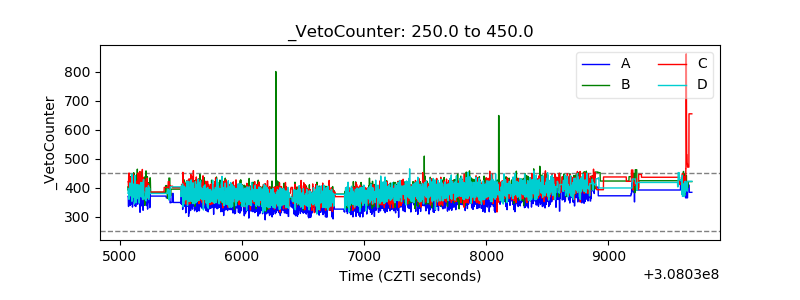 |