| Param | Original file | Final file |
|---|---|---|
| Filename | modeM0/AS1A07_005T01_9000003224_21749cztM0_level2.evt | modeM0/AS1A07_005T01_9000003224_21749cztM0_level2_quad_clean.evt |
| Size (bytes) | 1,783,615,680 | 183,648,960 |
| Size | 1.7 GB | 175.1 MB |
| Events in quadrant A | 7,921,721 | 1,178,857 |
| Events in quadrant B | 8,350,157 | 1,206,707 |
| Events in quadrant C | 7,594,178 | 1,150,637 |
| Events in quadrant D | 29,071,191 | 918,193 |
| Mode M9 | |||
|---|---|---|---|
| Quadrant | BADHDUFLAG | Total packets | Discarded packets |
| A | 0 | 13 | 0 |
| B | 0 | 13 | 0 |
| C | 0 | 13 | 0 |
| D | 0 | 13 | 0 |
| Mode M0 | |||
|---|---|---|---|
| Quadrant | BADHDUFLAG | Total packets | Discarded packets |
| A | 0 | 33614 | 3 |
| B | 0 | 34512 | 3 |
| C | 0 | 32700 | 3 |
| D | 0 | 97424 | 3 |
| Mode SS | |||
|---|---|---|---|
| Quadrant | BADHDUFLAG | Total packets | Discarded packets |
| A | 0 | 326 | 0 |
| B | 0 | 326 | 0 |
| C | 0 | 326 | 0 |
| D | 0 | 326 | 0 |
| Quadrant | Total seconds | Saturated seconds | Saturation percentage |
|---|---|---|---|
| A | 16030 | 265 | 1.653150% |
| B | 16031 | 344 | 2.145842% |
| C | 16031 | 293 | 1.827709% |
| D | 16031 | 8209 | 51.207036% |
Noise dominated data is calculated using 1-second bins in cleaned event files. If a bin has >2000 counts, and if more than 50% of those come from <1% of pixels, then it is considered to be noise-dominated and hence unusable.
| Quadrant | # 1 sec bins | Bins with >0 counts | Bins with >2000 counts | High rate bins dominated by noise | Noise dominated (total time) | Noise dominated (detector-on time) | Marked lightcurve |
|---|---|---|---|---|---|---|---|
| A | 17340 | 16033 | 20 | 20 | 0.12% | 0.12% | 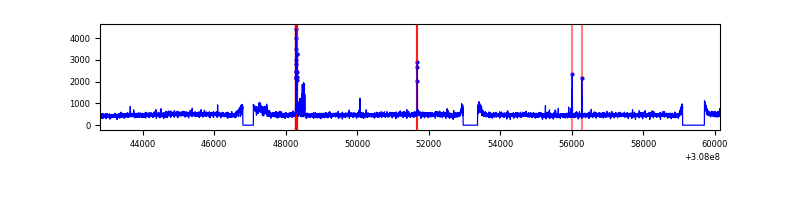 |
| B | 17341 | 16034 | 42 | 42 | 0.24% | 0.26% | 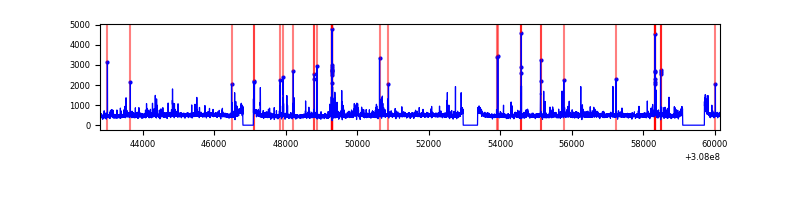 |
| C | 17341 | 16034 | 0 | 0 | 0.00% | 0.00% | 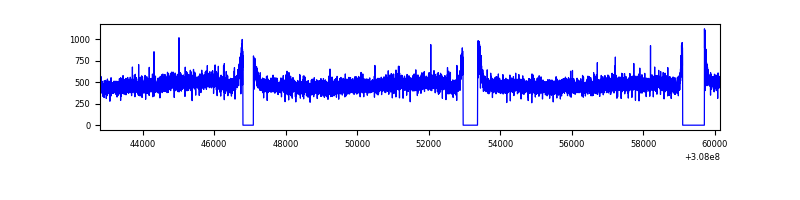 |
| D | 17341 | 16032 | 6747 | 6747 | 38.91% | 42.08% | 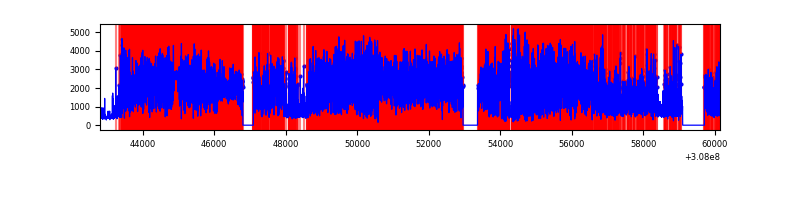 |
Top three noisy pixels from each quadrant. If the there are fewer than three noisy pixels in the level2.evt file, extra rows are filled as -1
| Pixel properties | Quadrant properties | ||||||
|---|---|---|---|---|---|---|---|
| Quadrant | DetID | PixID | Counts | Sigma | Mean | Median | Sigma |
| A | 15 | 236 | 226304 | 574.24 | 1945 | 1904 | 390.8 |
| A | 13 | 170 | 171587 | 434.22 | 1945 | 1904 | 390.8 |
| A | 13 | 254 | 28419 | 67.85 | 1945 | 1904 | 390.8 |
| B | 3 | 64 | 246465 | 656.12 | 1947 | 1895 | 372.8 |
| B | 0 | 190 | 141417 | 374.3 | 1947 | 1895 | 372.8 |
| B | 0 | 189 | 110391 | 291.07 | 1947 | 1895 | 372.8 |
| C | 14 | 238 | 289794 | 652.43 | 1874 | 1878 | 441.3 |
| C | 13 | 61 | 13241 | 25.75 | 1874 | 1878 | 441.3 |
| C | 15 | 78 | 4601 | 6.17 | 1874 | 1878 | 441.3 |
| D | 7 | 238 | 20125386 | 53620.36 | 1542 | 1495 | 375.3 |
| D | 1 | 52 | 1576467 | 4196.53 | 1542 | 1495 | 375.3 |
| D | 12 | 235 | 867658 | 2307.9 | 1542 | 1495 | 375.3 |
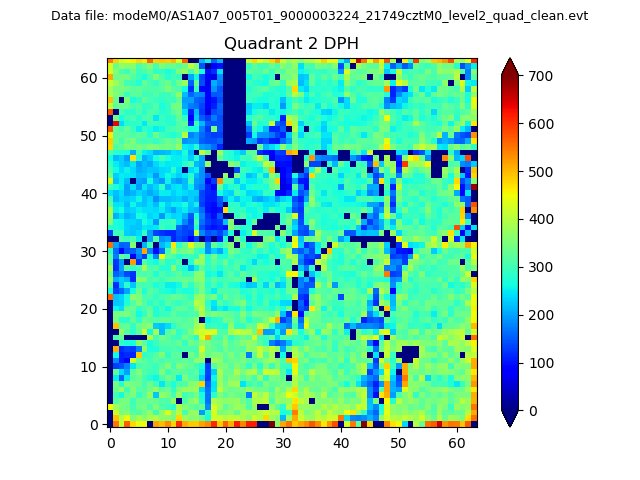
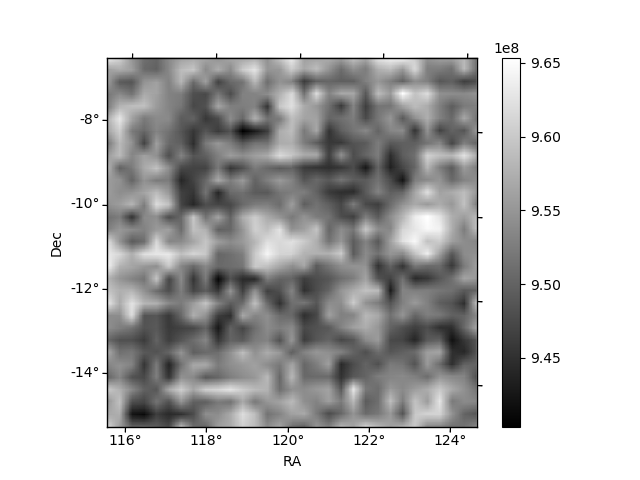
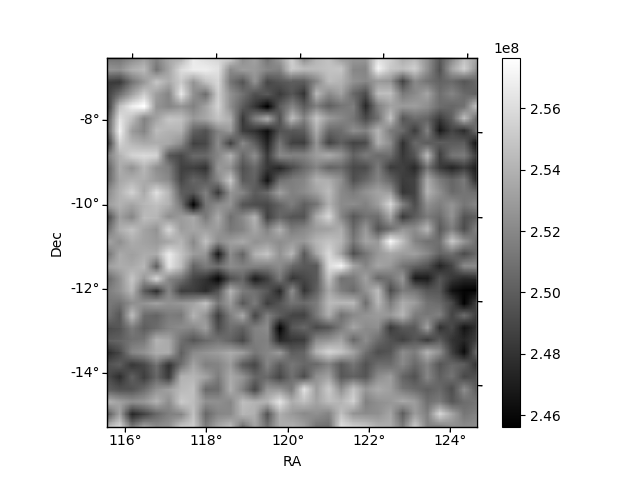
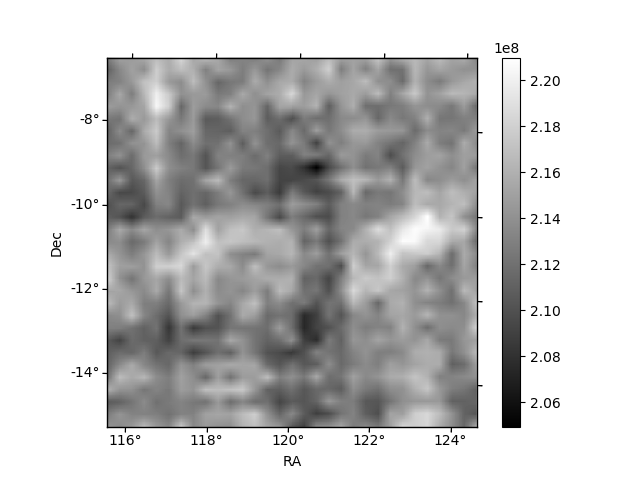
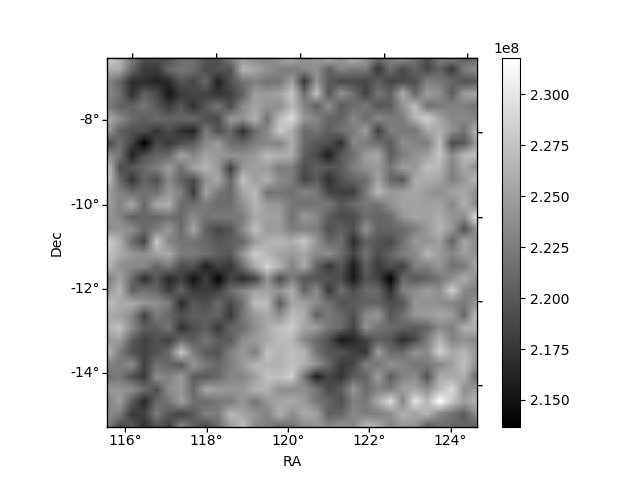
Histogram calculated using DETX and DETY for each event in the final _common_clean file
| Quadrant A | 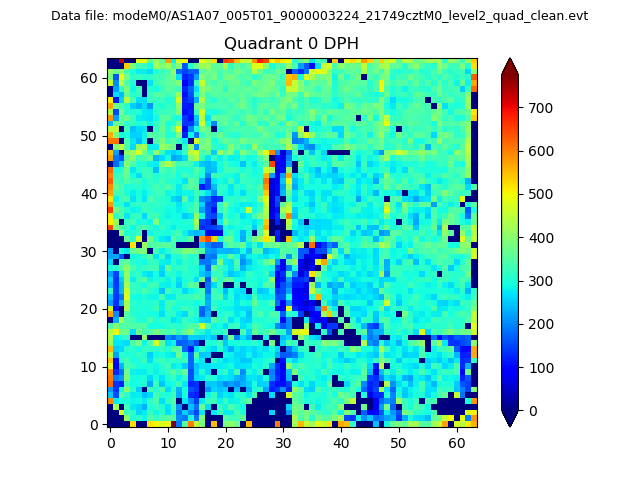 |
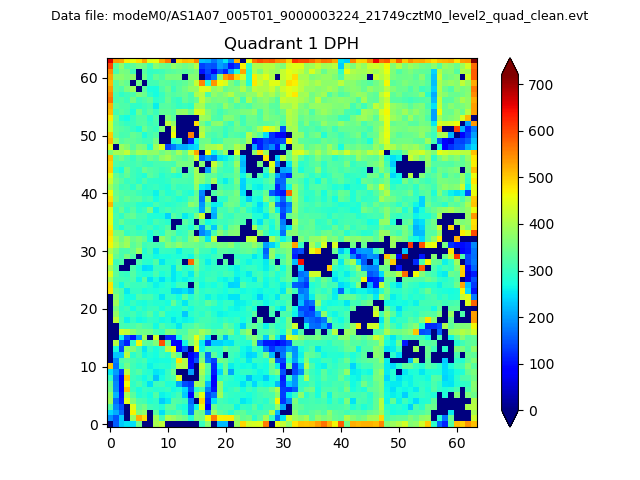 |
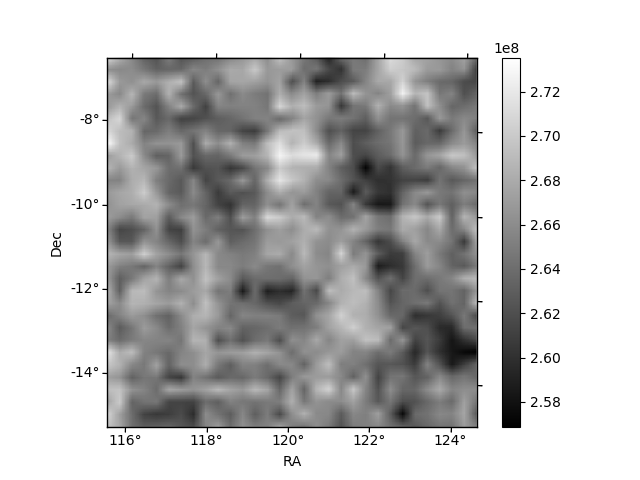
Quadrant B |
|---|---|---|---|
| Quadrant D | 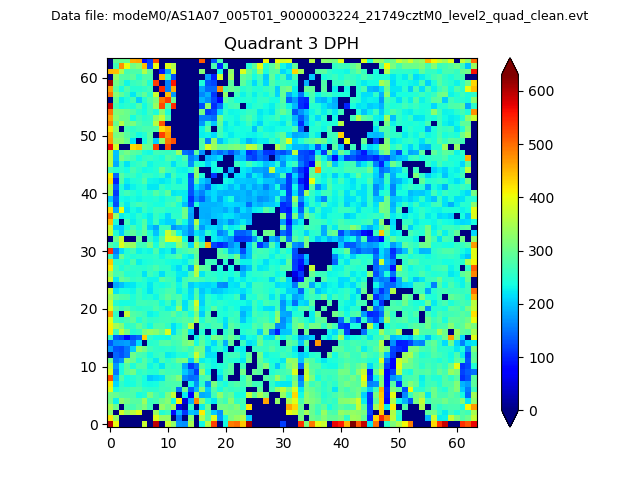 |
 |
Quadrant C |
| Plot type | Count rate plots | Images |
|---|---|---|
| Comparison with Poisson distribution Blue bars denote a histogram of data divided into 1 sec bins. Red curve is a Poisson curve with rate = median count rate of data. |
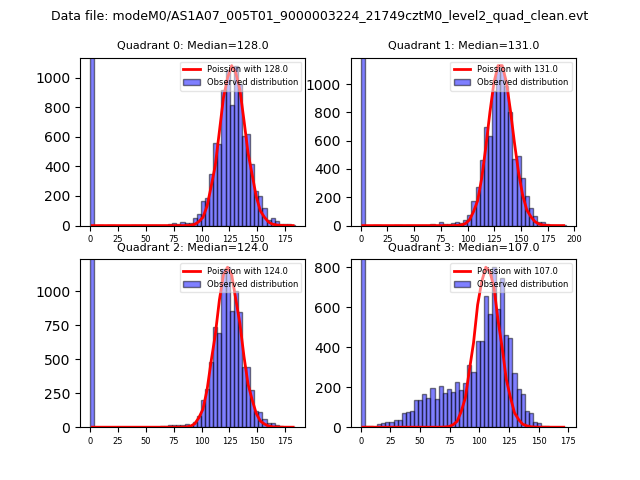 |
 |
| Quadrant-wise count rates Data is divided into 100 sec bins |
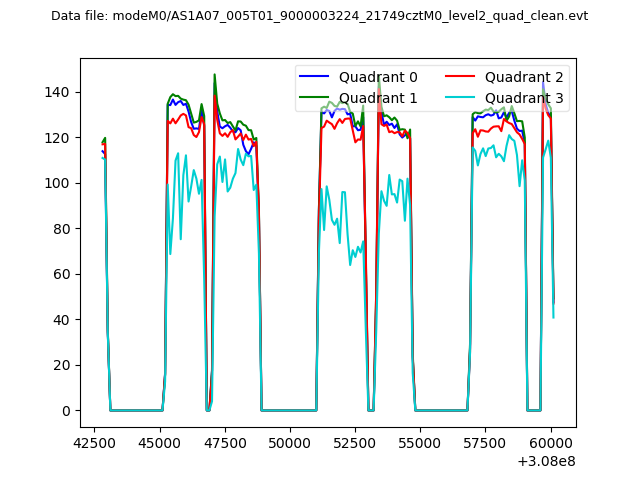 |
|
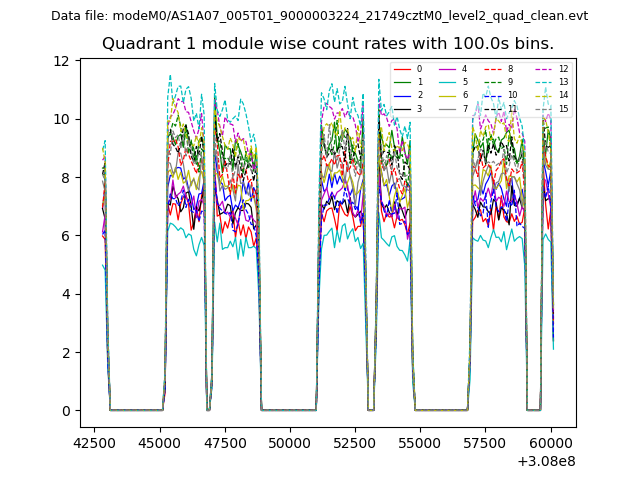
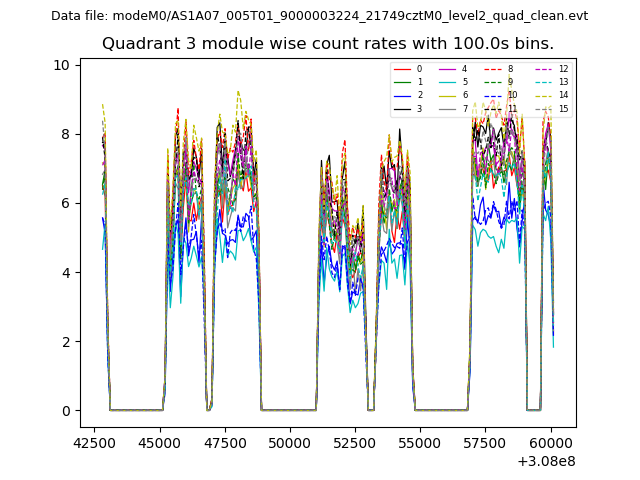
| Module-wise count rates for Quadrant A Data is divided into 100 sec bins |
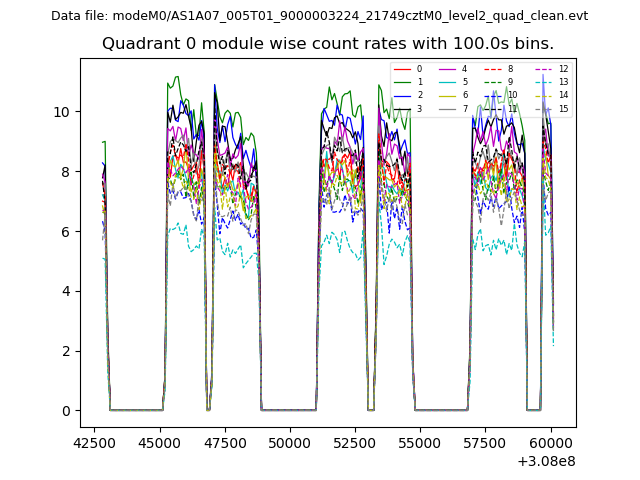 |
 |
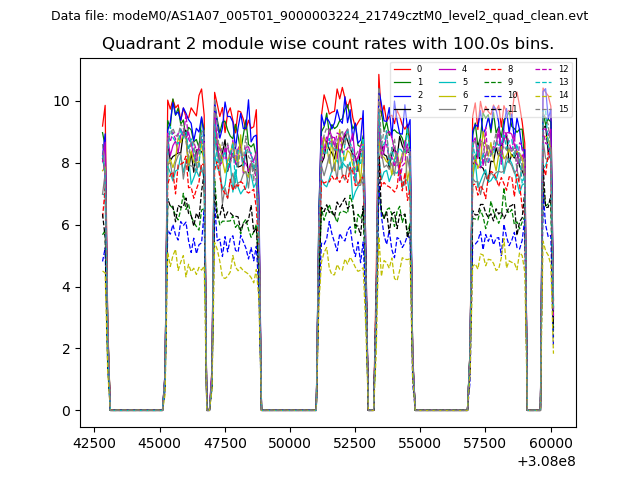
| Module-wise count rates for Quadrant B Data is divided into 100 sec bins |
 |
 |
| Module-wise count rates for Quadrant C Data is divided into 100 sec bins |
 |
 |
| Module-wise count rates for Quadrant D Data is divided into 100 sec bins |
 |
 |
| Parameter | Plot |
|---|---|
| CZT HV Monitor | 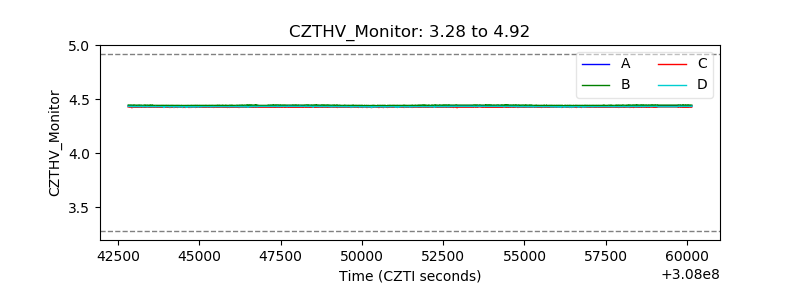 |
| D_VDD | 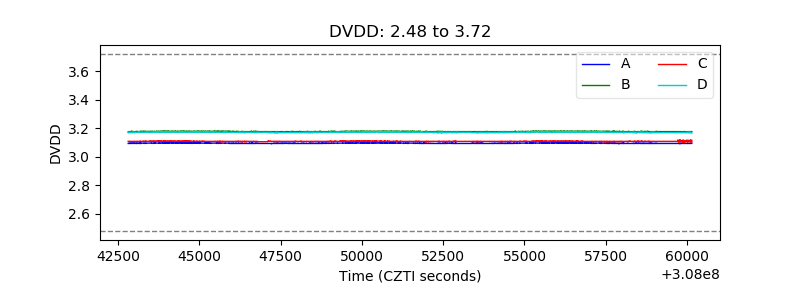 |
| Temperature 1 | 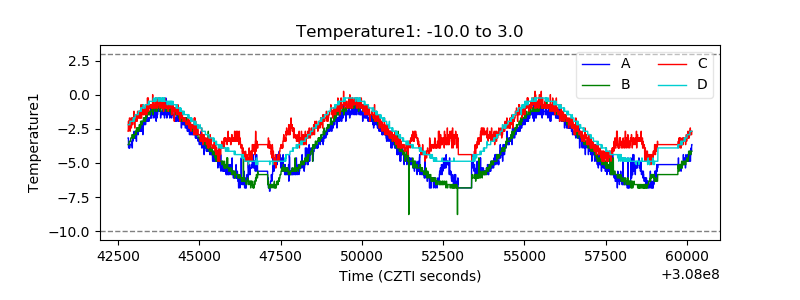 |
| Veto HV Monitor | 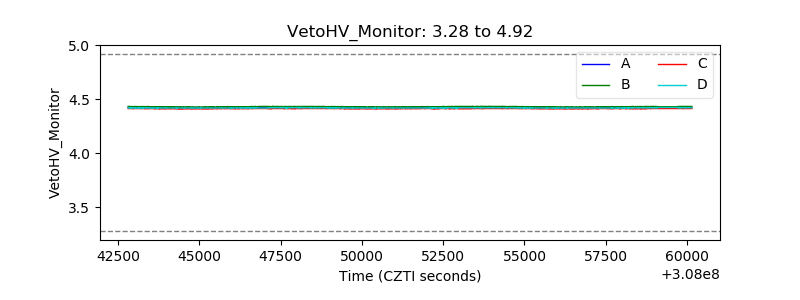 |
| Veto LLD | 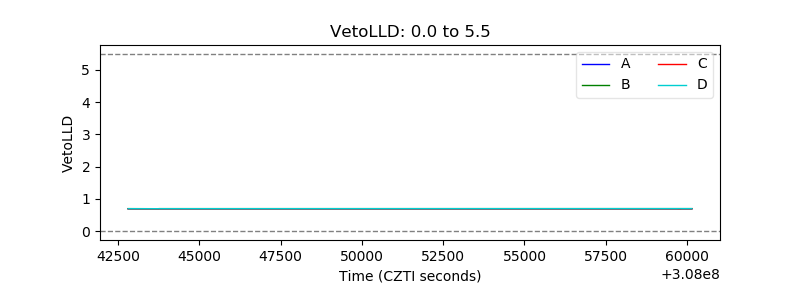 |
| Alpha Counter | 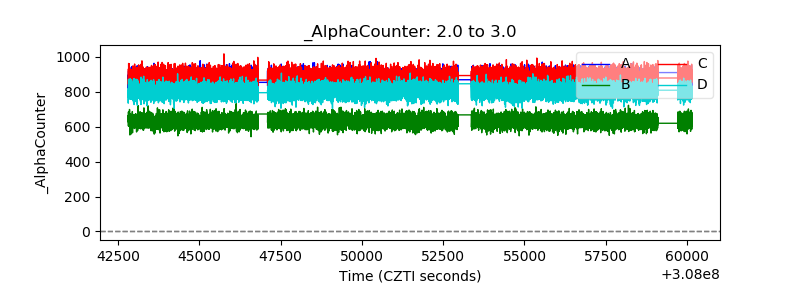 |
| _CPM_Rate | 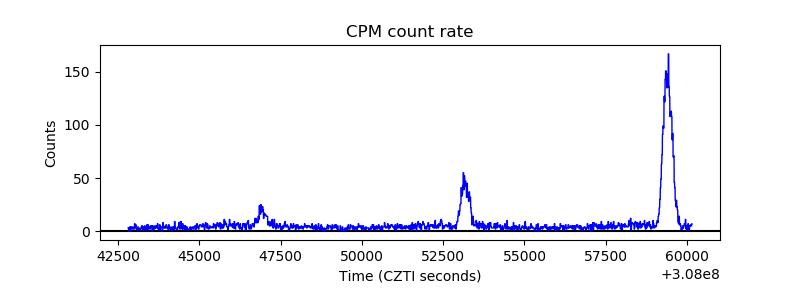 |
| CZT Counter | 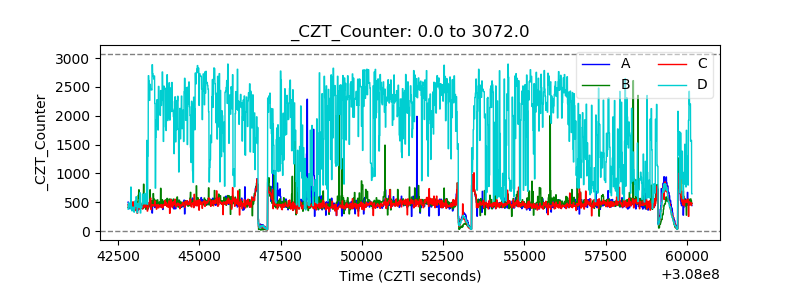 |
| +2.5 Volts monitor |  |
| +5 Volts monitor |  |
| _ROLL_ROT | 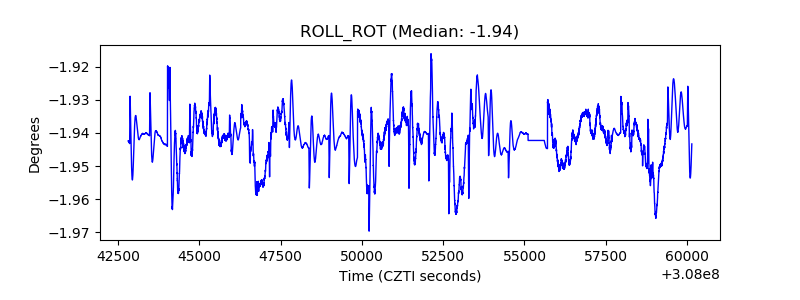 |
| _Roll_DEC | 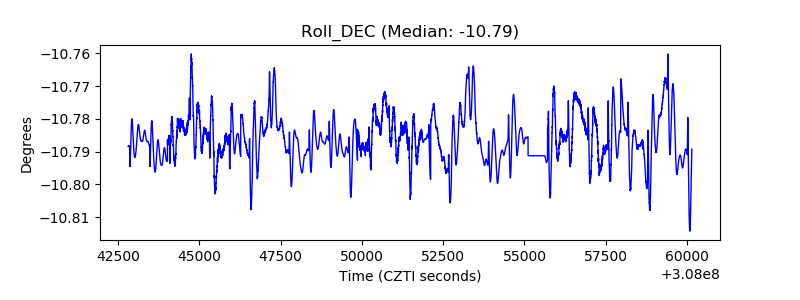 |
| _Roll_RA | 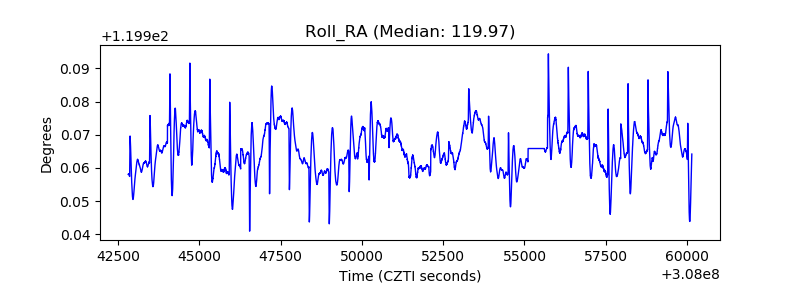 |
| Veto Counter | 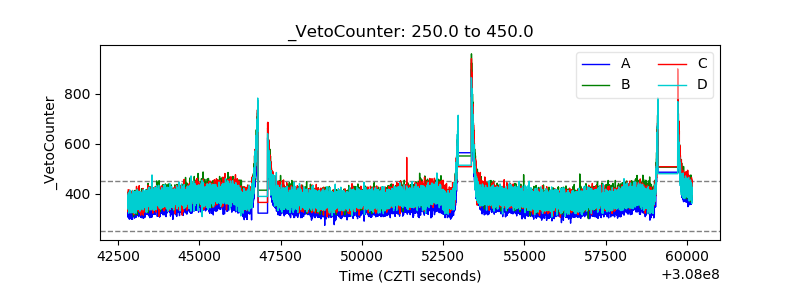 |