| Param | Original file | Final file |
|---|---|---|
| Filename | modeM0/AS1A07_005T01_9000003224_21750cztM0_level2.evt | modeM0/AS1A07_005T01_9000003224_21750cztM0_level2_quad_clean.evt |
| Size (bytes) | 3,191,636,160 | 343,431,360 |
| Size | 3.0 GB | 327.5 MB |
| Events in quadrant A | 15,161,053 | 2,171,182 |
| Events in quadrant B | 16,355,465 | 2,224,456 |
| Events in quadrant C | 14,758,441 | 2,117,117 |
| Events in quadrant D | 48,289,947 | 1,747,225 |
| Mode M9 | |||
|---|---|---|---|
| Quadrant | BADHDUFLAG | Total packets | Discarded packets |
| A | 0 | 28 | 0 |
| B | 0 | 28 | 0 |
| C | 0 | 28 | 0 |
| D | 0 | 28 | 0 |
| Mode M0 | |||
|---|---|---|---|
| Quadrant | BADHDUFLAG | Total packets | Discarded packets |
| A | 0 | 64887 | 5 |
| B | 0 | 67816 | 5 |
| C | 0 | 63595 | 5 |
| D | 0 | 164896 | 10 |
| Mode SS | |||
|---|---|---|---|
| Quadrant | BADHDUFLAG | Total packets | Discarded packets |
| A | 0 | 632 | 0 |
| B | 0 | 632 | 0 |
| C | 0 | 632 | 0 |
| D | 0 | 632 | 0 |
| Quadrant | Total seconds | Saturated seconds | Saturation percentage |
|---|---|---|---|
| A | 31118 | 350 | 1.124751% |
| B | 31119 | 528 | 1.696713% |
| C | 31119 | 458 | 1.471770% |
| D | 31118 | 12482 | 40.111832% |
Noise dominated data is calculated using 1-second bins in cleaned event files. If a bin has >2000 counts, and if more than 50% of those come from <1% of pixels, then it is considered to be noise-dominated and hence unusable.
| Quadrant | # 1 sec bins | Bins with >0 counts | Bins with >2000 counts | High rate bins dominated by noise | Noise dominated (total time) | Noise dominated (detector-on time) | Marked lightcurve |
|---|---|---|---|---|---|---|---|
| A | 37992 | 31123 | 19 | 19 | 0.05% | 0.06% | 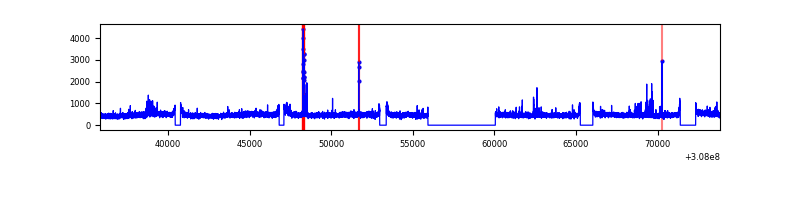 |
| B | 37993 | 31123 | 88 | 88 | 0.23% | 0.28% | 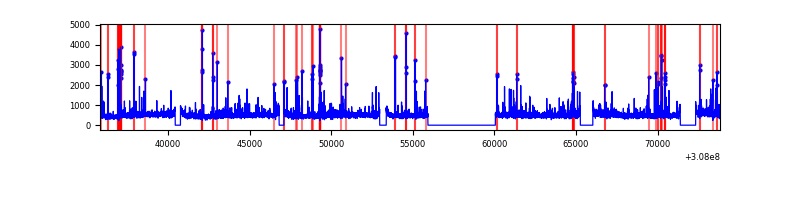 |
| C | 37993 | 31125 | 0 | 0 | 0.00% | 0.00% | 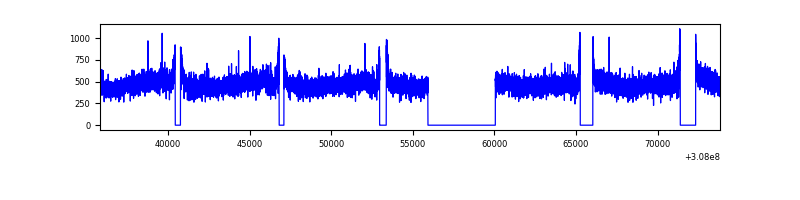 |
| D | 37993 | 31120 | 10121 | 10121 | 26.64% | 32.52% | 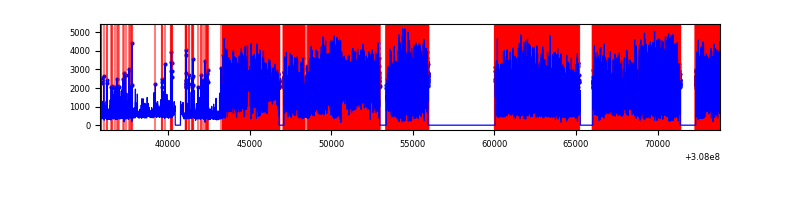 |
Top three noisy pixels from each quadrant. If the there are fewer than three noisy pixels in the level2.evt file, extra rows are filled as -1
| Pixel properties | Quadrant properties | ||||||
|---|---|---|---|---|---|---|---|
| Quadrant | DetID | PixID | Counts | Sigma | Mean | Median | Sigma |
| A | 15 | 236 | 269443 | 350.96 | 3780 | 3695 | 757.2 |
| A | 13 | 170 | 172977 | 223.57 | 3780 | 3695 | 757.2 |
| A | 4 | 2 | 100625 | 128.01 | 3780 | 3695 | 757.2 |
| B | 3 | 64 | 622790 | 866.6 | 3776 | 3680 | 714.4 |
| B | 0 | 230 | 230168 | 317.03 | 3776 | 3680 | 714.4 |
| B | 0 | 190 | 228986 | 315.37 | 3776 | 3680 | 714.4 |
| C | 14 | 238 | 564416 | 657.44 | 3637 | 3653 | 852.9 |
| C | 13 | 61 | 25830 | 26.0 | 3637 | 3653 | 852.9 |
| C | 8 | 128 | 12643 | 10.54 | 3637 | 3653 | 852.9 |
| D | 7 | 238 | 30933233 | 40056.6 | 3165 | 3075 | 772.2 |
| D | 1 | 52 | 2905299 | 3758.57 | 3165 | 3075 | 772.2 |
| D | 12 | 235 | 1035548 | 1337.12 | 3165 | 3075 | 772.2 |
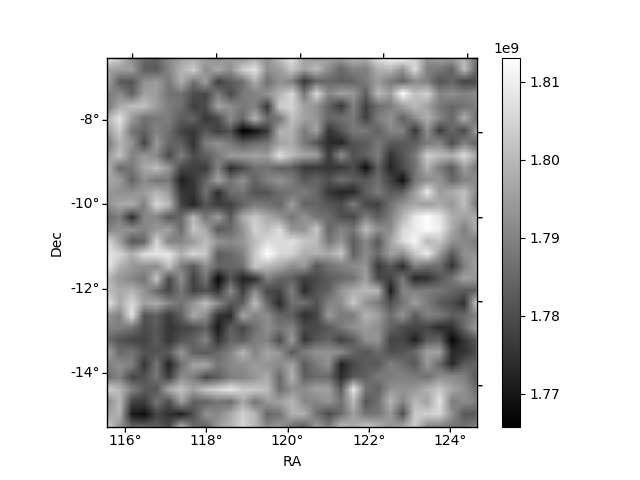
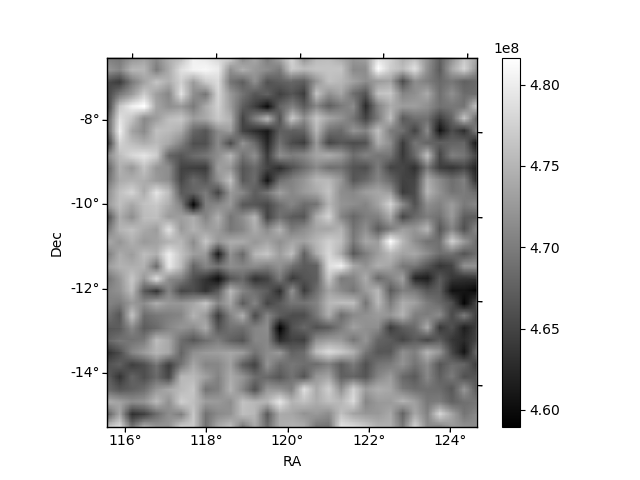
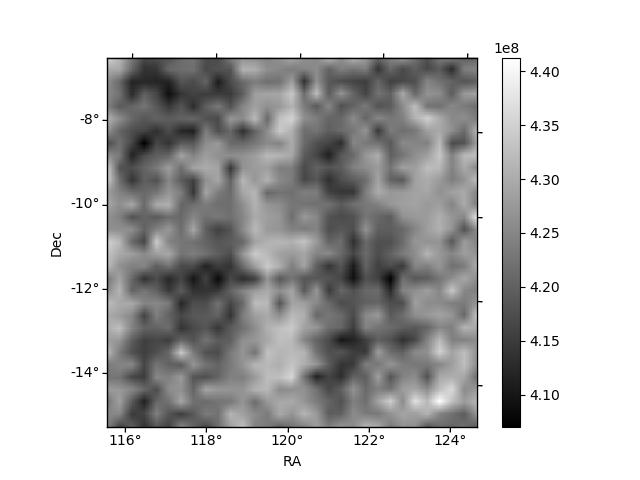
Histogram calculated using DETX and DETY for each event in the final _common_clean file
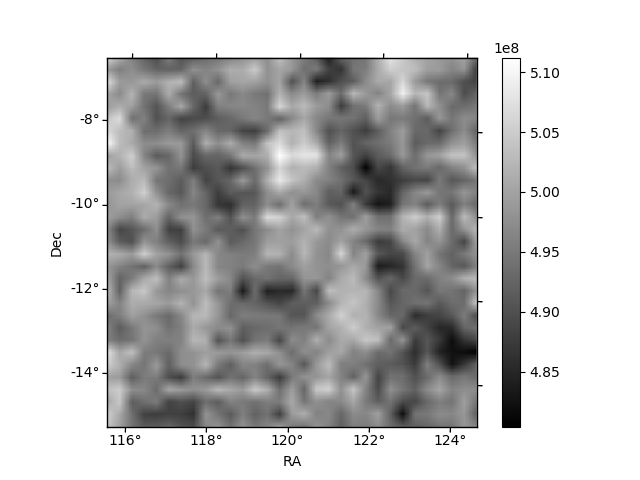
| Quadrant A | 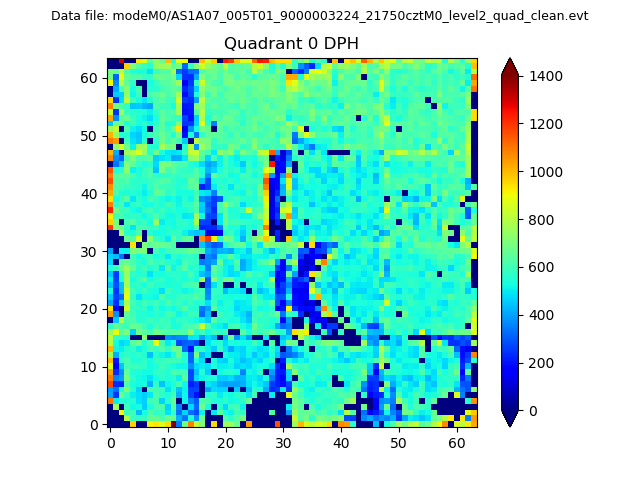 |
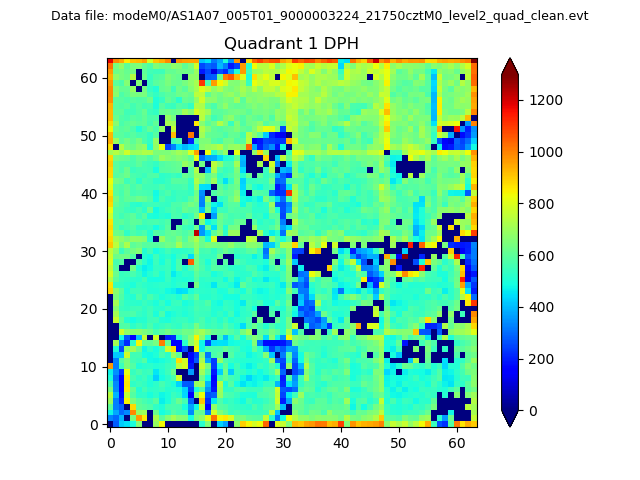 |
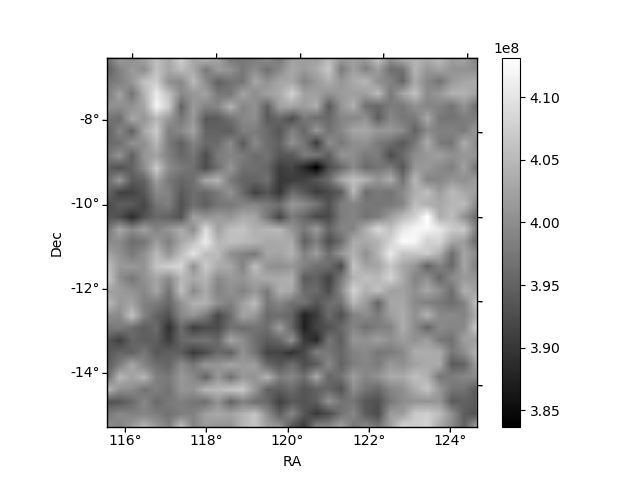
Quadrant B |
|---|---|---|---|
| Quadrant D | 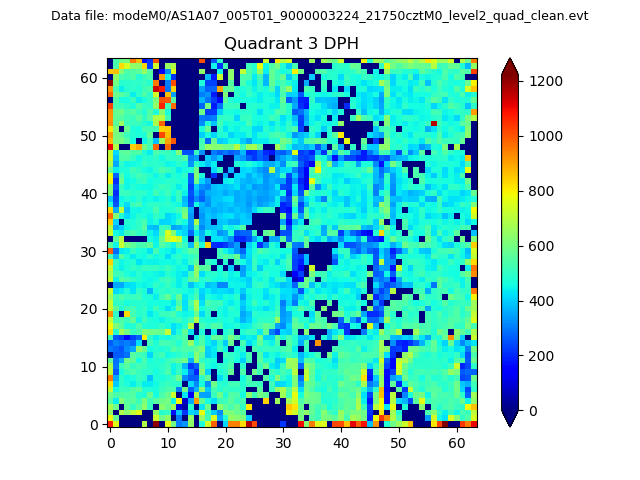 |
 |
Quadrant C |
| Plot type | Count rate plots | Images |
|---|---|---|
| Comparison with Poisson distribution Blue bars denote a histogram of data divided into 1 sec bins. Red curve is a Poisson curve with rate = median count rate of data. |
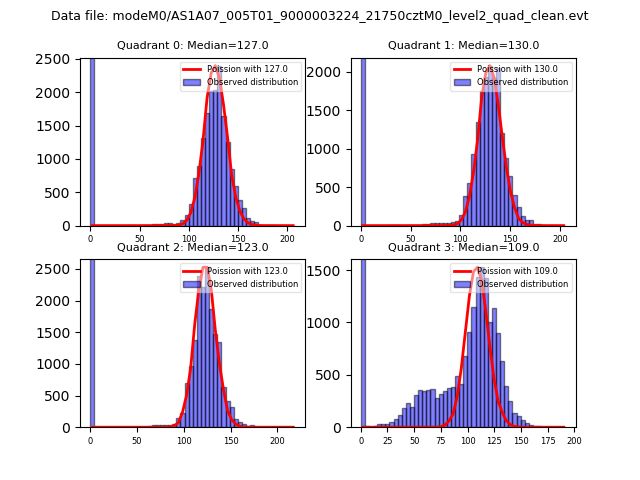 |
 |
| Quadrant-wise count rates Data is divided into 100 sec bins |
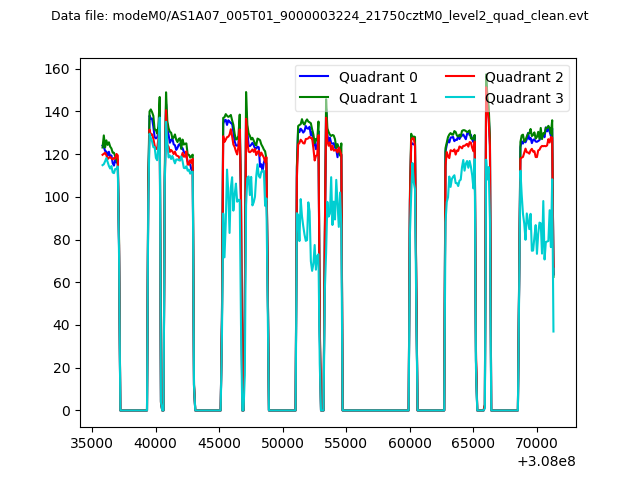 |
|
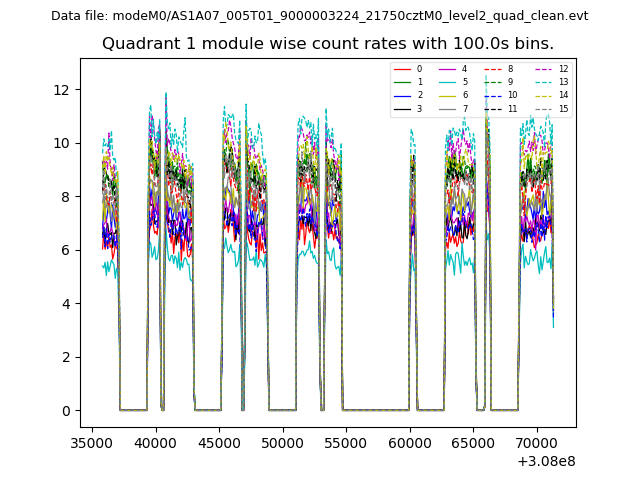
| Module-wise count rates for Quadrant A Data is divided into 100 sec bins |
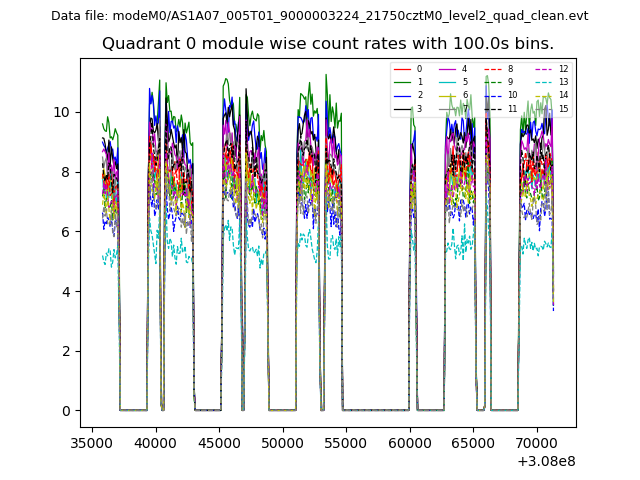 |
 |
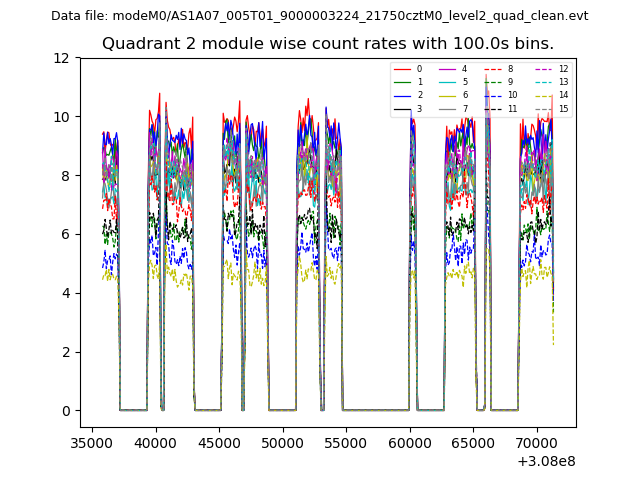
| Module-wise count rates for Quadrant B Data is divided into 100 sec bins |
 |
 |
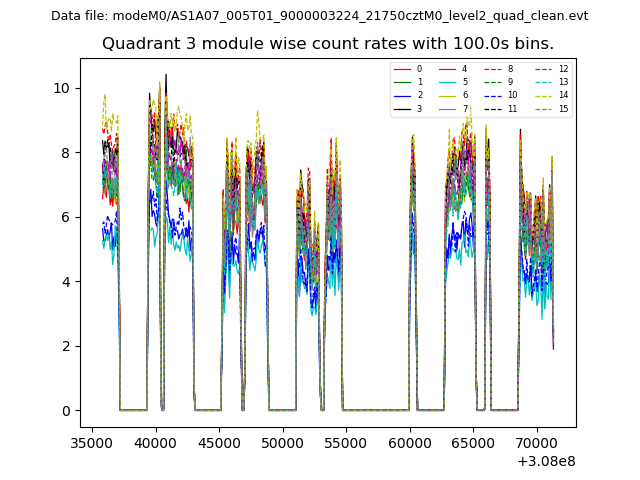
| Module-wise count rates for Quadrant C Data is divided into 100 sec bins |
 |
 |
| Module-wise count rates for Quadrant D Data is divided into 100 sec bins |
 |
 |
| Parameter | Plot |
|---|---|
| CZT HV Monitor | 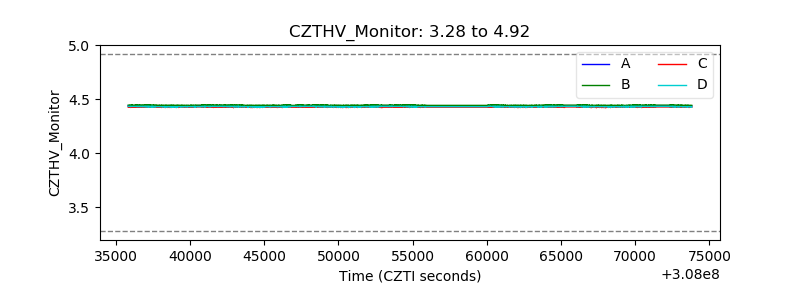 |
| D_VDD | 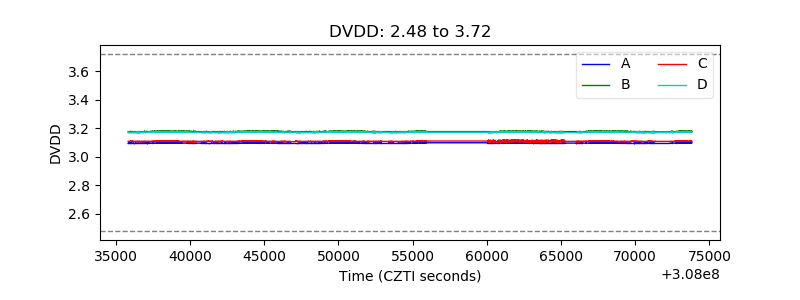 |
| Temperature 1 | 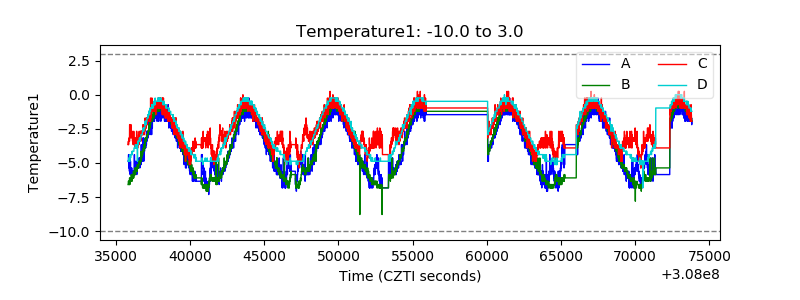 |
| Veto HV Monitor |  |
| Veto LLD | 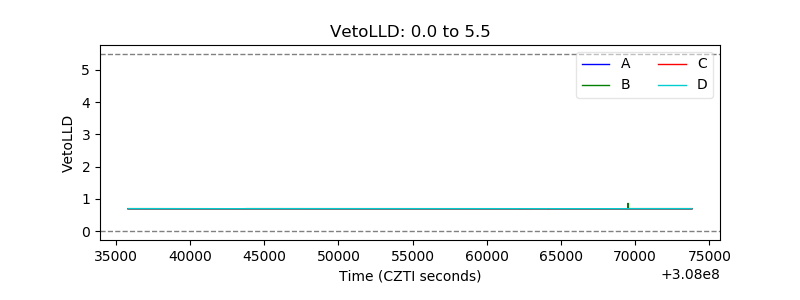 |
| Alpha Counter | 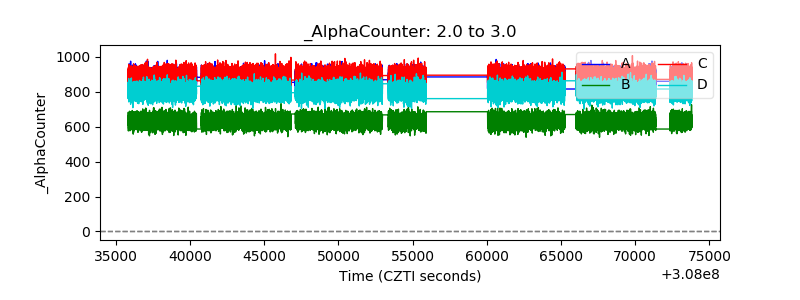 |
| _CPM_Rate | 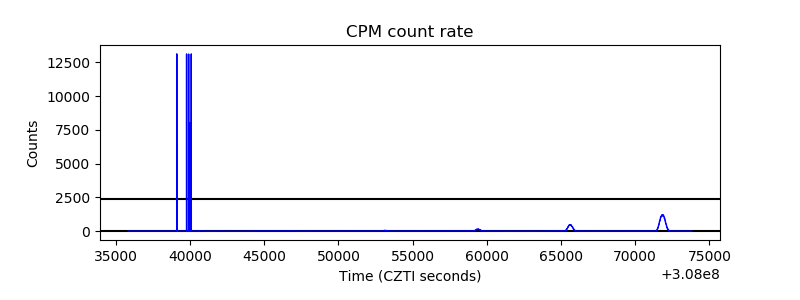 |
| CZT Counter |  |
| +2.5 Volts monitor |  |
| +5 Volts monitor |  |
| _ROLL_ROT | 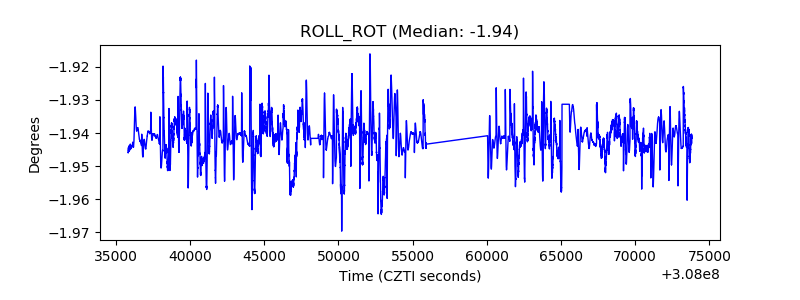 |
| _Roll_DEC | 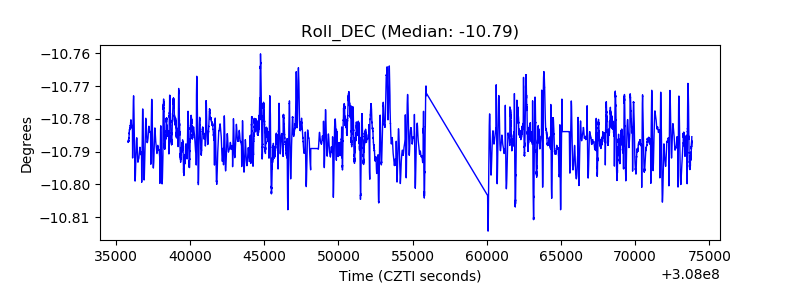 |
| _Roll_RA |  |
| Veto Counter | 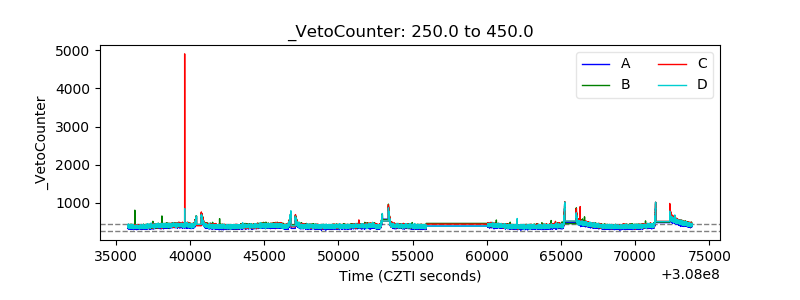 |