| Param | Original file | Final file |
|---|---|---|
| Filename | modeM0/AS1A07_005T01_9000003224_21752cztM0_level2.evt | modeM0/AS1A07_005T01_9000003224_21752cztM0_level2_quad_clean.evt |
| Size (bytes) | 718,030,080 | 61,666,560 |
| Size | 684.8 MB | 58.8 MB |
| Events in quadrant A | 2,983,124 | 392,951 |
| Events in quadrant B | 3,598,295 | 395,960 |
| Events in quadrant C | 3,030,586 | 375,339 |
| Events in quadrant D | 11,725,713 | 281,232 |
| Mode M9 | |||
|---|---|---|---|
| Quadrant | BADHDUFLAG | Total packets | Discarded packets |
| A | 0 | 11 | 0 |
| B | 0 | 11 | 0 |
| C | 0 | 11 | 0 |
| D | 0 | 11 | 0 |
| Mode M0 | |||
|---|---|---|---|
| Quadrant | BADHDUFLAG | Total packets | Discarded packets |
| A | 0 | 12743 | 1 |
| B | 0 | 14593 | 1 |
| C | 0 | 12886 | 1 |
| D | 0 | 38957 | 1 |
| Mode SS | |||
|---|---|---|---|
| Quadrant | BADHDUFLAG | Total packets | Discarded packets |
| A | 0 | 122 | 0 |
| B | 0 | 122 | 0 |
| C | 0 | 122 | 0 |
| D | 0 | 122 | 0 |
| Quadrant | Total seconds | Saturated seconds | Saturation percentage |
|---|---|---|---|
| A | 6028 | 50 | 0.829463% |
| B | 6028 | 131 | 2.173192% |
| C | 6028 | 70 | 1.161248% |
| D | 6028 | 3682 | 61.081619% |
Noise dominated data is calculated using 1-second bins in cleaned event files. If a bin has >2000 counts, and if more than 50% of those come from <1% of pixels, then it is considered to be noise-dominated and hence unusable.
| Quadrant | # 1 sec bins | Bins with >0 counts | Bins with >2000 counts | High rate bins dominated by noise | Noise dominated (total time) | Noise dominated (detector-on time) | Marked lightcurve |
|---|---|---|---|---|---|---|---|
| A | 7123 | 6028 | 0 | 0 | 0.00% | 0.00% | 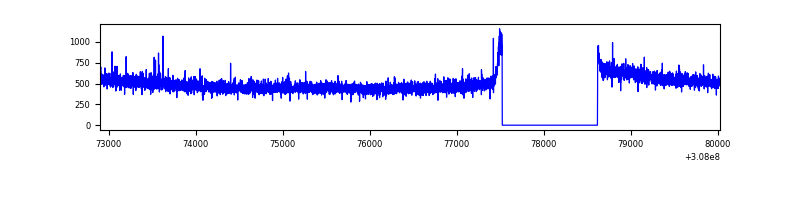 |
| B | 7123 | 6028 | 45 | 45 | 0.63% | 0.75% | 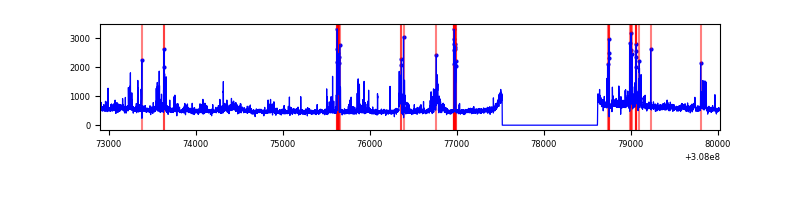 |
| C | 7123 | 6029 | 0 | 0 | 0.00% | 0.00% | 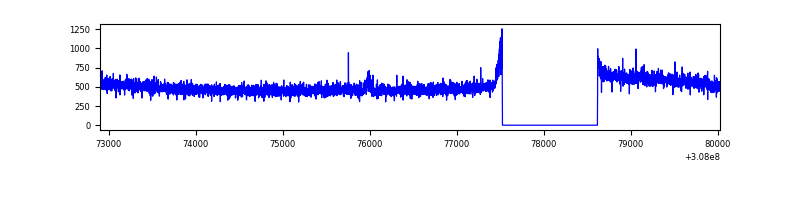 |
| D | 7123 | 6028 | 3073 | 3073 | 43.14% | 50.98% | 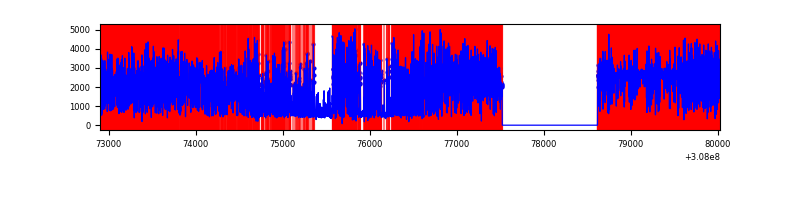 |
Top three noisy pixels from each quadrant. If the there are fewer than three noisy pixels in the level2.evt file, extra rows are filled as -1
| Pixel properties | Quadrant properties | ||||||
|---|---|---|---|---|---|---|---|
| Quadrant | DetID | PixID | Counts | Sigma | Mean | Median | Sigma |
| A | 13 | 254 | 11031 | 66.59 | 771 | 755 | 154.3 |
| A | 4 | 2 | 7945 | 46.59 | 771 | 755 | 154.3 |
| A | 0 | 226 | 6778 | 39.03 | 771 | 755 | 154.3 |
| B | 3 | 64 | 151088 | 1024.23 | 770 | 753 | 146.8 |
| B | 0 | 228 | 82188 | 554.82 | 770 | 753 | 146.8 |
| B | 5 | 172 | 72799 | 490.85 | 770 | 753 | 146.8 |
| C | 14 | 238 | 116823 | 672.54 | 737 | 743 | 172.6 |
| C | 10 | 22 | 39606 | 225.16 | 737 | 743 | 172.6 |
| C | 13 | 61 | 5196 | 25.8 | 737 | 743 | 172.6 |
| D | 7 | 238 | 9093184 | 70301.33 | 528 | 513 | 129.3 |
| D | 1 | 52 | 249958 | 1928.62 | 528 | 513 | 129.3 |
| D | 2 | 136 | 206328 | 1591.29 | 528 | 513 | 129.3 |
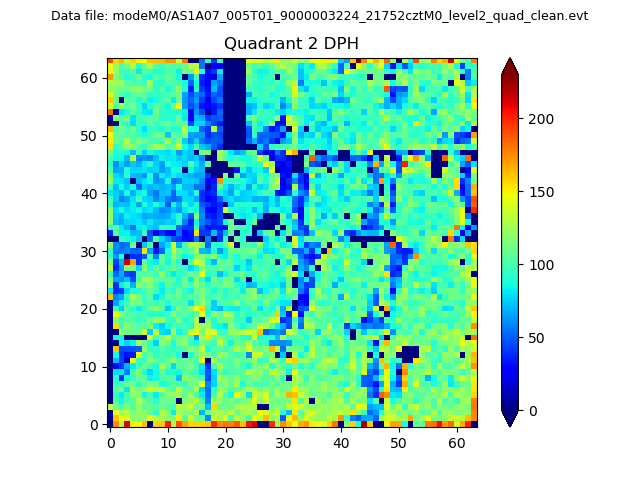
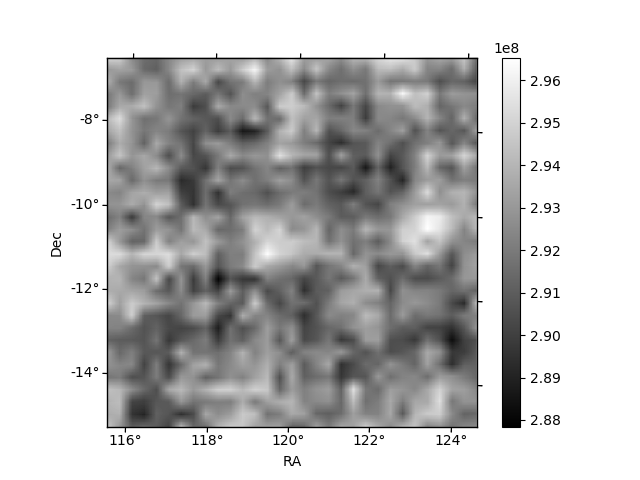
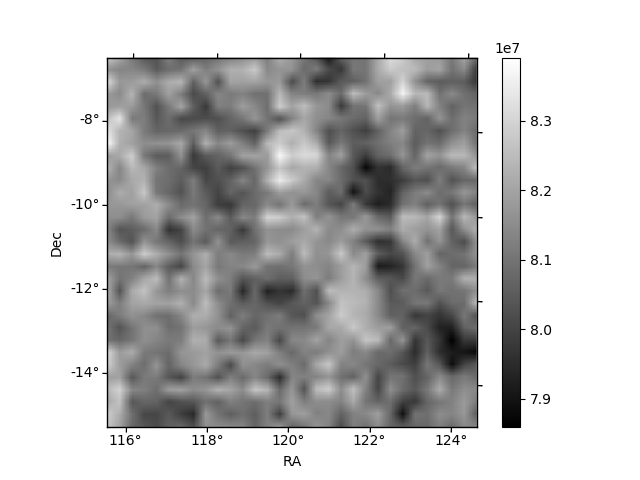
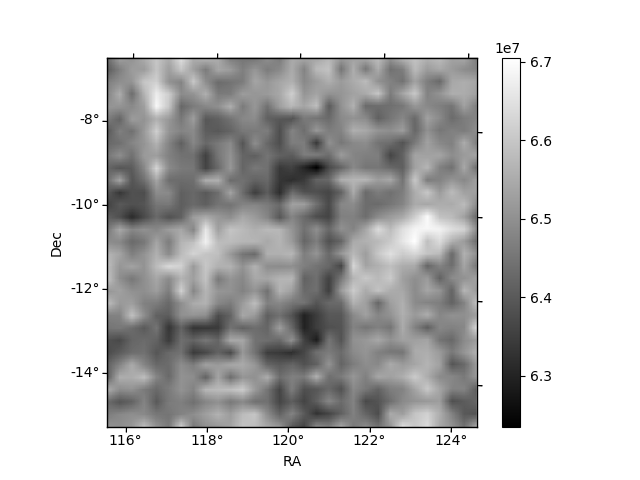
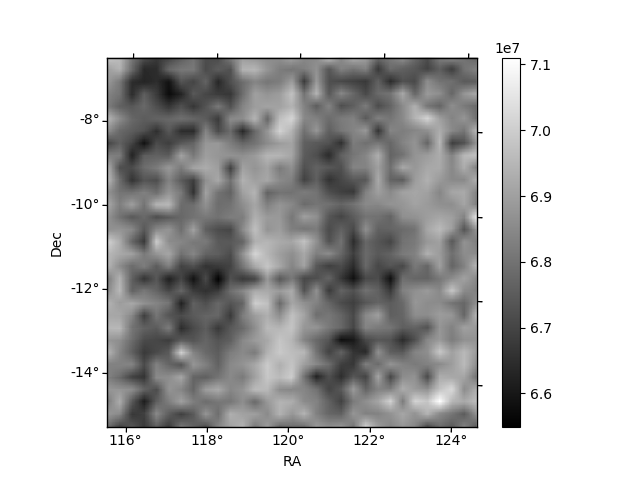
Histogram calculated using DETX and DETY for each event in the final _common_clean file
| Quadrant A | 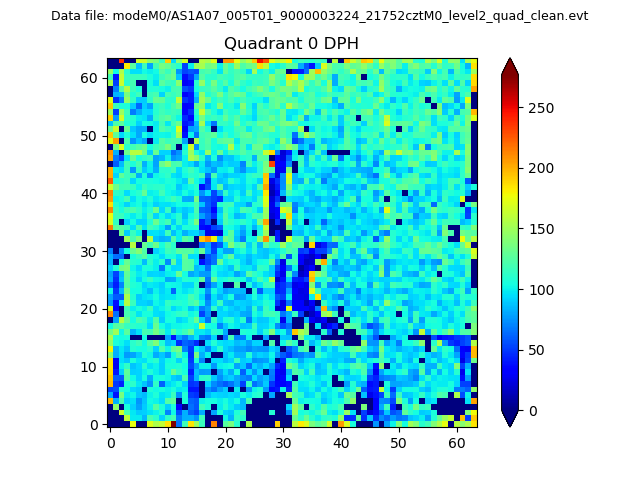 |
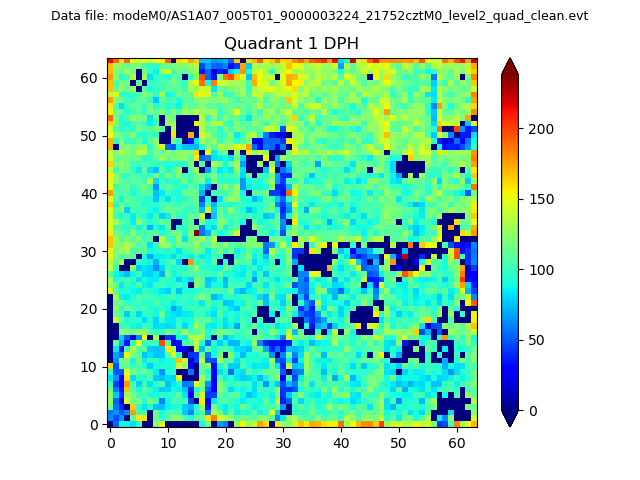 |
Quadrant B |
|---|---|---|---|
| Quadrant D | 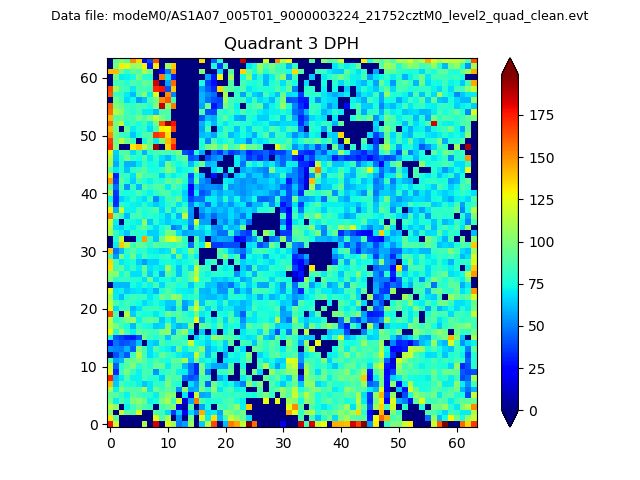 |
 |
Quadrant C |
| Plot type | Count rate plots | Images |
|---|---|---|
| Comparison with Poisson distribution Blue bars denote a histogram of data divided into 1 sec bins. Red curve is a Poisson curve with rate = median count rate of data. |
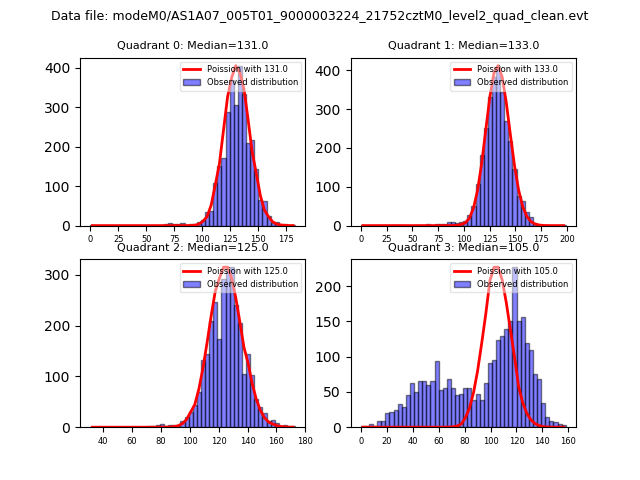 |
 |
| Quadrant-wise count rates Data is divided into 100 sec bins |
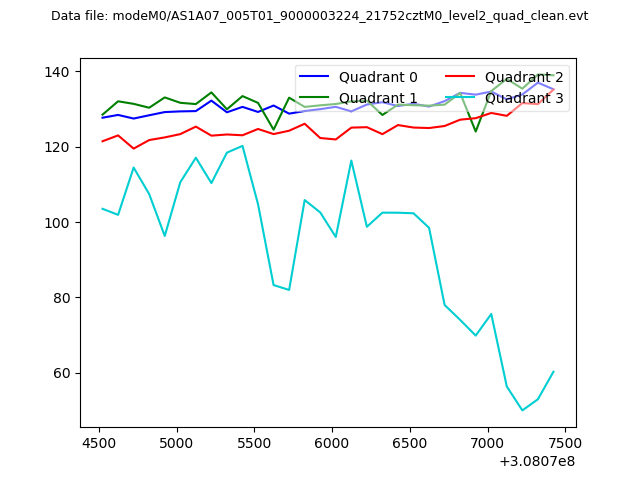 |
|
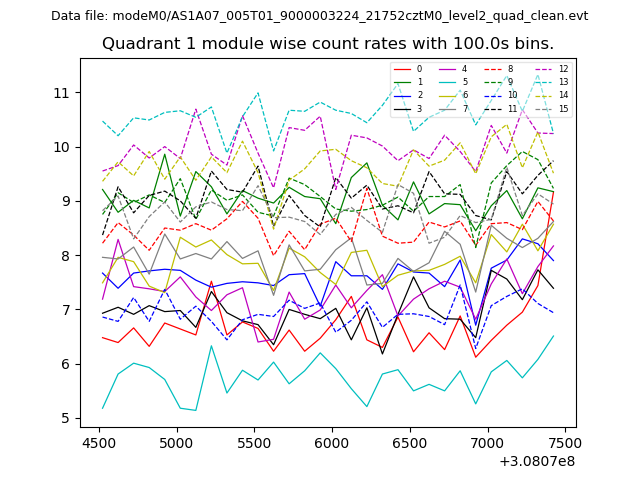
| Module-wise count rates for Quadrant A Data is divided into 100 sec bins |
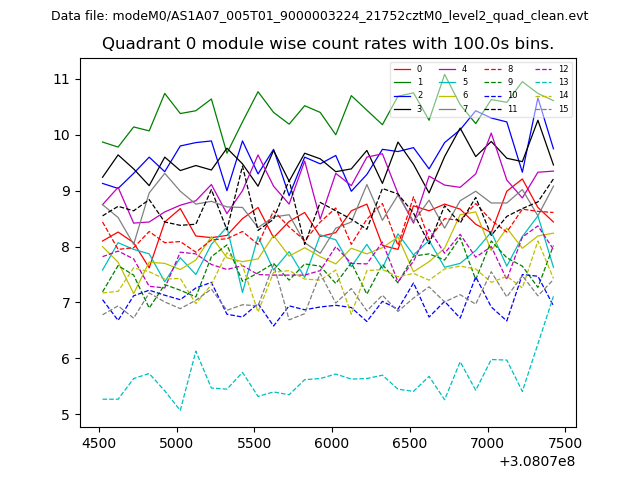 |
 |
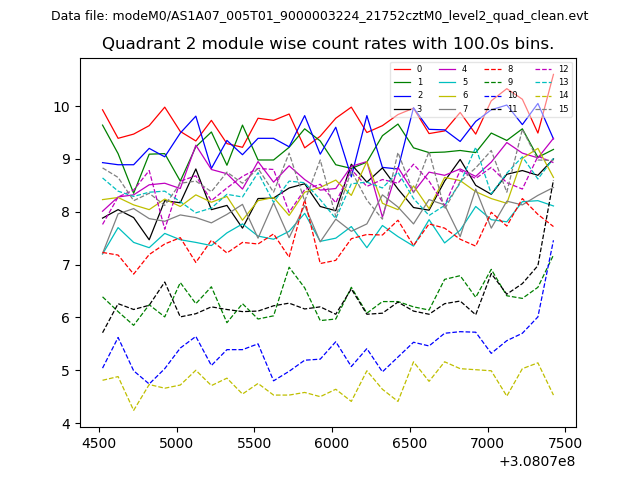
| Module-wise count rates for Quadrant B Data is divided into 100 sec bins |
 |
 |
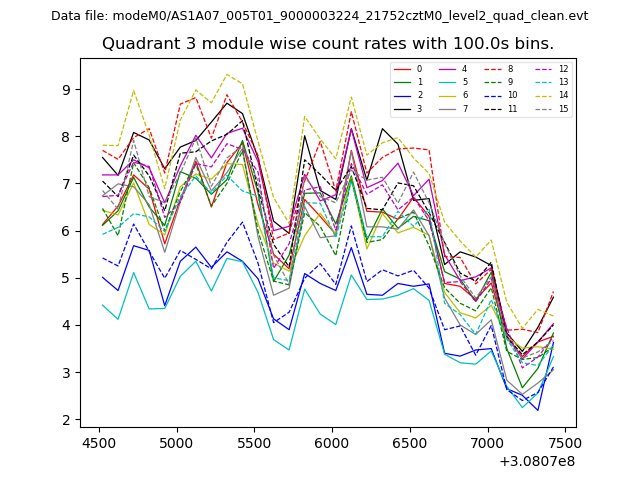
| Module-wise count rates for Quadrant C Data is divided into 100 sec bins |
 |
 |
| Module-wise count rates for Quadrant D Data is divided into 100 sec bins |
 |
 |
| Parameter | Plot |
|---|---|
| CZT HV Monitor | 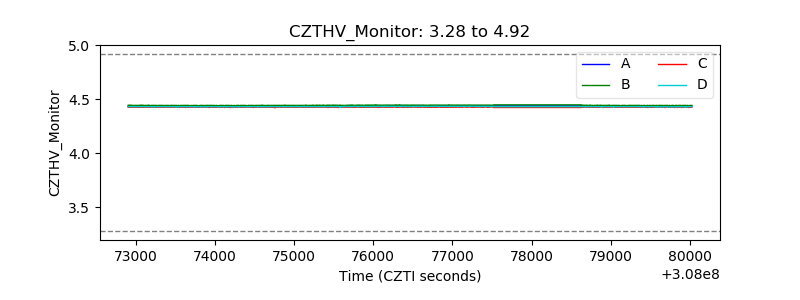 |
| D_VDD | 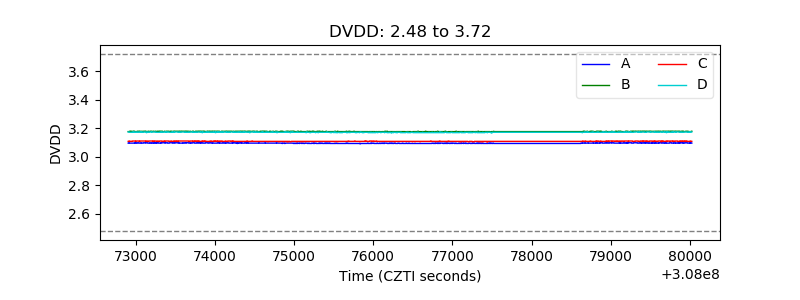 |
| Temperature 1 | 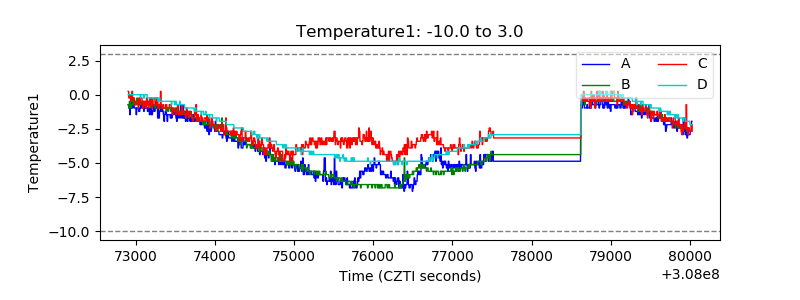 |
| Veto HV Monitor | 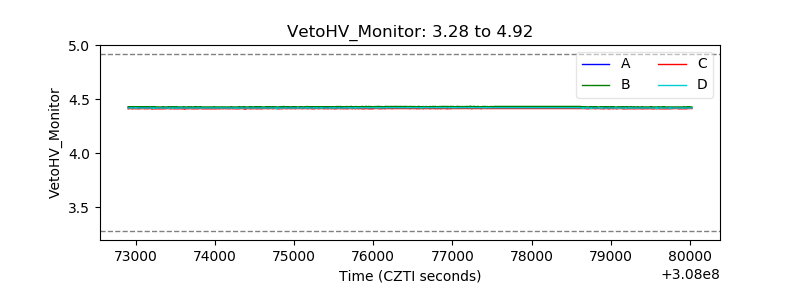 |
| Veto LLD | 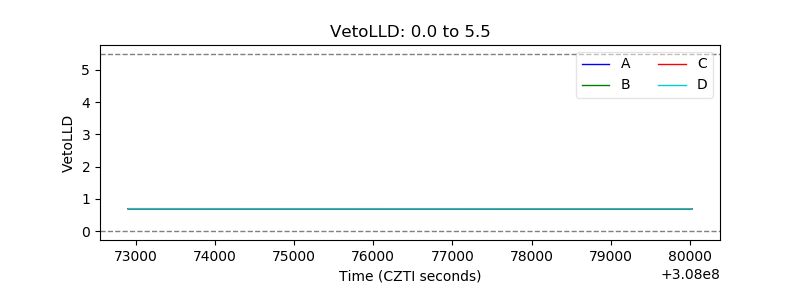 |
| Alpha Counter | 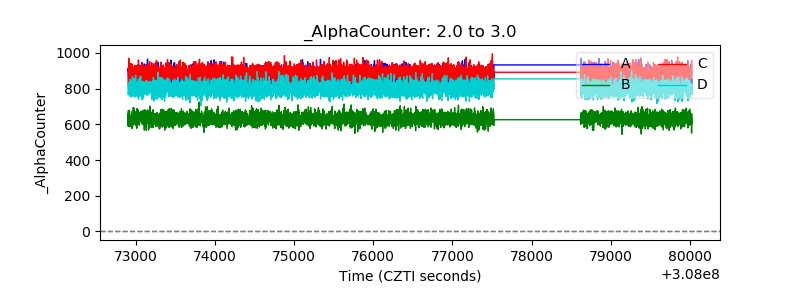 |
| _CPM_Rate | 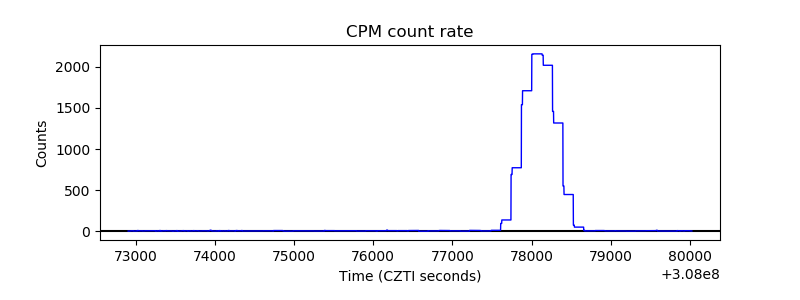 |
| CZT Counter | 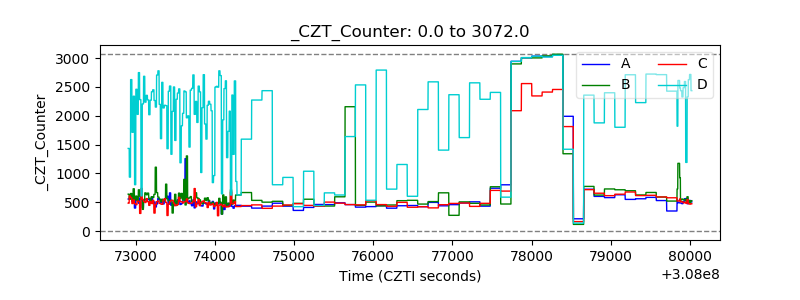 |
| +2.5 Volts monitor |  |
| +5 Volts monitor |  |
| _ROLL_ROT | 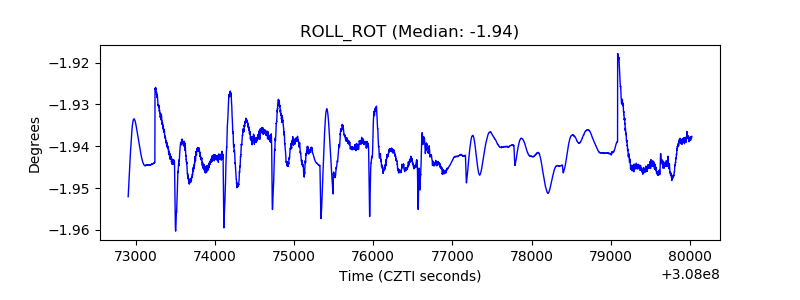 |
| _Roll_DEC | 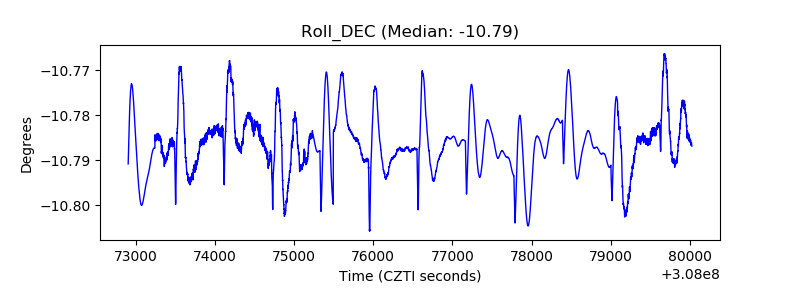 |
| _Roll_RA | 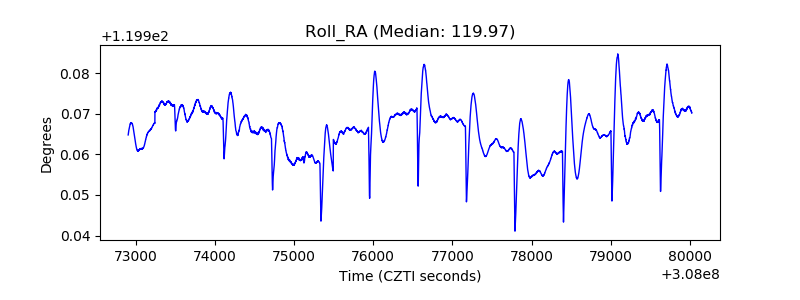 |
| Veto Counter | 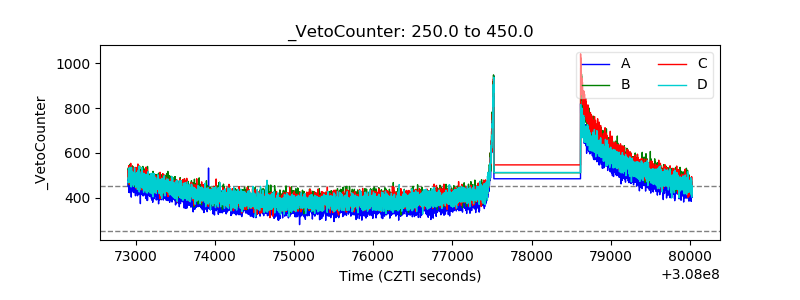 |