| Param | Original file | Final file |
|---|---|---|
| Filename | modeM0/AS1A07_005T01_9000003224_21753cztM0_level2.evt | modeM0/AS1A07_005T01_9000003224_21753cztM0_level2_quad_clean.evt |
| Size (bytes) | 742,291,200 | 68,322,240 |
| Size | 707.9 MB | 65.2 MB |
| Events in quadrant A | 3,090,250 | 450,453 |
| Events in quadrant B | 3,530,198 | 456,651 |
| Events in quadrant C | 3,136,761 | 429,299 |
| Events in quadrant D | 12,318,110 | 313,306 |
| Mode M9 | |||
|---|---|---|---|
| Quadrant | BADHDUFLAG | Total packets | Discarded packets |
| A | 0 | 13 | 0 |
| B | 0 | 13 | 0 |
| C | 0 | 13 | 0 |
| D | 0 | 13 | 0 |
| Mode M0 | |||
|---|---|---|---|
| Quadrant | BADHDUFLAG | Total packets | Discarded packets |
| A | 0 | 13026 | 1 |
| B | 0 | 14496 | 1 |
| C | 0 | 13152 | 1 |
| D | 0 | 40698 | 1 |
| Mode SS | |||
|---|---|---|---|
| Quadrant | BADHDUFLAG | Total packets | Discarded packets |
| A | 0 | 120 | 0 |
| B | 0 | 120 | 0 |
| C | 0 | 120 | 0 |
| D | 0 | 120 | 0 |
| Quadrant | Total seconds | Saturated seconds | Saturation percentage |
|---|---|---|---|
| A | 5990 | 56 | 0.934891% |
| B | 5991 | 110 | 1.836087% |
| C | 5991 | 78 | 1.301953% |
| D | 5991 | 4045 | 67.517944% |
Noise dominated data is calculated using 1-second bins in cleaned event files. If a bin has >2000 counts, and if more than 50% of those come from <1% of pixels, then it is considered to be noise-dominated and hence unusable.
| Quadrant | # 1 sec bins | Bins with >0 counts | Bins with >2000 counts | High rate bins dominated by noise | Noise dominated (total time) | Noise dominated (detector-on time) | Marked lightcurve |
|---|---|---|---|---|---|---|---|
| A | 7205 | 5991 | 2 | 2 | 0.03% | 0.03% |  |
| B | 7206 | 5992 | 24 | 24 | 0.33% | 0.40% | 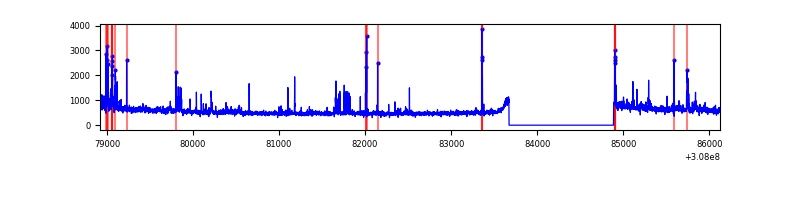 |
| C | 7206 | 5992 | 1 | 1 | 0.01% | 0.02% | 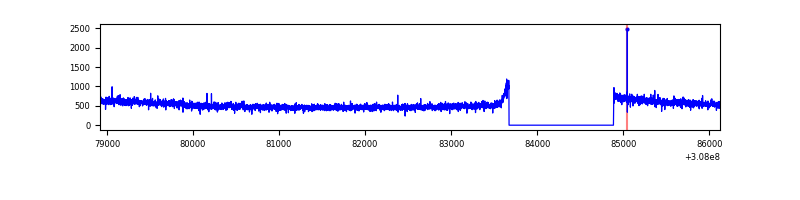 |
| D | 7206 | 5992 | 3303 | 3303 | 45.84% | 55.12% |  |
Top three noisy pixels from each quadrant. If the there are fewer than three noisy pixels in the level2.evt file, extra rows are filled as -1
| Pixel properties | Quadrant properties | ||||||
|---|---|---|---|---|---|---|---|
| Quadrant | DetID | PixID | Counts | Sigma | Mean | Median | Sigma |
| A | 4 | 2 | 12108 | 71.26 | 797 | 784 | 158.9 |
| A | 13 | 254 | 10784 | 62.93 | 797 | 784 | 158.9 |
| A | 0 | 226 | 6796 | 37.83 | 797 | 784 | 158.9 |
| B | 3 | 64 | 117620 | 771.11 | 800 | 784 | 151.5 |
| B | 5 | 172 | 104682 | 685.72 | 800 | 784 | 151.5 |
| B | 0 | 230 | 38264 | 247.36 | 800 | 784 | 151.5 |
| C | 14 | 238 | 120385 | 671.64 | 762 | 770 | 178.1 |
| C | 10 | 22 | 32611 | 178.79 | 762 | 770 | 178.1 |
| C | 0 | 239 | 11698 | 61.36 | 762 | 770 | 178.1 |
| D | 7 | 238 | 9596995 | 71007.18 | 550 | 534 | 135.1 |
| D | 2 | 136 | 145509 | 1072.71 | 550 | 534 | 135.1 |
| D | 1 | 52 | 144964 | 1068.68 | 550 | 534 | 135.1 |
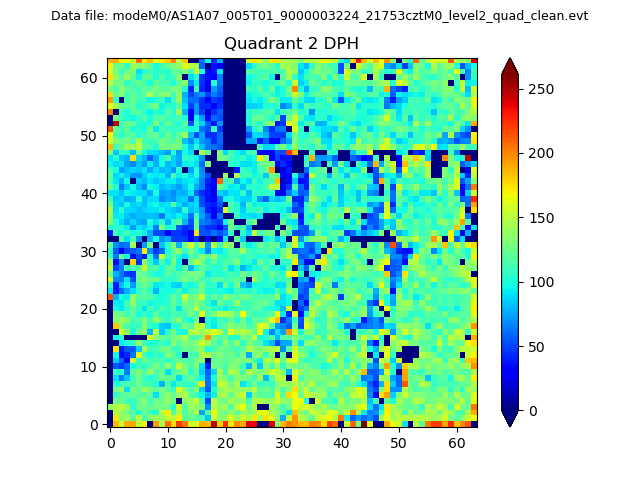
Histogram calculated using DETX and DETY for each event in the final _common_clean file
| Quadrant A | 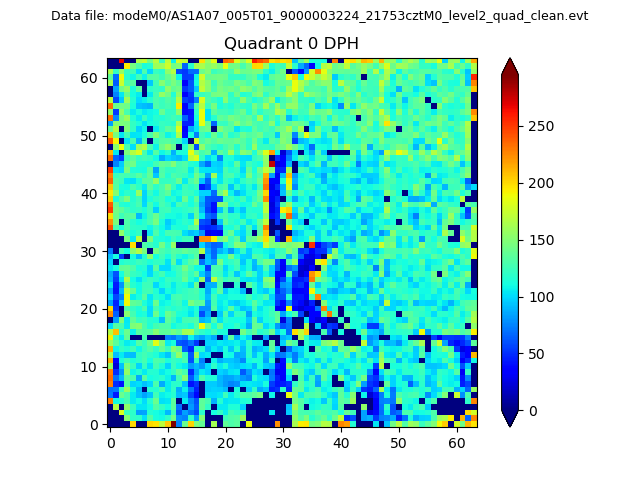 |
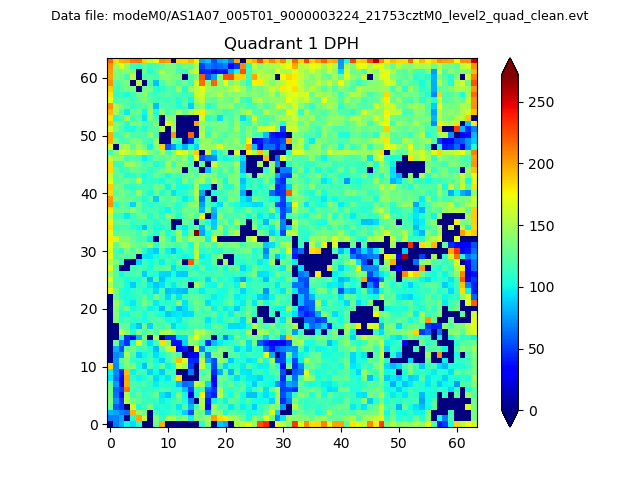 |
Quadrant B |
|---|---|---|---|
| Quadrant D | 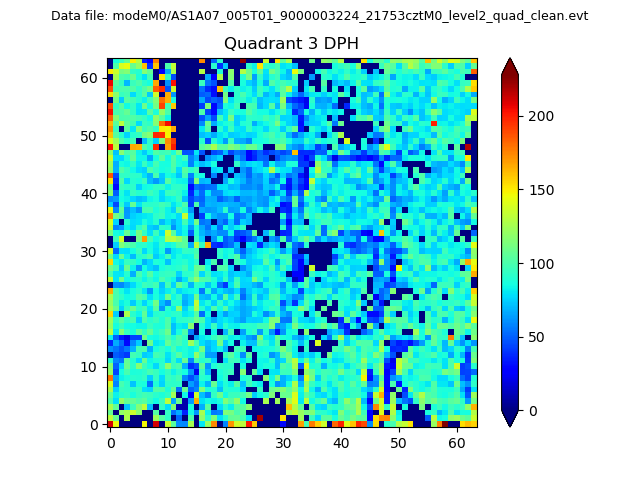 |
 |
Quadrant C |
| Plot type | Count rate plots | Images |
|---|---|---|
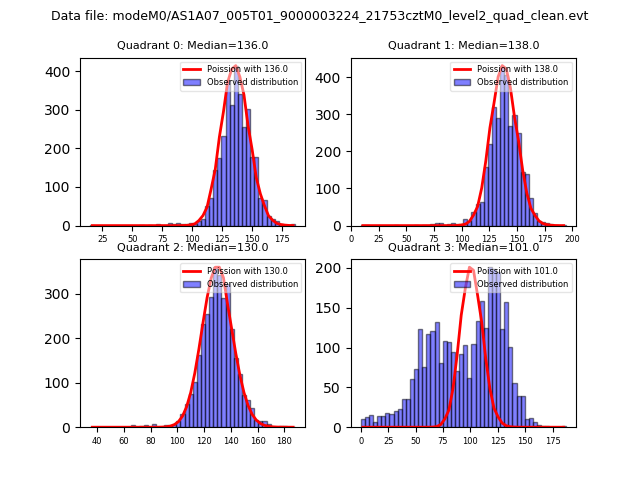
| Comparison with Poisson distribution Blue bars denote a histogram of data divided into 1 sec bins. Red curve is a Poisson curve with rate = median count rate of data. |
 |
 |
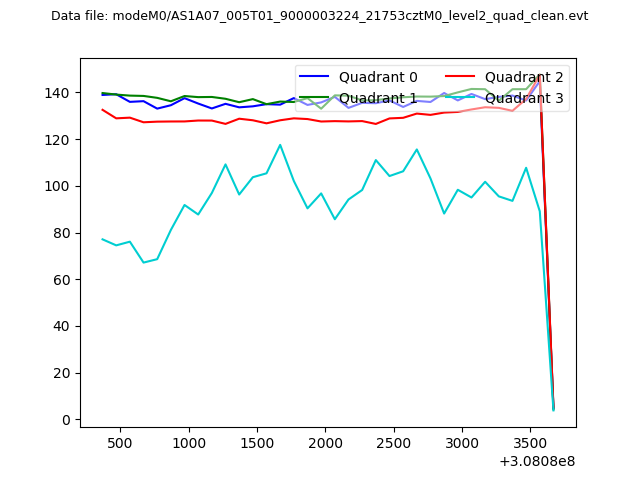
| Quadrant-wise count rates Data is divided into 100 sec bins |
 |
|
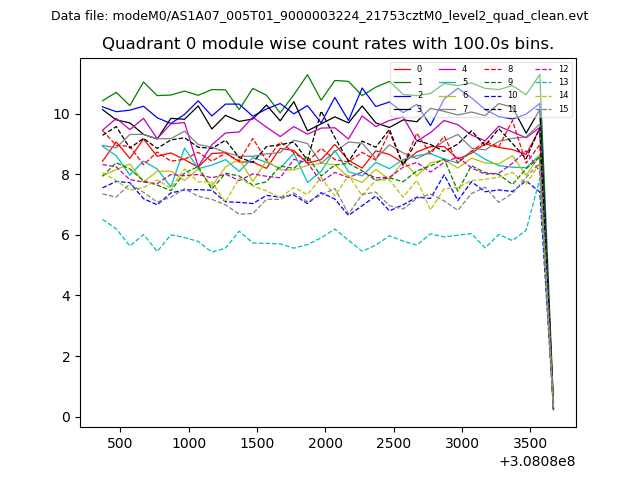
| Module-wise count rates for Quadrant A Data is divided into 100 sec bins |
 |
 |
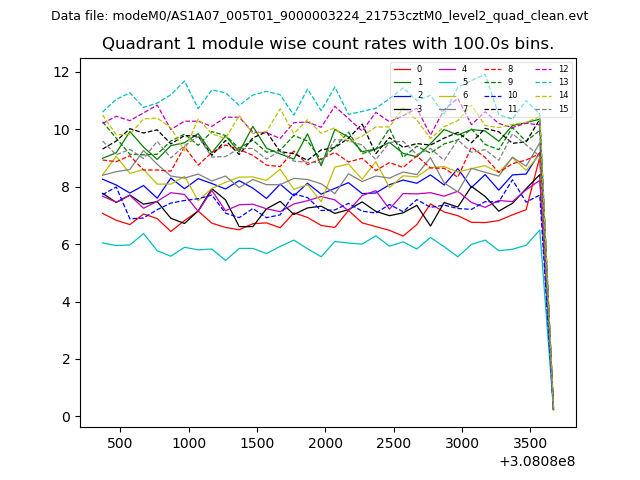
| Module-wise count rates for Quadrant B Data is divided into 100 sec bins |
 |
 |
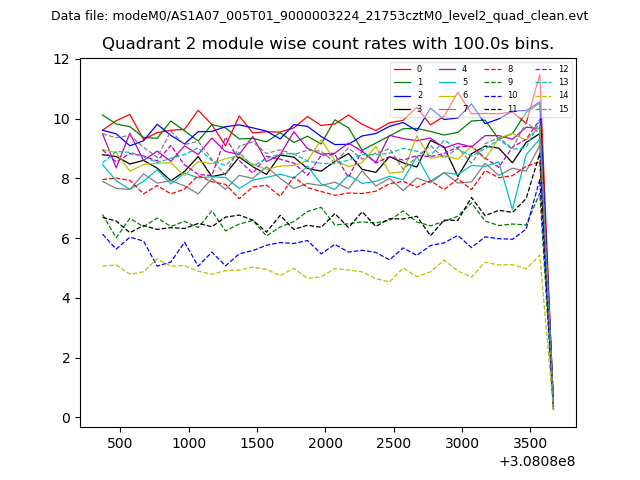
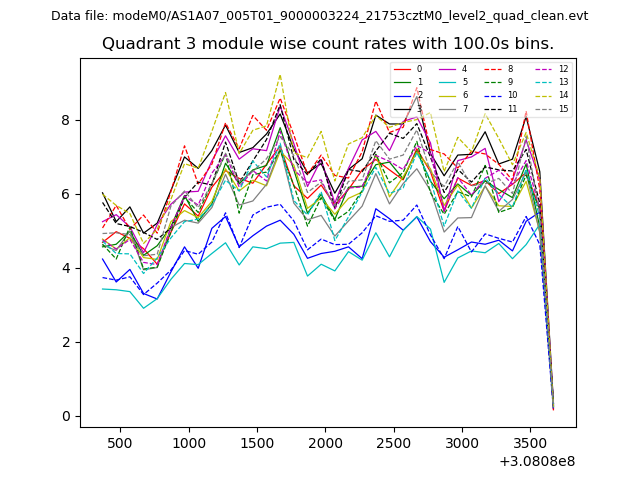
| Module-wise count rates for Quadrant C Data is divided into 100 sec bins |
 |
 |
| Module-wise count rates for Quadrant D Data is divided into 100 sec bins |
 |
 |
| Parameter | Plot |
|---|---|
| CZT HV Monitor | 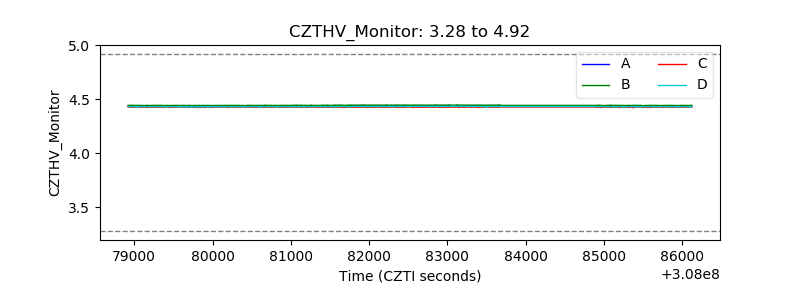 |
| D_VDD |  |
| Temperature 1 | 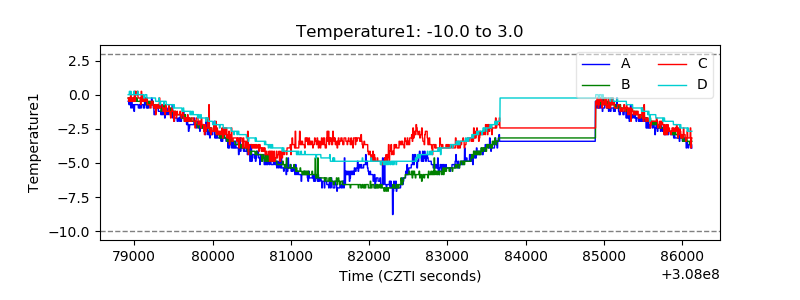 |
| Veto HV Monitor |  |
| Veto LLD | 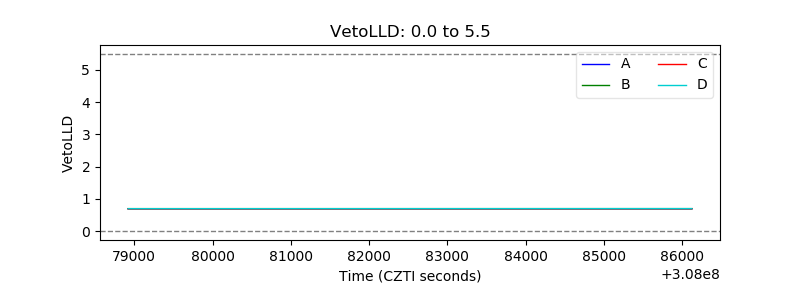 |
| Alpha Counter | 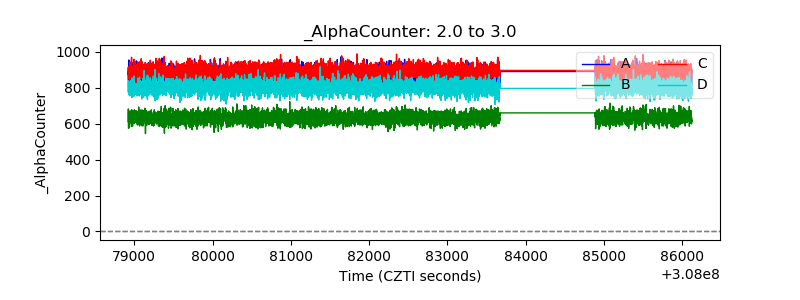 |
| _CPM_Rate | 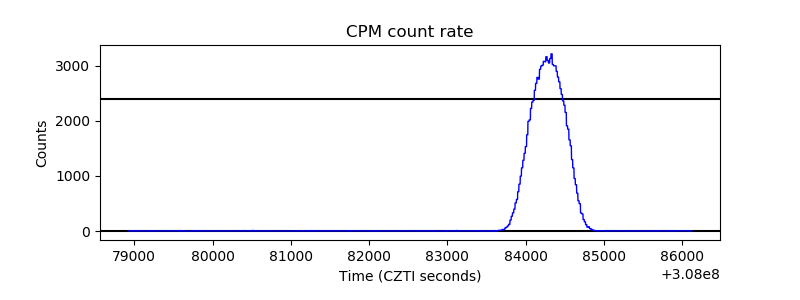 |
| CZT Counter | 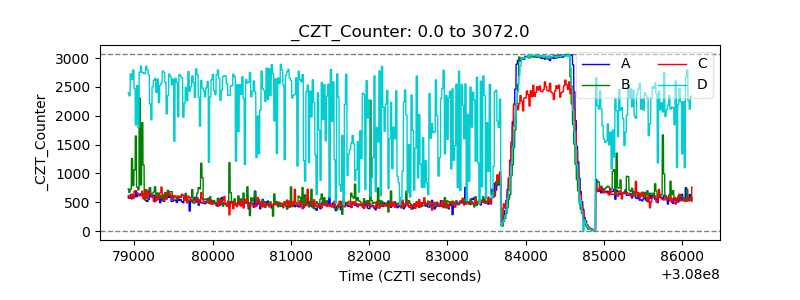 |
| +2.5 Volts monitor |  |
| +5 Volts monitor |  |
| _ROLL_ROT | 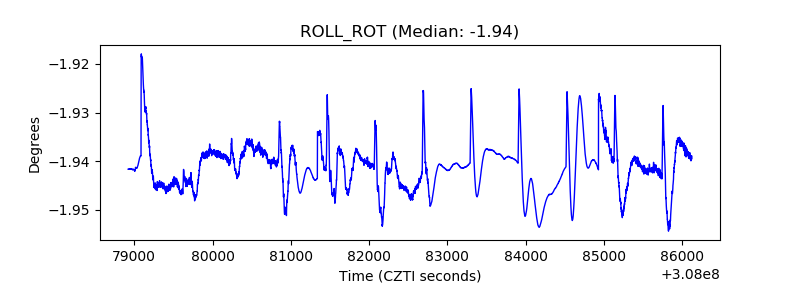 |
| _Roll_DEC | 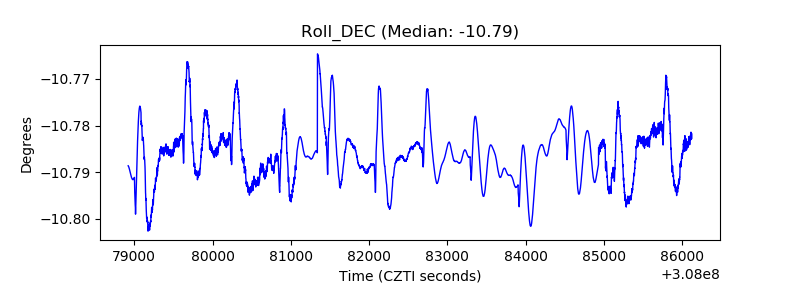 |
| _Roll_RA |  |
| Veto Counter | 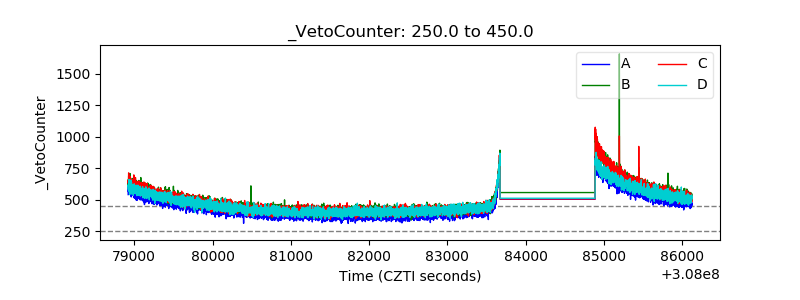 |