| Param | Original file | Final file |
|---|---|---|
| Filename | modeM0/AS1A07_005T01_9000003224_21754cztM0_level2.evt | modeM0/AS1A07_005T01_9000003224_21754cztM0_level2_quad_clean.evt |
| Size (bytes) | 672,543,360 | 84,064,320 |
| Size | 641.4 MB | 80.2 MB |
| Events in quadrant A | 3,325,214 | 552,517 |
| Events in quadrant B | 3,694,717 | 564,129 |
| Events in quadrant C | 3,329,241 | 529,024 |
| Events in quadrant D | 9,602,582 | 470,175 |
| Mode M9 | |||
|---|---|---|---|
| Quadrant | BADHDUFLAG | Total packets | Discarded packets |
| A | 0 | 14 | 0 |
| B | 0 | 15 | 0 |
| C | 0 | 15 | 0 |
| D | 0 | 15 | 0 |
| Mode M0 | |||
|---|---|---|---|
| Quadrant | BADHDUFLAG | Total packets | Discarded packets |
| A | 0 | 13858 | 2 |
| B | 0 | 15117 | 2 |
| C | 0 | 13805 | 3 |
| D | 0 | 32773 | 2 |
| Mode SS | |||
|---|---|---|---|
| Quadrant | BADHDUFLAG | Total packets | Discarded packets |
| A | 0 | 124 | 0 |
| B | 0 | 124 | 0 |
| C | 0 | 124 | 0 |
| D | 0 | 124 | 0 |
| Quadrant | Total seconds | Saturated seconds | Saturation percentage |
|---|---|---|---|
| A | 6159 | 84 | 1.363858% |
| B | 6159 | 132 | 2.143205% |
| C | 6158 | 118 | 1.916207% |
| D | 6158 | 2364 | 38.389087% |
Noise dominated data is calculated using 1-second bins in cleaned event files. If a bin has >2000 counts, and if more than 50% of those come from <1% of pixels, then it is considered to be noise-dominated and hence unusable.
| Quadrant | # 1 sec bins | Bins with >0 counts | Bins with >2000 counts | High rate bins dominated by noise | Noise dominated (total time) | Noise dominated (detector-on time) | Marked lightcurve |
|---|---|---|---|---|---|---|---|
| A | 7429 | 6159 | 0 | 0 | 0.00% | 0.00% | 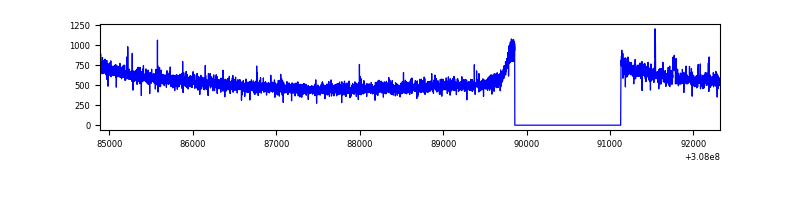 |
| B | 7429 | 6159 | 16 | 16 | 0.22% | 0.26% | 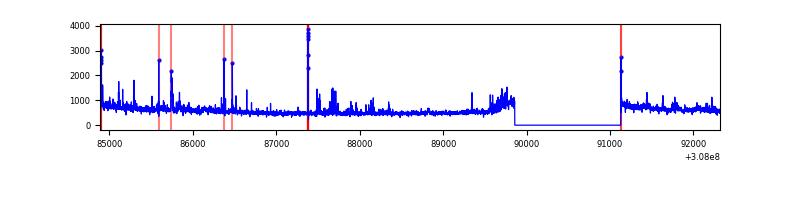 |
| C | 7428 | 6159 | 1 | 1 | 0.01% | 0.02% | 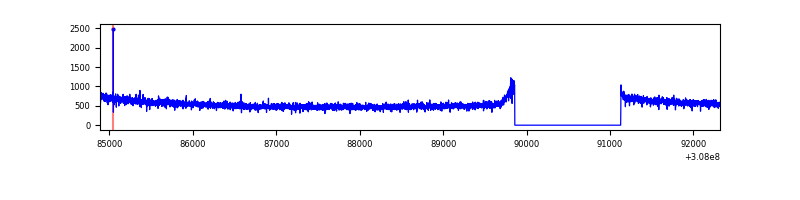 |
| D | 7428 | 6159 | 1869 | 1869 | 25.16% | 30.35% | 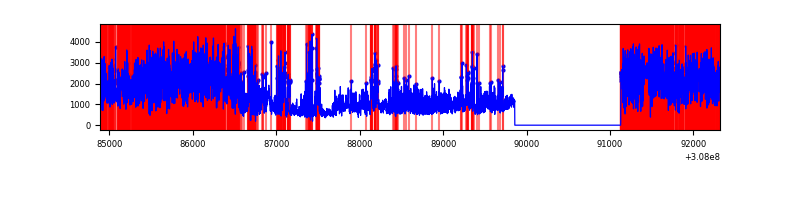 |
Top three noisy pixels from each quadrant. If the there are fewer than three noisy pixels in the level2.evt file, extra rows are filled as -1
| Pixel properties | Quadrant properties | ||||||
|---|---|---|---|---|---|---|---|
| Quadrant | DetID | PixID | Counts | Sigma | Mean | Median | Sigma |
| A | 15 | 236 | 24944 | 141.04 | 855 | 841 | 170.9 |
| A | 13 | 254 | 11238 | 60.84 | 855 | 841 | 170.9 |
| A | 0 | 226 | 7591 | 39.5 | 855 | 841 | 170.9 |
| B | 3 | 64 | 93498 | 574.14 | 858 | 840 | 161.4 |
| B | 0 | 230 | 78321 | 480.1 | 858 | 840 | 161.4 |
| B | 5 | 172 | 54270 | 331.07 | 858 | 840 | 161.4 |
| C | 14 | 238 | 131500 | 688.93 | 818 | 824 | 189.7 |
| C | 13 | 61 | 5901 | 26.77 | 818 | 824 | 189.7 |
| C | 8 | 128 | 3314 | 13.13 | 818 | 824 | 189.7 |
| D | 7 | 238 | 4783625 | 28174.36 | 701 | 683 | 169.8 |
| D | 7 | 38 | 984192 | 5793.45 | 701 | 683 | 169.8 |
| D | 1 | 52 | 563704 | 3316.53 | 701 | 683 | 169.8 |
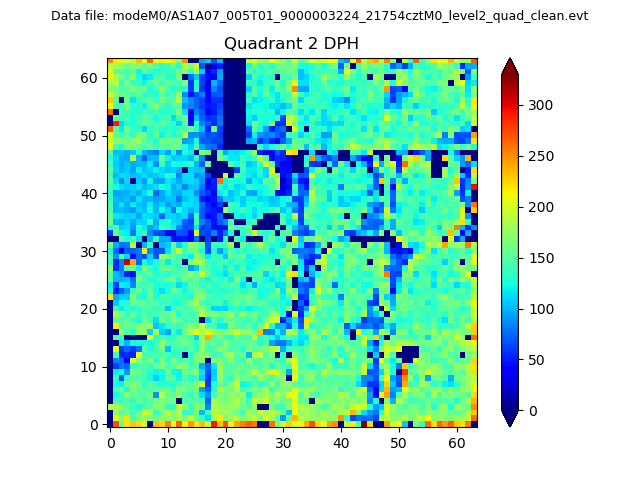
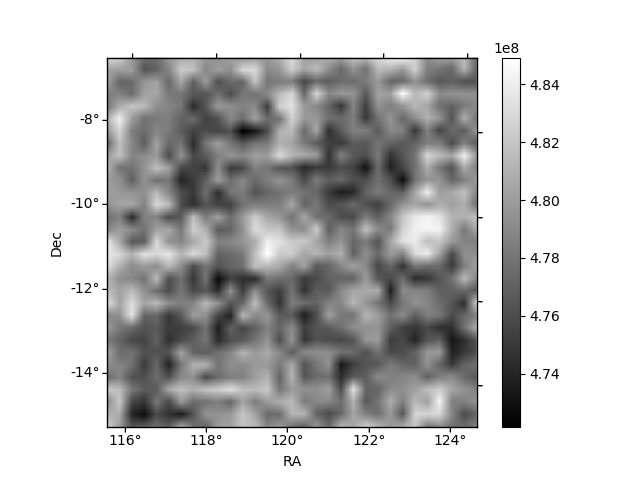
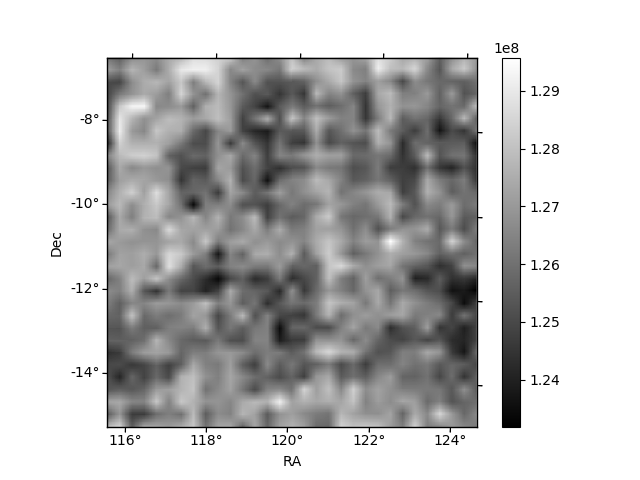
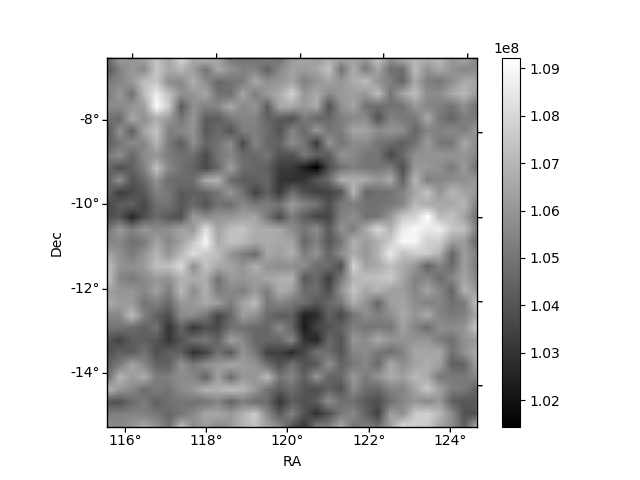
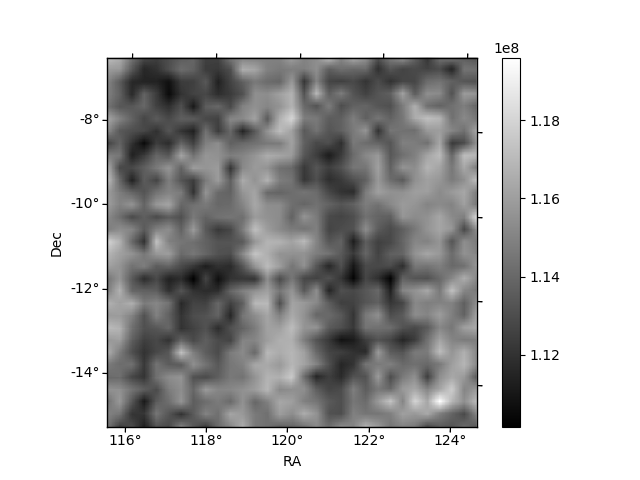
Histogram calculated using DETX and DETY for each event in the final _common_clean file
| Quadrant A | 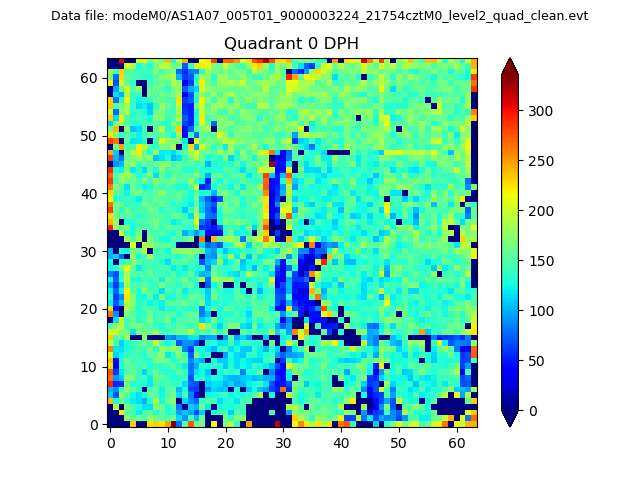 |
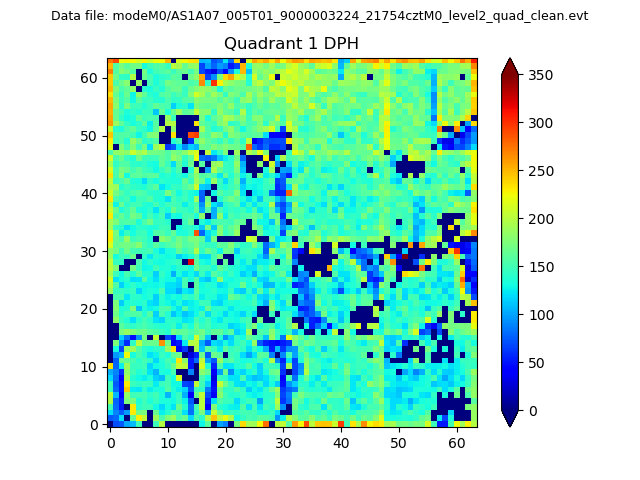 |
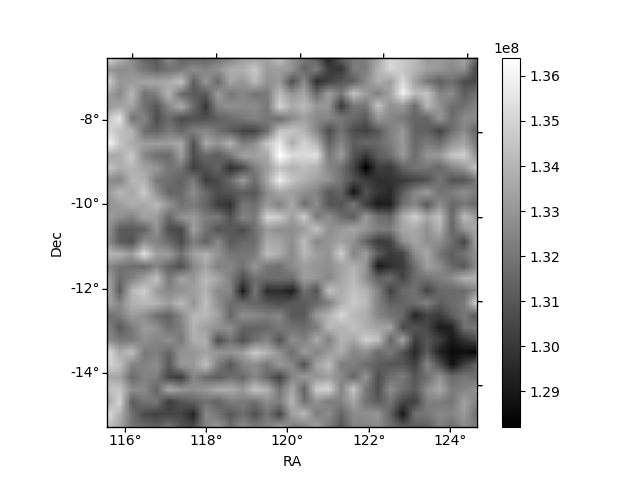
Quadrant B |
|---|---|---|---|
| Quadrant D | 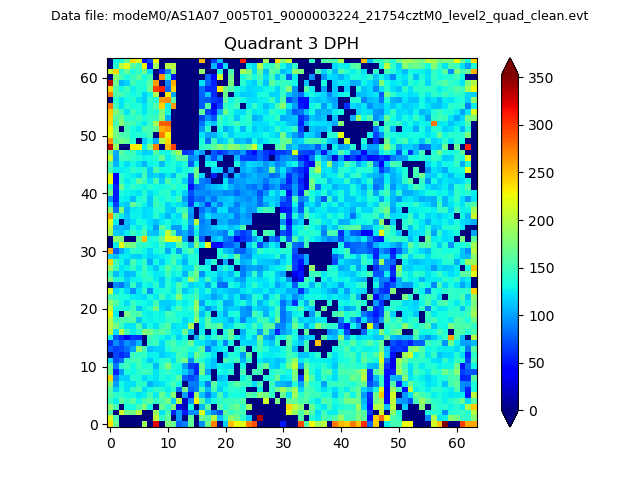 |
 |
Quadrant C |
| Plot type | Count rate plots | Images |
|---|---|---|
| Comparison with Poisson distribution Blue bars denote a histogram of data divided into 1 sec bins. Red curve is a Poisson curve with rate = median count rate of data. |
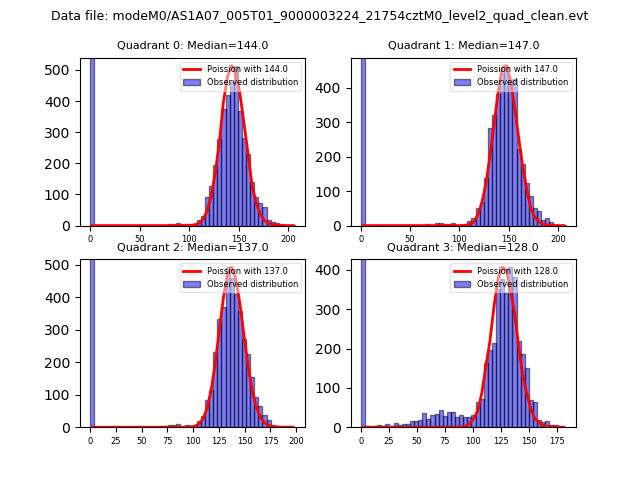 |
 |
| Quadrant-wise count rates Data is divided into 100 sec bins |
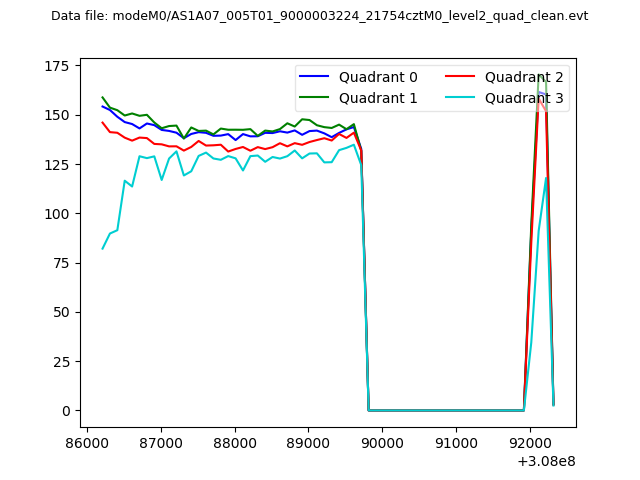 |
|
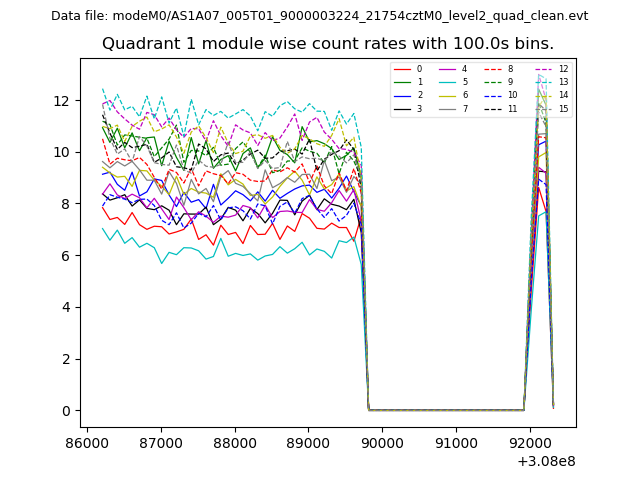
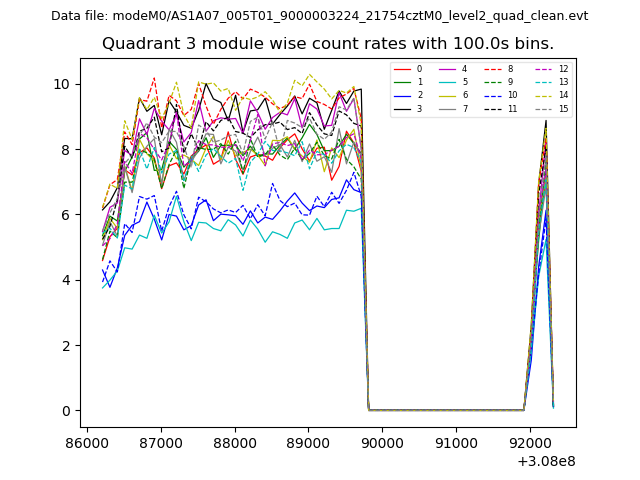
| Module-wise count rates for Quadrant A Data is divided into 100 sec bins |
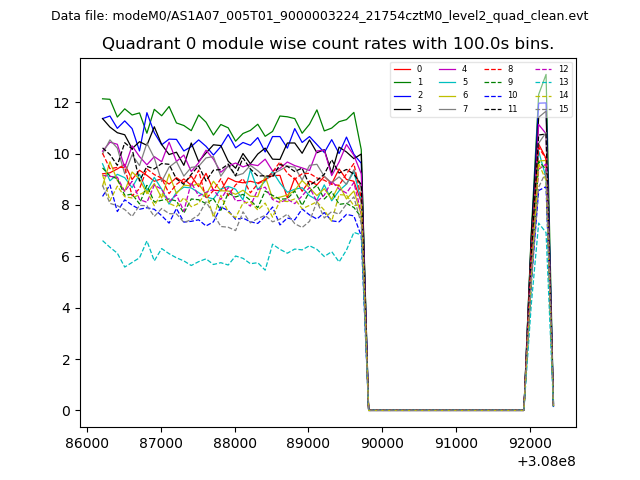 |
 |
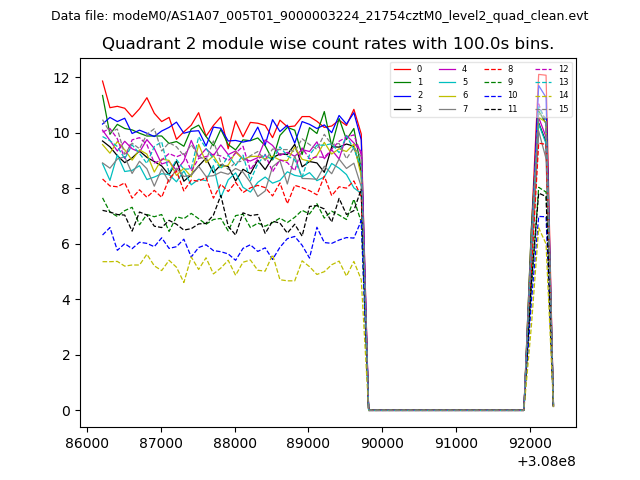
| Module-wise count rates for Quadrant B Data is divided into 100 sec bins |
 |
 |
| Module-wise count rates for Quadrant C Data is divided into 100 sec bins |
 |
 |
| Module-wise count rates for Quadrant D Data is divided into 100 sec bins |
 |
 |
| Parameter | Plot |
|---|---|
| CZT HV Monitor | 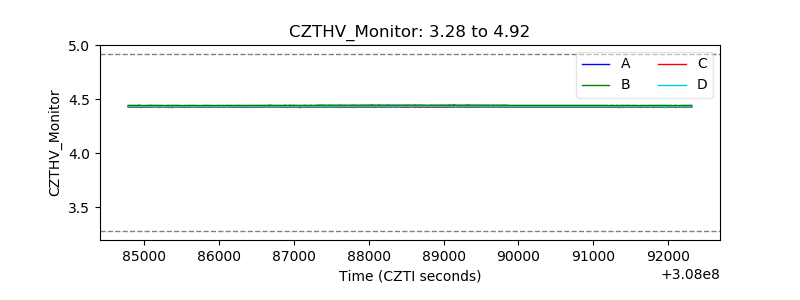 |
| D_VDD | 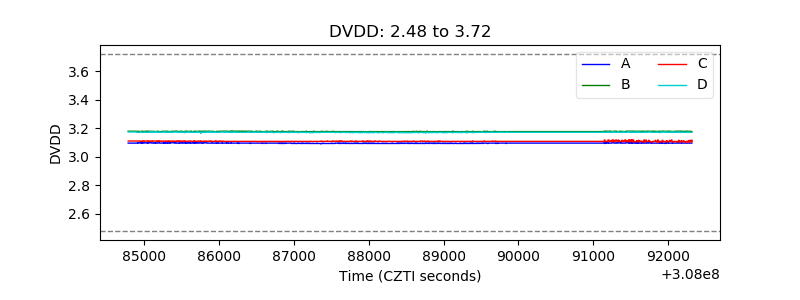 |
| Temperature 1 | 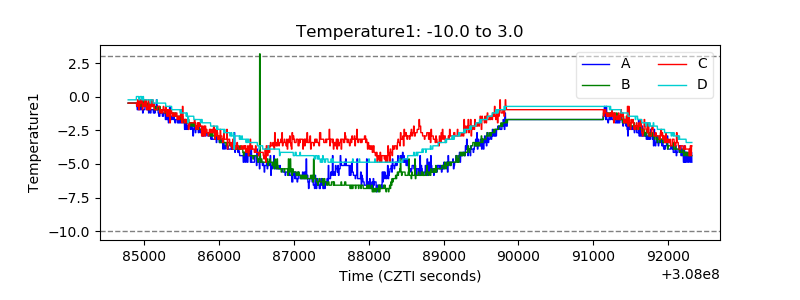 |
| Veto HV Monitor | 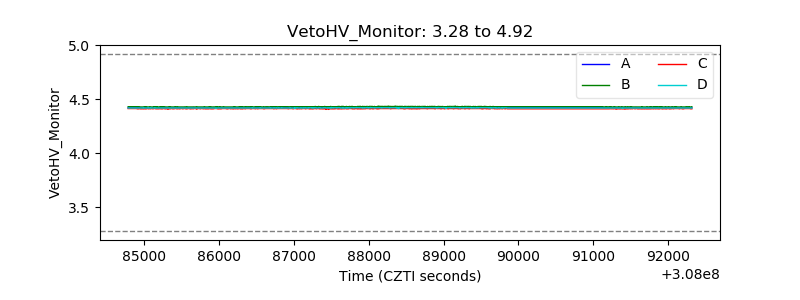 |
| Veto LLD | 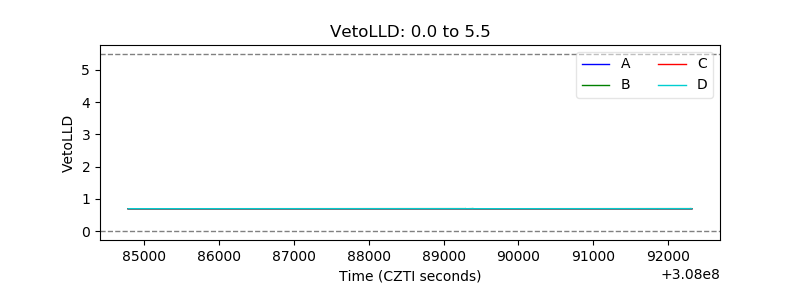 |
| Alpha Counter | 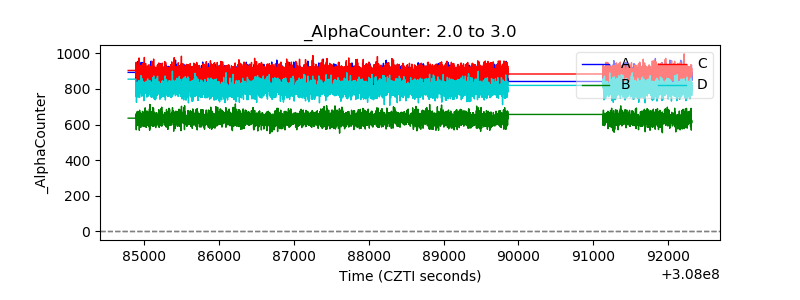 |
| _CPM_Rate | 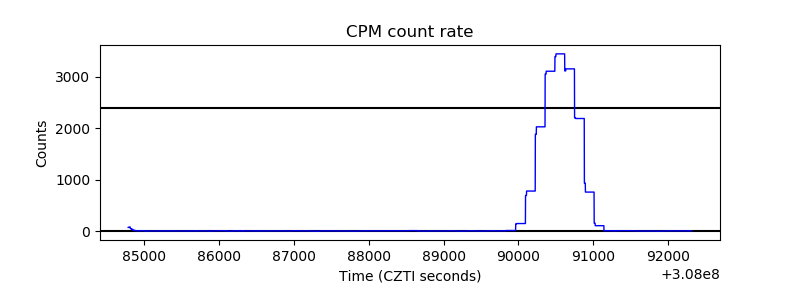 |
| CZT Counter | 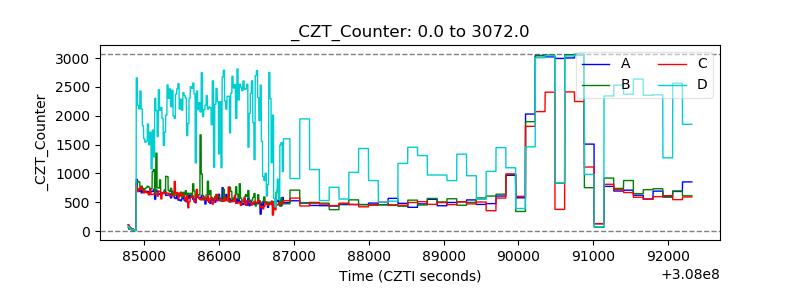 |
| +2.5 Volts monitor | 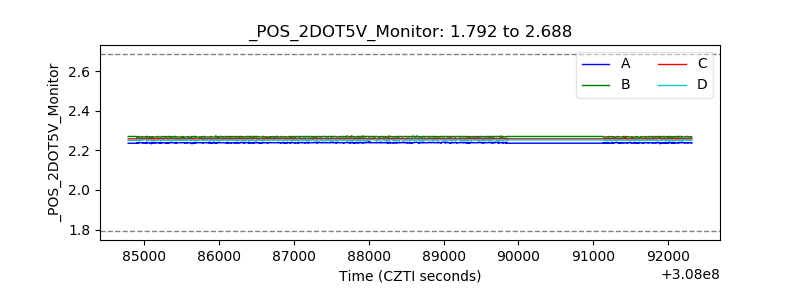 |
| +5 Volts monitor | 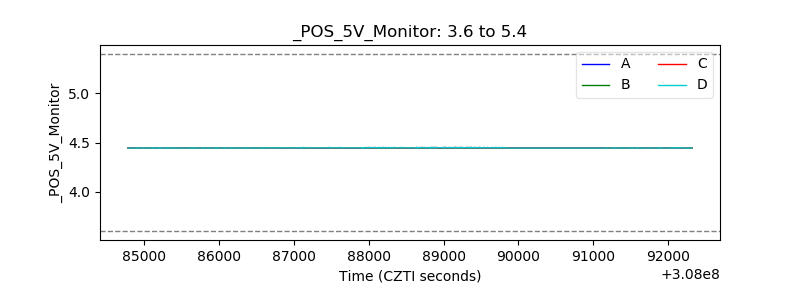 |
| _ROLL_ROT | 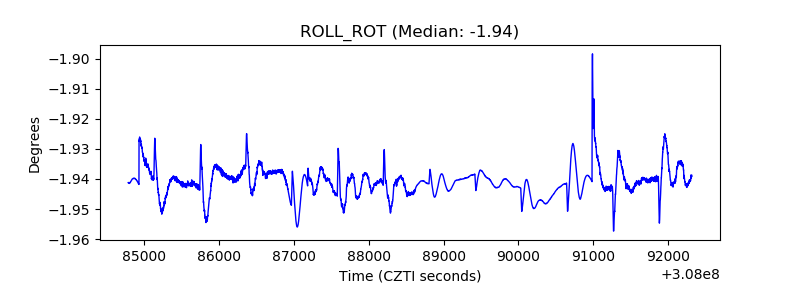 |
| _Roll_DEC | 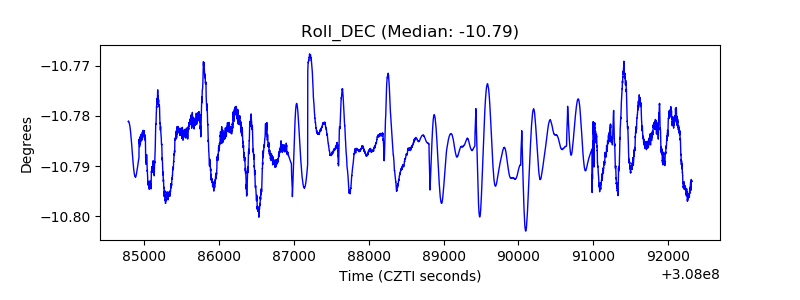 |
| _Roll_RA | 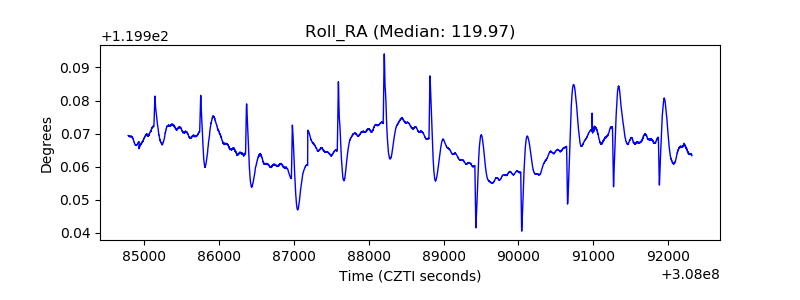 |
| Veto Counter | 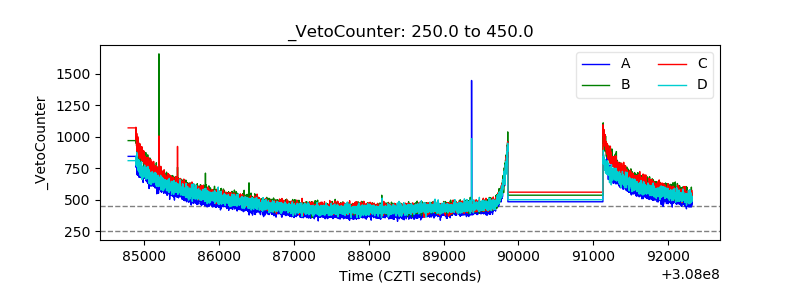 |