| Param | Original file | Final file |
|---|---|---|
| Filename | modeM0/AS1A07_005T01_9000003224_21755cztM0_level2.evt | modeM0/AS1A07_005T01_9000003224_21755cztM0_level2_quad_clean.evt |
| Size (bytes) | 635,912,640 | 94,271,040 |
| Size | 606.5 MB | 89.9 MB |
| Events in quadrant A | 3,410,193 | 627,621 |
| Events in quadrant B | 3,534,566 | 651,164 |
| Events in quadrant C | 3,293,998 | 605,341 |
| Events in quadrant D | 8,607,174 | 544,384 |
| Mode M9 | |||
|---|---|---|---|
| Quadrant | BADHDUFLAG | Total packets | Discarded packets |
| A | 0 | 18 | 0 |
| B | 0 | 19 | 0 |
| C | 0 | 19 | 0 |
| D | 0 | 19 | 0 |
| Mode M0 | |||
|---|---|---|---|
| Quadrant | BADHDUFLAG | Total packets | Discarded packets |
| A | 0 | 14134 | 2 |
| B | 0 | 14420 | 2 |
| C | 0 | 13567 | 2 |
| D | 0 | 29888 | 2 |
| Mode SS | |||
|---|---|---|---|
| Quadrant | BADHDUFLAG | Total packets | Discarded packets |
| A | 0 | 122 | 0 |
| B | 0 | 122 | 0 |
| C | 0 | 122 | 0 |
| D | 0 | 122 | 0 |
| Quadrant | Total seconds | Saturated seconds | Saturation percentage |
|---|---|---|---|
| A | 6111 | 69 | 1.129111% |
| B | 6111 | 94 | 1.538210% |
| C | 6111 | 107 | 1.750941% |
| D | 6111 | 1712 | 28.015055% |
Noise dominated data is calculated using 1-second bins in cleaned event files. If a bin has >2000 counts, and if more than 50% of those come from <1% of pixels, then it is considered to be noise-dominated and hence unusable.
| Quadrant | # 1 sec bins | Bins with >0 counts | Bins with >2000 counts | High rate bins dominated by noise | Noise dominated (total time) | Noise dominated (detector-on time) | Marked lightcurve |
|---|---|---|---|---|---|---|---|
| A | 7456 | 6112 | 0 | 0 | 0.00% | 0.00% | 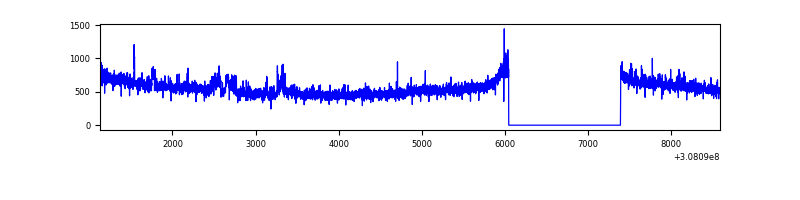 |
| B | 7456 | 6112 | 8 | 8 | 0.11% | 0.13% | 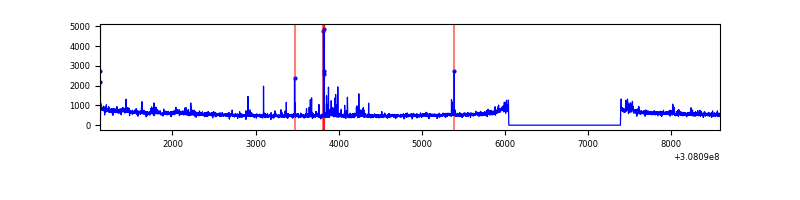 |
| C | 7456 | 6112 | 0 | 0 | 0.00% | 0.00% | 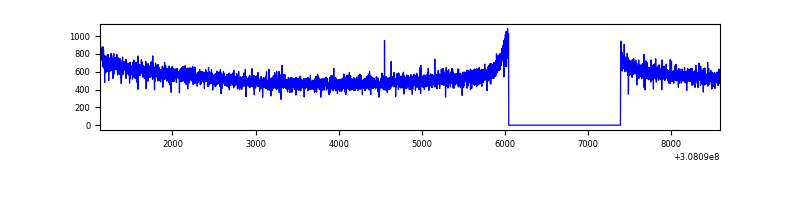 |
| D | 7456 | 6112 | 1331 | 1331 | 17.85% | 21.78% | 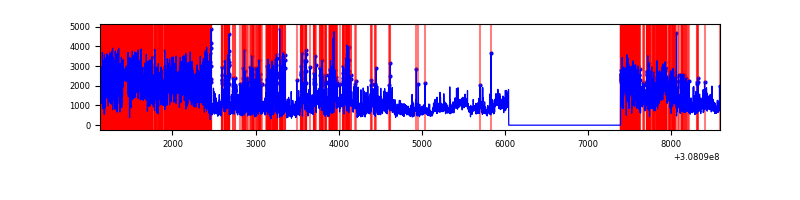 |
Top three noisy pixels from each quadrant. If the there are fewer than three noisy pixels in the level2.evt file, extra rows are filled as -1
| Pixel properties | Quadrant properties | ||||||
|---|---|---|---|---|---|---|---|
| Quadrant | DetID | PixID | Counts | Sigma | Mean | Median | Sigma |
| A | 15 | 236 | 166049 | 992.62 | 840 | 825 | 166.5 |
| A | 13 | 254 | 11598 | 64.72 | 840 | 825 | 166.5 |
| A | 0 | 226 | 7502 | 40.11 | 840 | 825 | 166.5 |
| B | 3 | 64 | 87670 | 549.53 | 849 | 831 | 158.0 |
| B | 0 | 230 | 32481 | 200.28 | 849 | 831 | 158.0 |
| B | 0 | 190 | 32453 | 200.11 | 849 | 831 | 158.0 |
| C | 14 | 238 | 130168 | 695.7 | 806 | 815 | 185.9 |
| C | 8 | 128 | 9687 | 47.72 | 806 | 815 | 185.9 |
| C | 13 | 61 | 5692 | 26.23 | 806 | 815 | 185.9 |
| D | 7 | 238 | 3045874 | 17418.21 | 717 | 697 | 174.8 |
| D | 7 | 38 | 1144138 | 6540.41 | 717 | 697 | 174.8 |
| D | 1 | 52 | 656526 | 3751.3 | 717 | 697 | 174.8 |
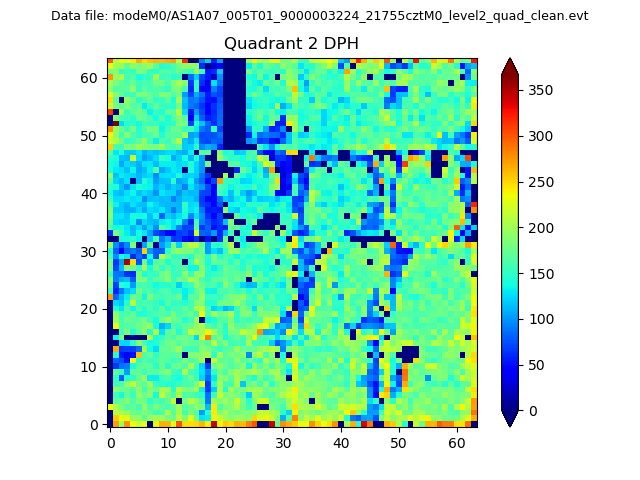
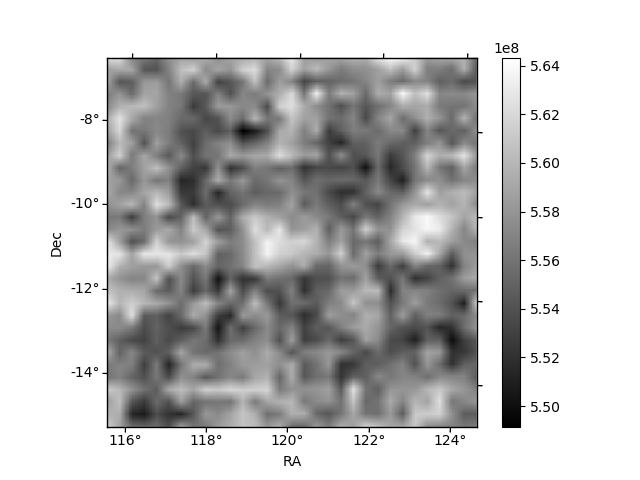
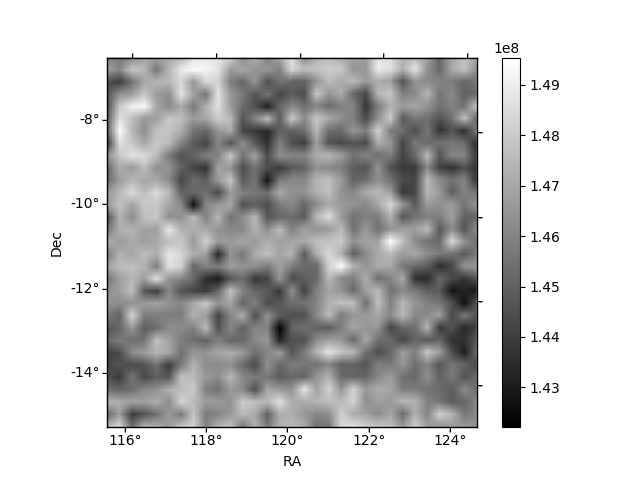
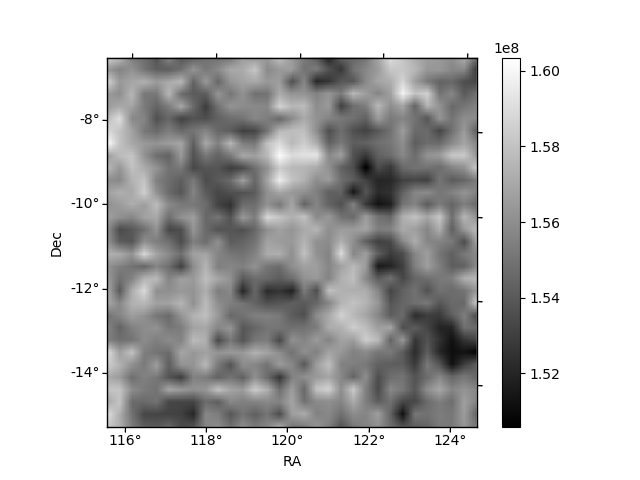
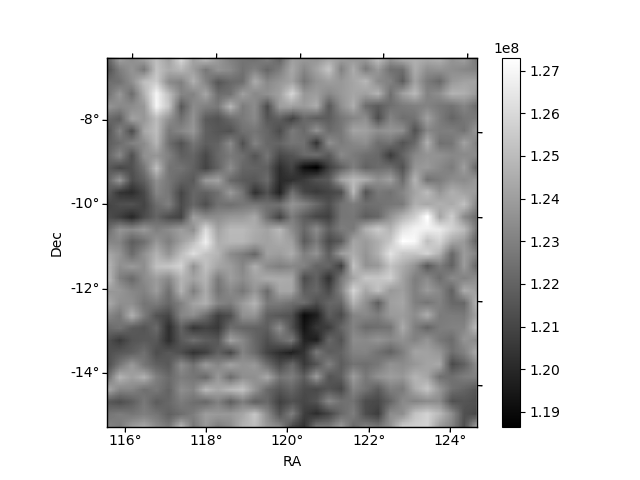
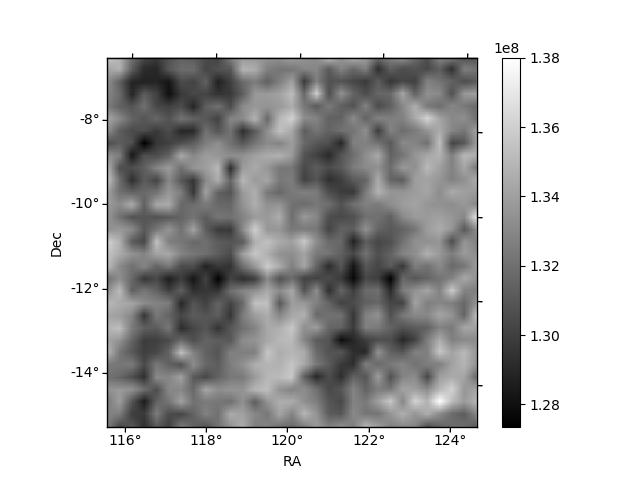
Histogram calculated using DETX and DETY for each event in the final _common_clean file
| Quadrant A | 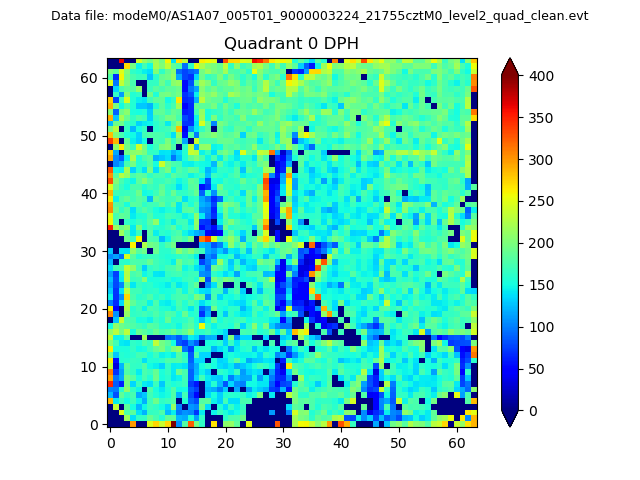 |
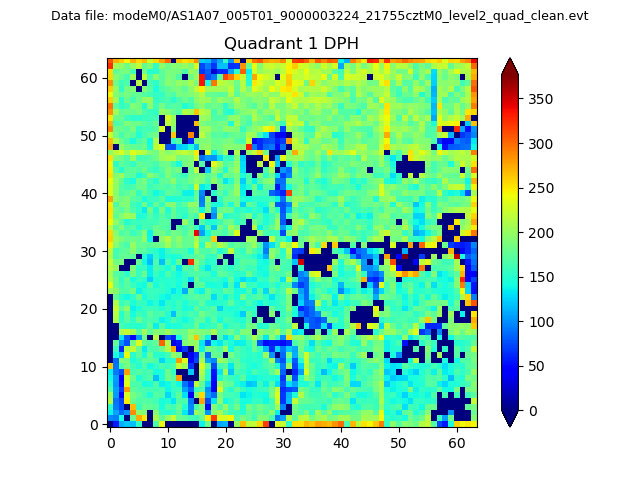 |
Quadrant B |
|---|---|---|---|
| Quadrant D | 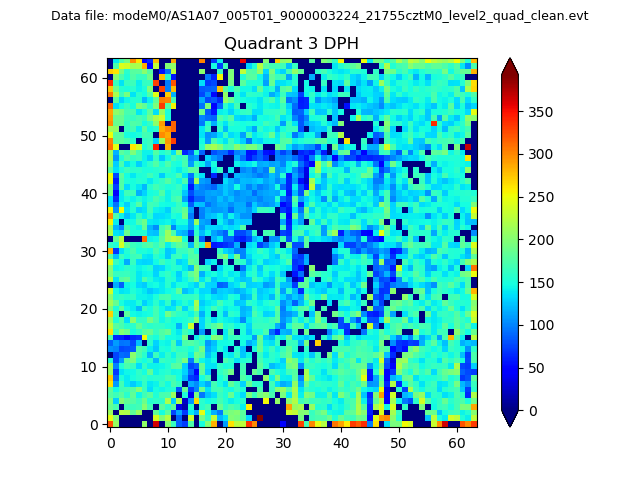 |
 |
Quadrant C |
| Plot type | Count rate plots | Images |
|---|---|---|
| Comparison with Poisson distribution Blue bars denote a histogram of data divided into 1 sec bins. Red curve is a Poisson curve with rate = median count rate of data. |
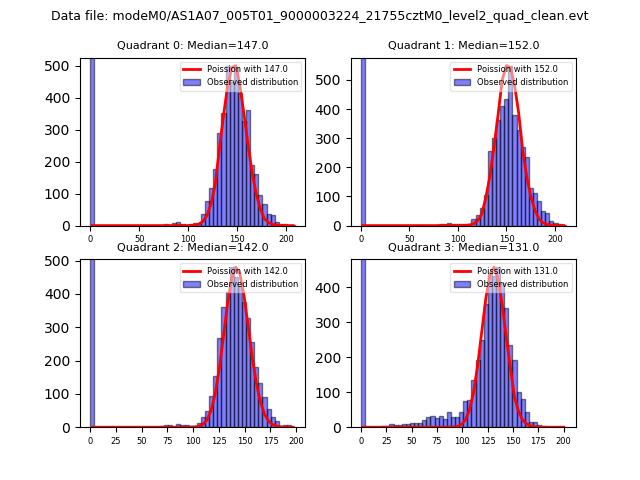 |
 |
| Quadrant-wise count rates Data is divided into 100 sec bins |
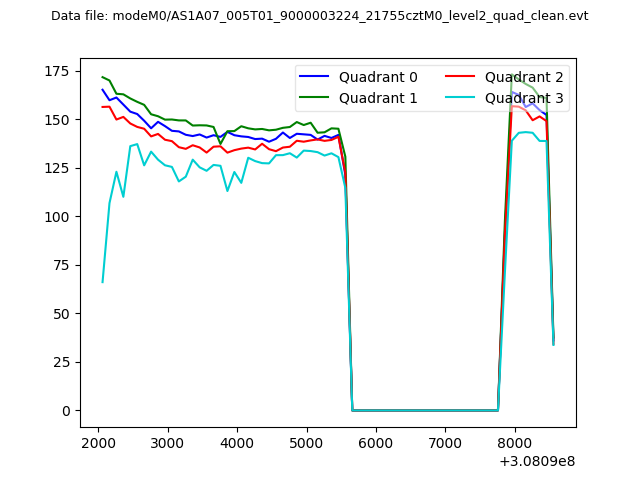 |
|
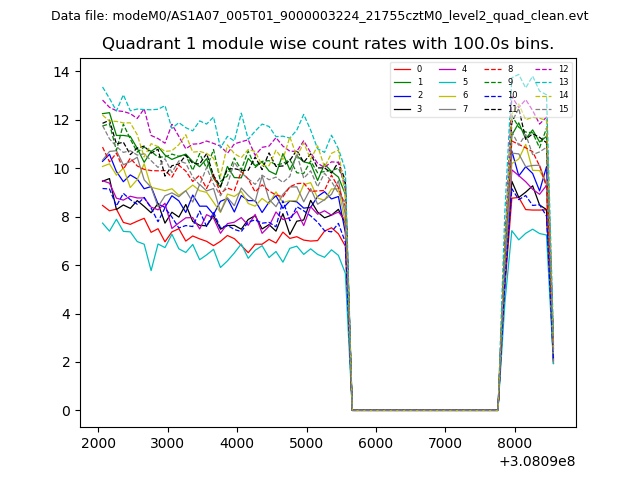
| Module-wise count rates for Quadrant A Data is divided into 100 sec bins |
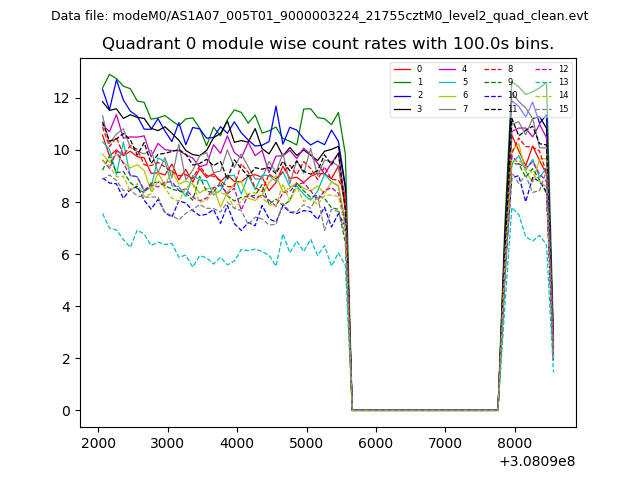 |
 |
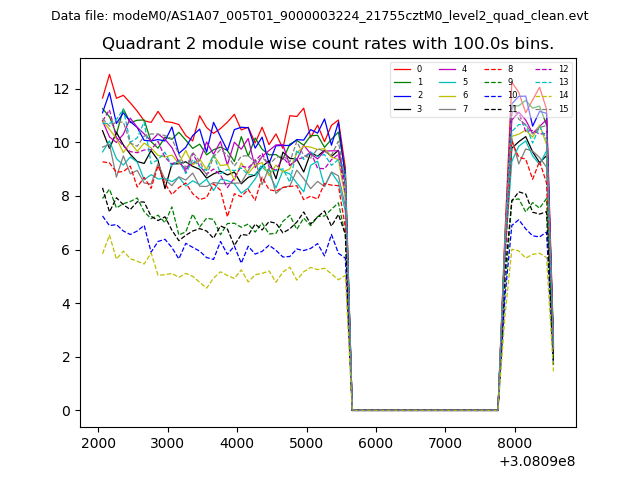
| Module-wise count rates for Quadrant B Data is divided into 100 sec bins |
 |
 |
| Module-wise count rates for Quadrant C Data is divided into 100 sec bins |
 |
 |
| Module-wise count rates for Quadrant D Data is divided into 100 sec bins |
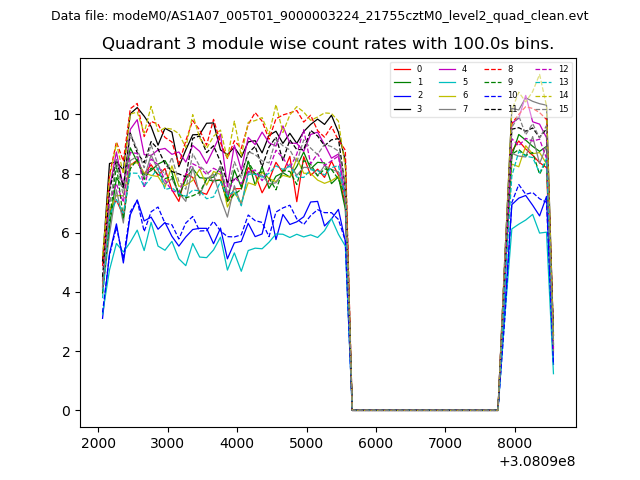 |
 |
| Parameter | Plot |
|---|---|
| CZT HV Monitor | 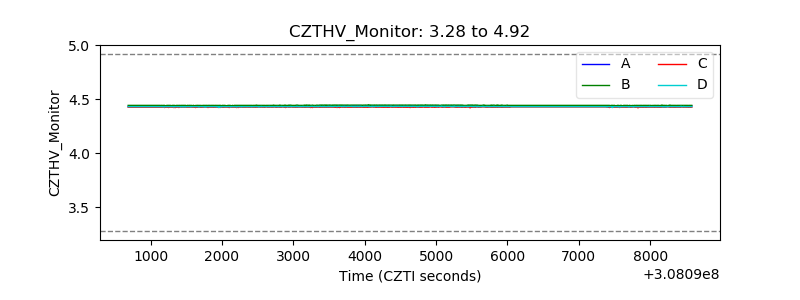 |
| D_VDD | 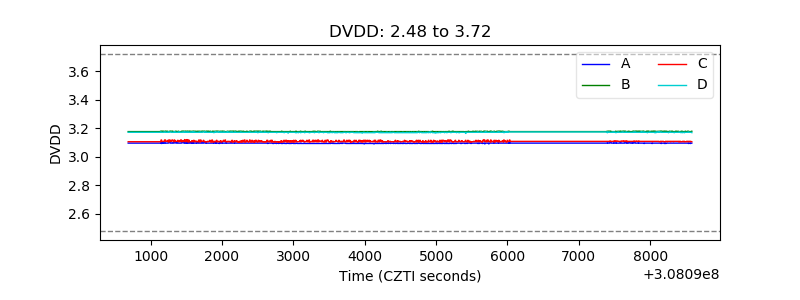 |
| Temperature 1 | 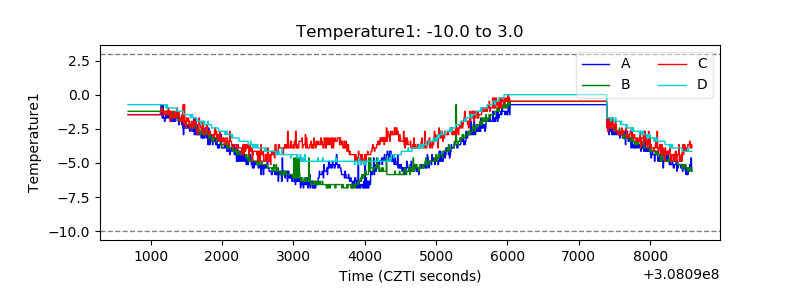 |
| Veto HV Monitor | 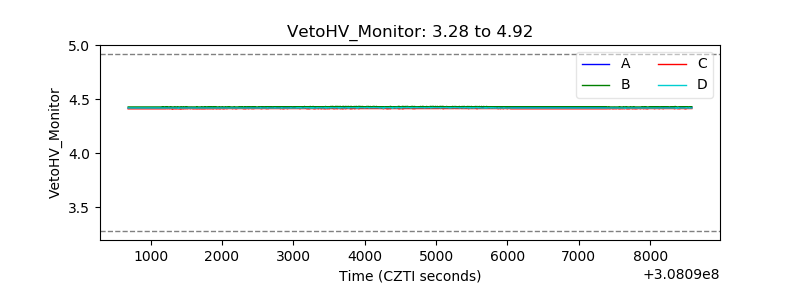 |
| Veto LLD | 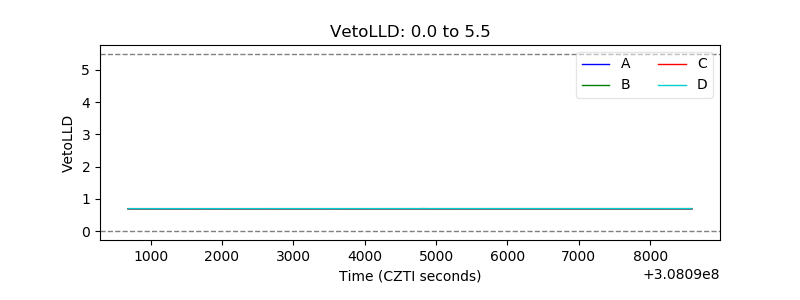 |
| Alpha Counter | 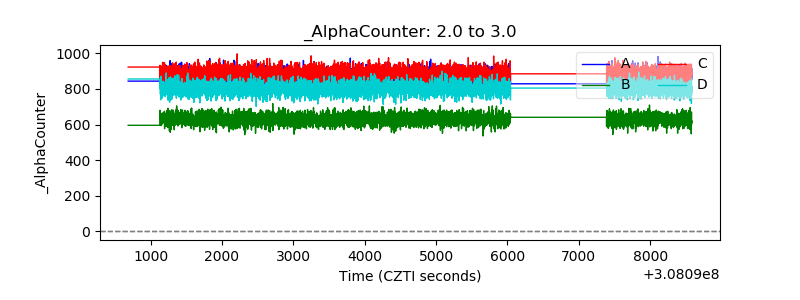 |
| _CPM_Rate |  |
| CZT Counter | 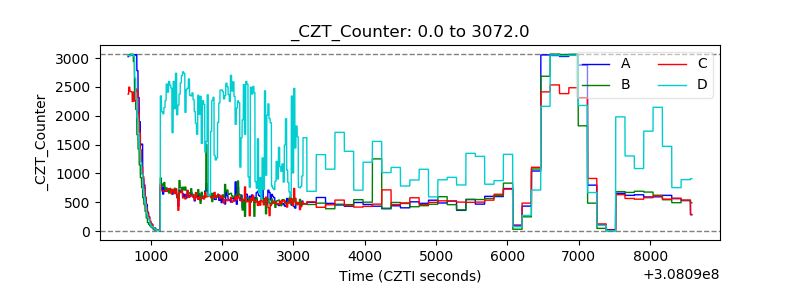 |
| +2.5 Volts monitor |  |
| +5 Volts monitor |  |
| _ROLL_ROT | 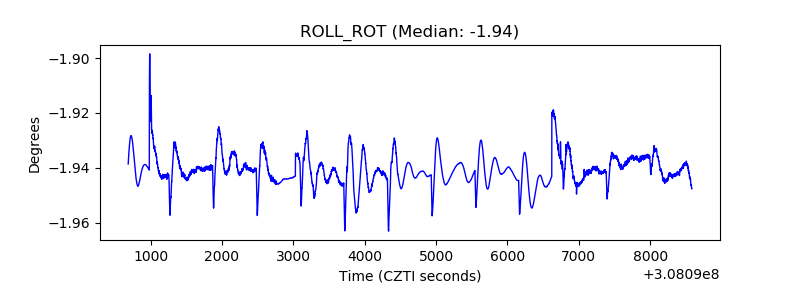 |
| _Roll_DEC | 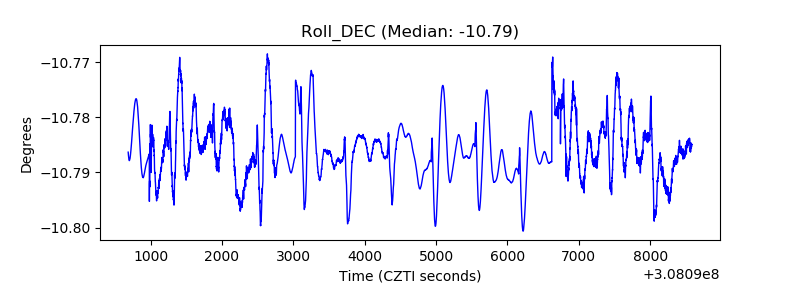 |
| _Roll_RA | 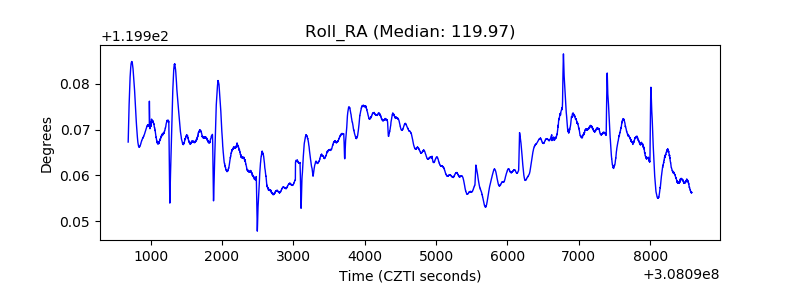 |
| Veto Counter | 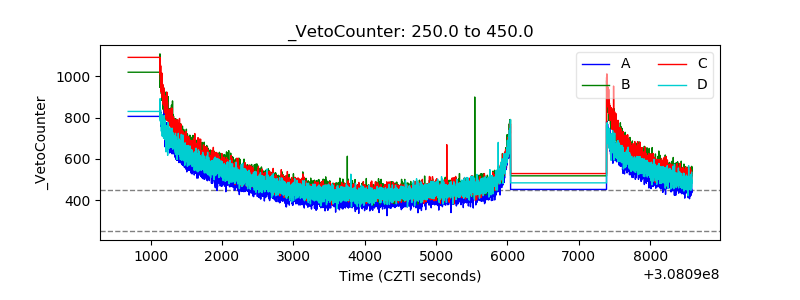 |