| Param | Original file | Final file |
|---|---|---|
| Filename | modeM0/AS1A07_005T01_9000003224_21756cztM0_level2.evt | modeM0/AS1A07_005T01_9000003224_21756cztM0_level2_quad_clean.evt |
| Size (bytes) | 635,538,240 | 102,663,360 |
| Size | 606.1 MB | 97.9 MB |
| Events in quadrant A | 3,271,197 | 691,808 |
| Events in quadrant B | 3,642,581 | 717,549 |
| Events in quadrant C | 3,222,002 | 673,321 |
| Events in quadrant D | 8,691,403 | 592,297 |
| Mode M9 | |||
|---|---|---|---|
| Quadrant | BADHDUFLAG | Total packets | Discarded packets |
| A | 0 | 20 | 0 |
| B | 0 | 21 | 0 |
| C | 0 | 21 | 0 |
| D | 0 | 21 | 0 |
| Mode M0 | |||
|---|---|---|---|
| Quadrant | BADHDUFLAG | Total packets | Discarded packets |
| A | 0 | 13665 | 2 |
| B | 0 | 14766 | 3 |
| C | 0 | 13319 | 2 |
| D | 0 | 30251 | 2 |
| Mode SS | |||
|---|---|---|---|
| Quadrant | BADHDUFLAG | Total packets | Discarded packets |
| A | 0 | 126 | 0 |
| B | 0 | 126 | 0 |
| C | 0 | 126 | 0 |
| D | 0 | 126 | 0 |
| Quadrant | Total seconds | Saturated seconds | Saturation percentage |
|---|---|---|---|
| A | 6219 | 36 | 0.578871% |
| B | 6218 | 101 | 1.624317% |
| C | 6218 | 73 | 1.174011% |
| D | 6218 | 1451 | 23.335478% |
Noise dominated data is calculated using 1-second bins in cleaned event files. If a bin has >2000 counts, and if more than 50% of those come from <1% of pixels, then it is considered to be noise-dominated and hence unusable.
| Quadrant | # 1 sec bins | Bins with >0 counts | Bins with >2000 counts | High rate bins dominated by noise | Noise dominated (total time) | Noise dominated (detector-on time) | Marked lightcurve |
|---|---|---|---|---|---|---|---|
| A | 7559 | 6220 | 0 | 0 | 0.00% | 0.00% | 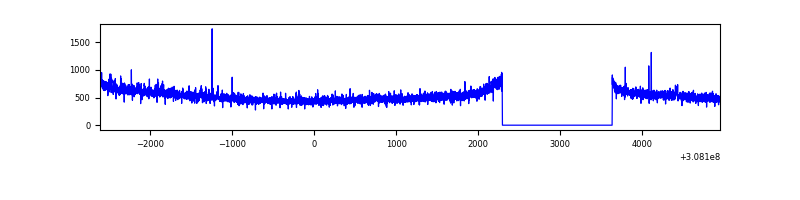 |
| B | 7558 | 6219 | 21 | 21 | 0.28% | 0.34% |  |
| C | 7558 | 6219 | 0 | 0 | 0.00% | 0.00% | 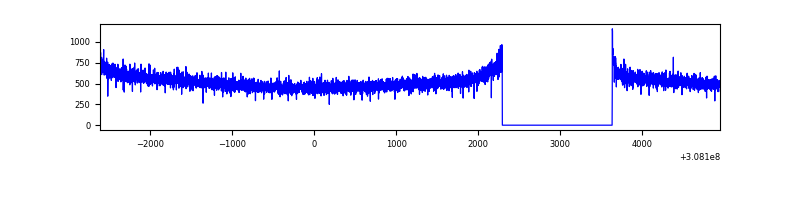 |
| D | 7558 | 6219 | 1270 | 1270 | 16.80% | 20.42% | 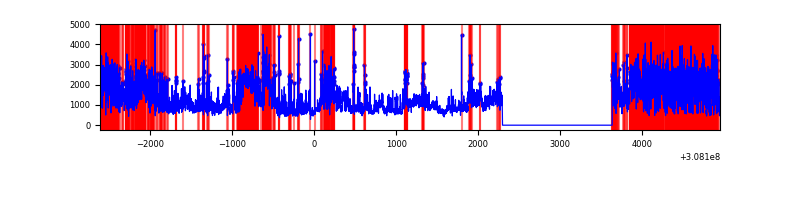 |
Top three noisy pixels from each quadrant. If the there are fewer than three noisy pixels in the level2.evt file, extra rows are filled as -1
| Pixel properties | Quadrant properties | ||||||
|---|---|---|---|---|---|---|---|
| Quadrant | DetID | PixID | Counts | Sigma | Mean | Median | Sigma |
| A | 15 | 236 | 95280 | 580.55 | 820 | 807 | 162.7 |
| A | 13 | 254 | 11941 | 68.42 | 820 | 807 | 162.7 |
| A | 4 | 2 | 10292 | 58.29 | 820 | 807 | 162.7 |
| B | 3 | 64 | 206970 | 1338.18 | 829 | 813 | 154.1 |
| B | 0 | 230 | 69011 | 442.68 | 829 | 813 | 154.1 |
| B | 0 | 189 | 49137 | 313.67 | 829 | 813 | 154.1 |
| C | 14 | 238 | 126843 | 686.32 | 793 | 798 | 183.7 |
| C | 13 | 61 | 5581 | 26.04 | 793 | 798 | 183.7 |
| C | 0 | 10 | 3228 | 13.23 | 793 | 798 | 183.7 |
| D | 7 | 238 | 4270467 | 23758.38 | 740 | 720 | 179.7 |
| D | 1 | 52 | 618425 | 3437.13 | 740 | 720 | 179.7 |
| D | 7 | 223 | 372416 | 2068.25 | 740 | 720 | 179.7 |
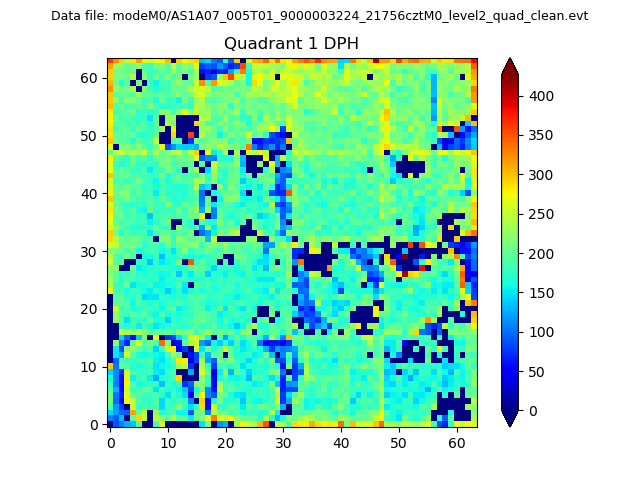
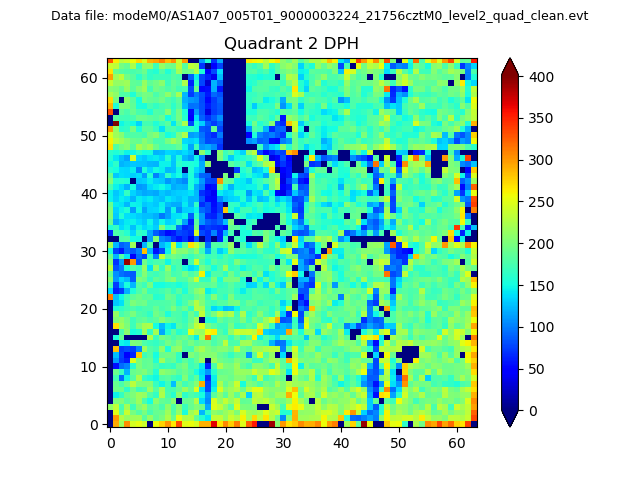
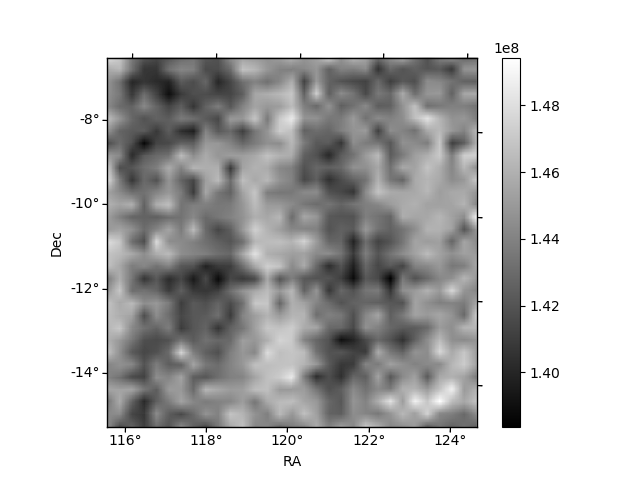
Histogram calculated using DETX and DETY for each event in the final _common_clean file
| Quadrant A | 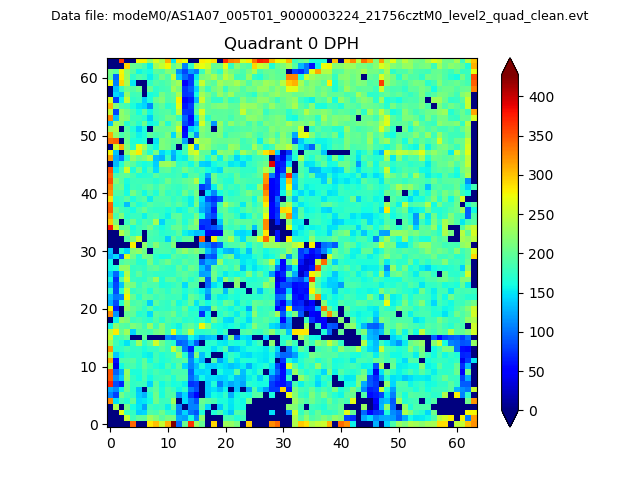 |
 |
Quadrant B |
|---|---|---|---|
| Quadrant D | 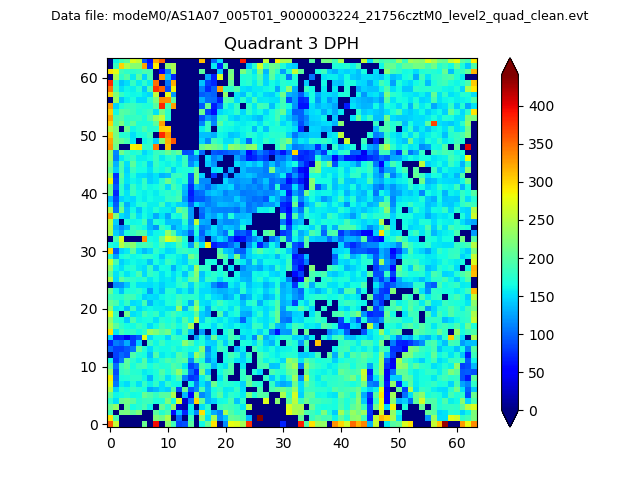 |
 |
Quadrant C |
| Plot type | Count rate plots | Images |
|---|---|---|
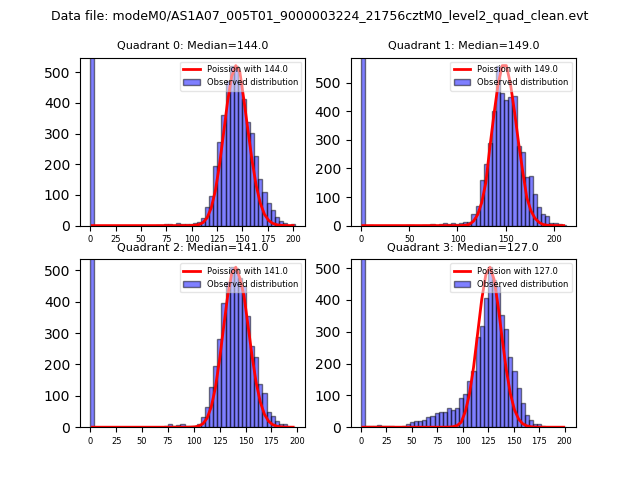
| Comparison with Poisson distribution Blue bars denote a histogram of data divided into 1 sec bins. Red curve is a Poisson curve with rate = median count rate of data. |
 |
 |
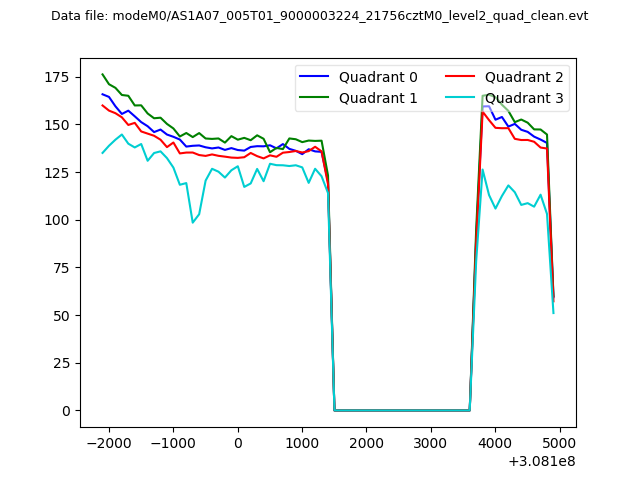
| Quadrant-wise count rates Data is divided into 100 sec bins |
 |
|
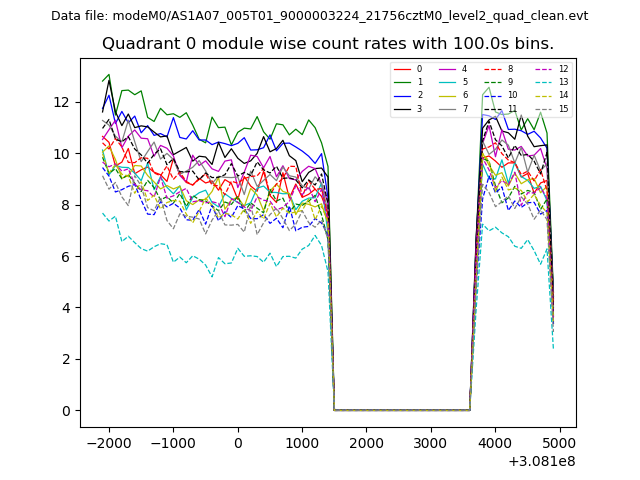
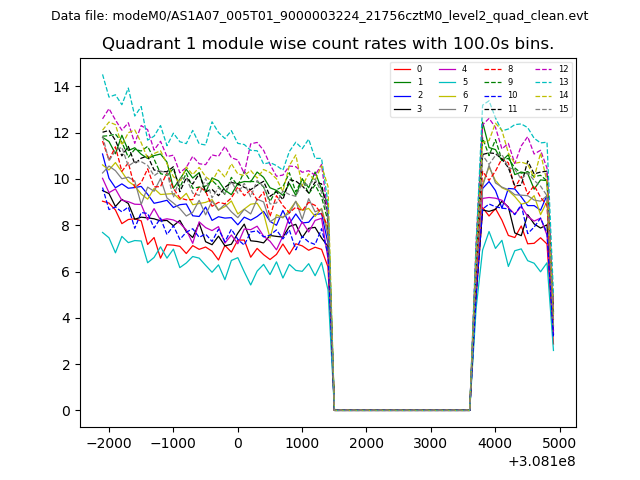
| Module-wise count rates for Quadrant A Data is divided into 100 sec bins |
 |
 |
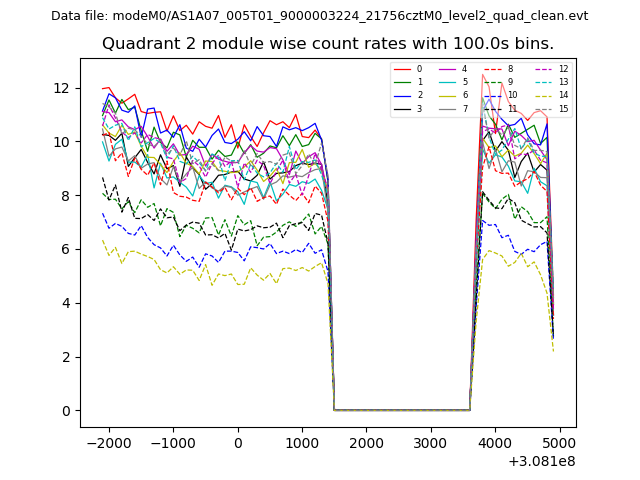
| Module-wise count rates for Quadrant B Data is divided into 100 sec bins |
 |
 |
| Module-wise count rates for Quadrant C Data is divided into 100 sec bins |
 |
 |
| Module-wise count rates for Quadrant D Data is divided into 100 sec bins |
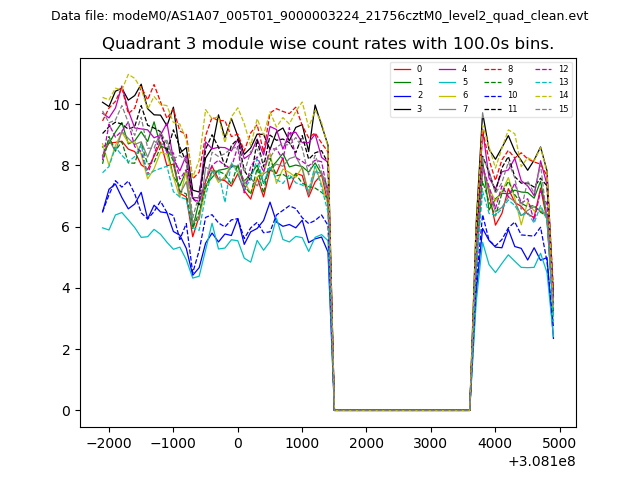 |
 |
| Parameter | Plot |
|---|---|
| CZT HV Monitor | 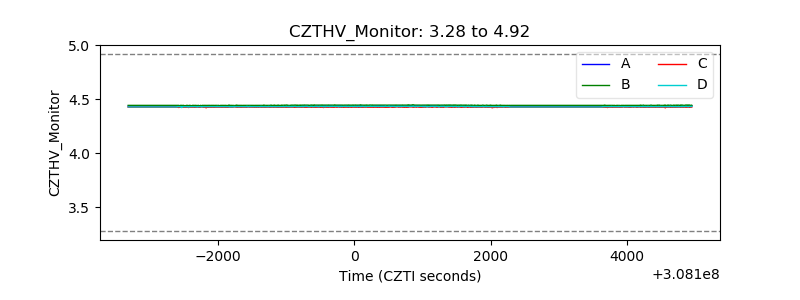 |
| D_VDD | 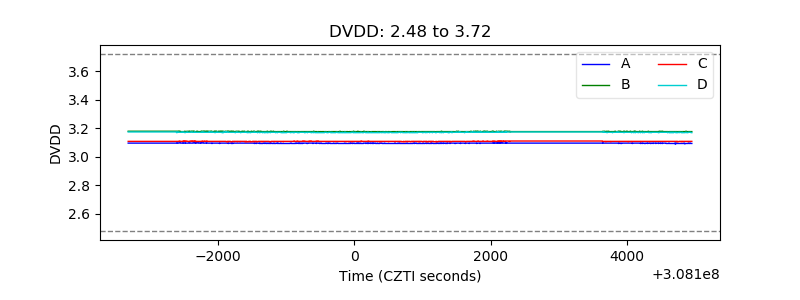 |
| Temperature 1 | 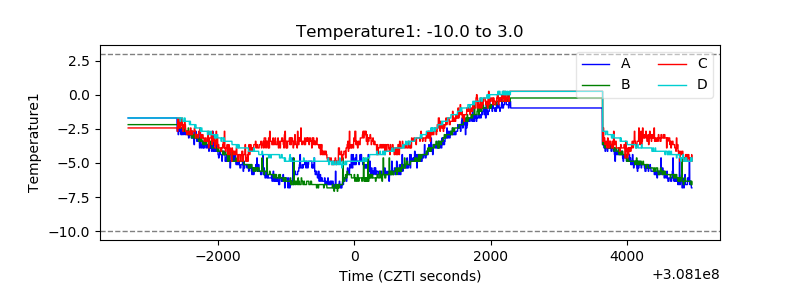 |
| Veto HV Monitor | 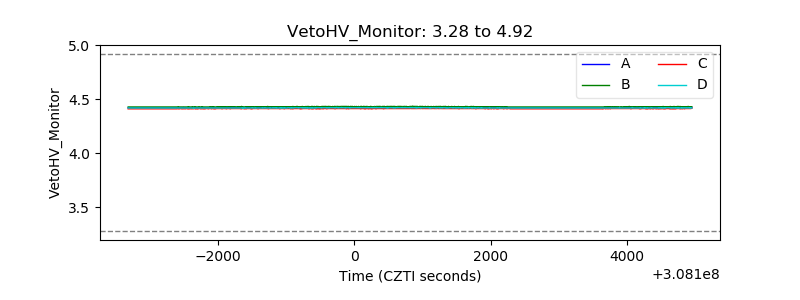 |
| Veto LLD | 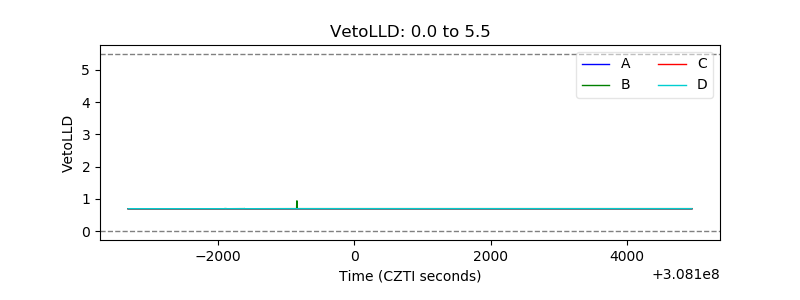 |
| Alpha Counter | 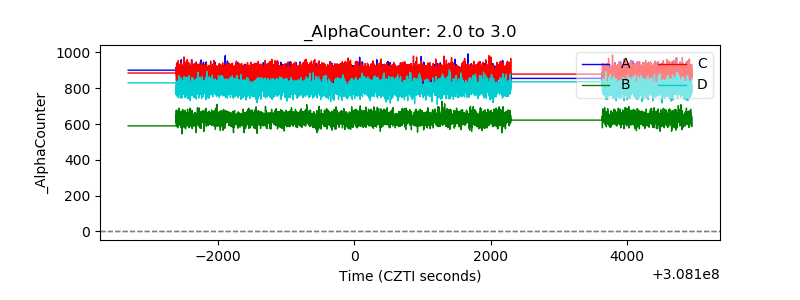 |
| _CPM_Rate | 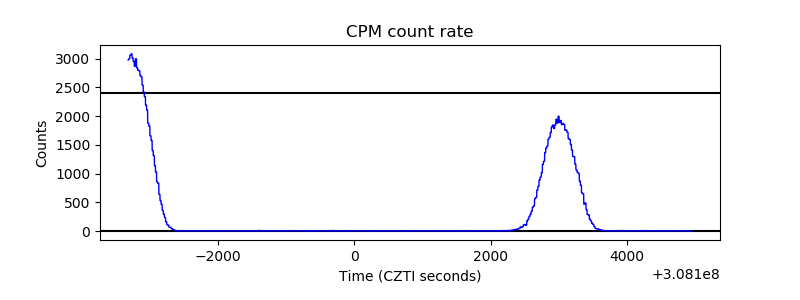 |
| CZT Counter | 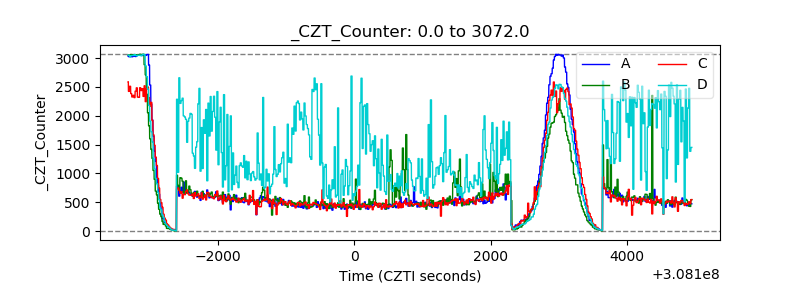 |
| +2.5 Volts monitor |  |
| +5 Volts monitor |  |
| _ROLL_ROT | 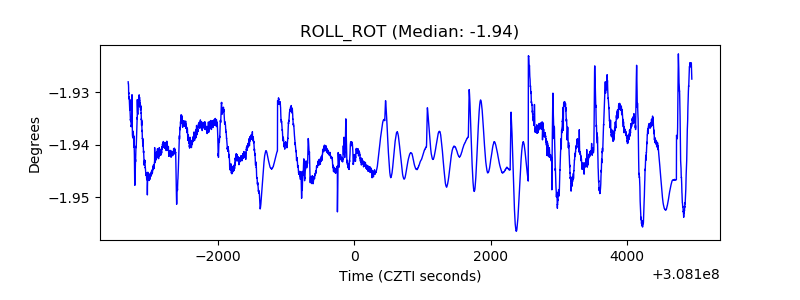 |
| _Roll_DEC |  |
| _Roll_RA | 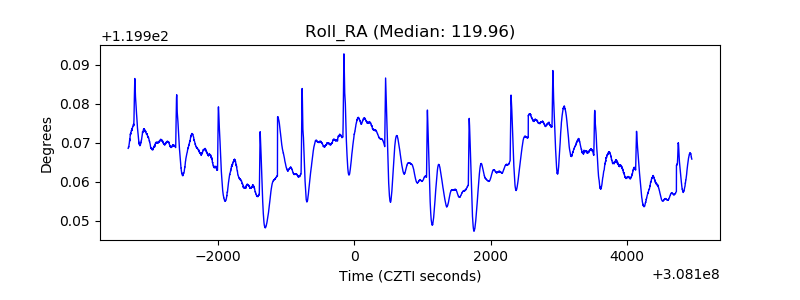 |
| Veto Counter | 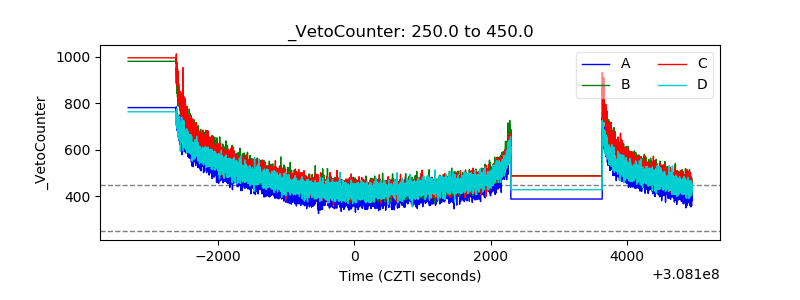 |