| Param | Original file | Final file |
|---|---|---|
| Filename | modeM0/AS1A07_005T01_9000003224_21757cztM0_level2.evt | modeM0/AS1A07_005T01_9000003224_21757cztM0_level2_quad_clean.evt |
| Size (bytes) | 673,344,000 | 100,189,440 |
| Size | 642.2 MB | 95.5 MB |
| Events in quadrant A | 3,179,508 | 683,037 |
| Events in quadrant B | 3,552,515 | 706,171 |
| Events in quadrant C | 3,206,166 | 665,023 |
| Events in quadrant D | 10,019,101 | 530,848 |
| Mode M9 | |||
|---|---|---|---|
| Quadrant | BADHDUFLAG | Total packets | Discarded packets |
| A | 0 | 21 | 0 |
| B | 0 | 22 | 0 |
| C | 0 | 22 | 0 |
| D | 0 | 22 | 0 |
| Mode M0 | |||
|---|---|---|---|
| Quadrant | BADHDUFLAG | Total packets | Discarded packets |
| A | 0 | 13512 | 2 |
| B | 0 | 14633 | 2 |
| C | 0 | 13433 | 2 |
| D | 0 | 34130 | 2 |
| Mode SS | |||
|---|---|---|---|
| Quadrant | BADHDUFLAG | Total packets | Discarded packets |
| A | 0 | 132 | 0 |
| B | 0 | 132 | 0 |
| C | 0 | 132 | 0 |
| D | 0 | 132 | 0 |
| Quadrant | Total seconds | Saturated seconds | Saturation percentage |
|---|---|---|---|
| A | 6421 | 32 | 0.498365% |
| B | 6421 | 90 | 1.401651% |
| C | 6421 | 57 | 0.887712% |
| D | 6421 | 2485 | 38.701137% |
Noise dominated data is calculated using 1-second bins in cleaned event files. If a bin has >2000 counts, and if more than 50% of those come from <1% of pixels, then it is considered to be noise-dominated and hence unusable.
| Quadrant | # 1 sec bins | Bins with >0 counts | Bins with >2000 counts | High rate bins dominated by noise | Noise dominated (total time) | Noise dominated (detector-on time) | Marked lightcurve |
|---|---|---|---|---|---|---|---|
| A | 7586 | 6423 | 0 | 0 | 0.00% | 0.00% | 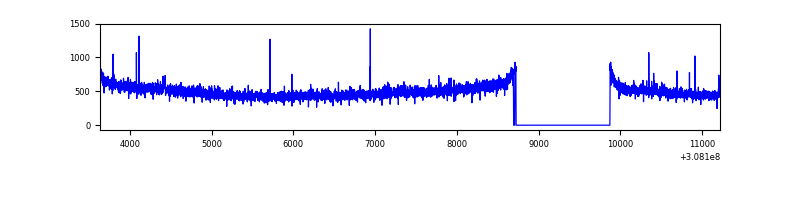 |
| B | 7586 | 6423 | 16 | 16 | 0.21% | 0.25% | 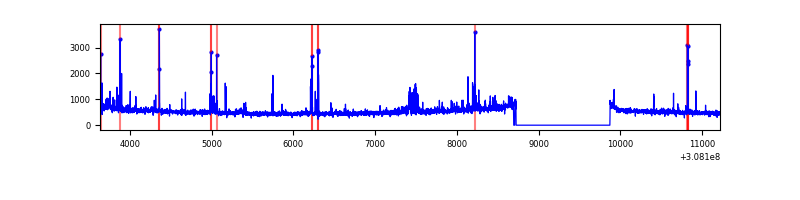 |
| C | 7586 | 6423 | 0 | 0 | 0.00% | 0.00% | 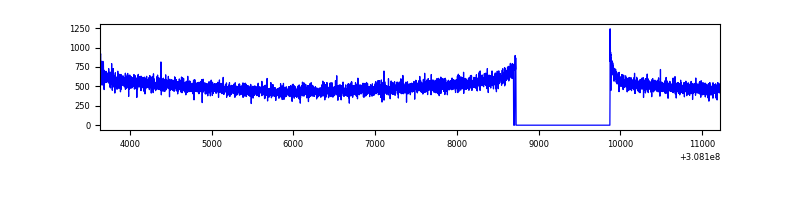 |
| D | 7586 | 6422 | 2192 | 2192 | 28.90% | 34.13% | 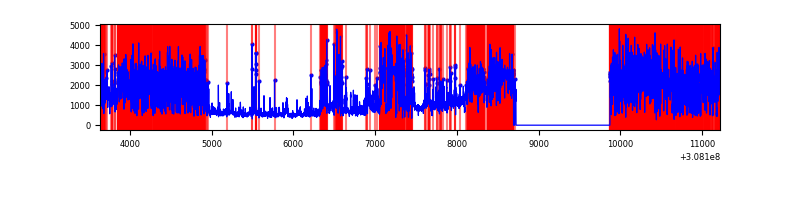 |
Top three noisy pixels from each quadrant. If the there are fewer than three noisy pixels in the level2.evt file, extra rows are filled as -1
| Pixel properties | Quadrant properties | ||||||
|---|---|---|---|---|---|---|---|
| Quadrant | DetID | PixID | Counts | Sigma | Mean | Median | Sigma |
| A | 15 | 236 | 39552 | 237.22 | 811 | 794 | 163.4 |
| A | 13 | 254 | 11760 | 67.12 | 811 | 794 | 163.4 |
| A | 4 | 2 | 9412 | 52.75 | 811 | 794 | 163.4 |
| B | 3 | 64 | 114338 | 729.54 | 823 | 805 | 155.6 |
| B | 0 | 230 | 84064 | 535.0 | 823 | 805 | 155.6 |
| B | 0 | 189 | 63583 | 403.4 | 823 | 805 | 155.6 |
| C | 14 | 238 | 123748 | 664.8 | 789 | 795 | 184.9 |
| C | 13 | 61 | 5452 | 25.18 | 789 | 795 | 184.9 |
| C | 0 | 10 | 3538 | 14.83 | 789 | 795 | 184.9 |
| D | 7 | 238 | 4377031 | 26986.21 | 663 | 646 | 162.2 |
| D | 1 | 52 | 2242737 | 13825.46 | 663 | 646 | 162.2 |
| D | 7 | 223 | 504689 | 3108.09 | 663 | 646 | 162.2 |
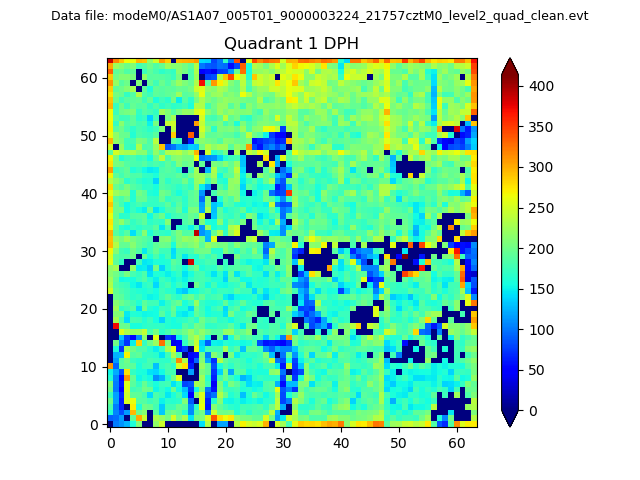
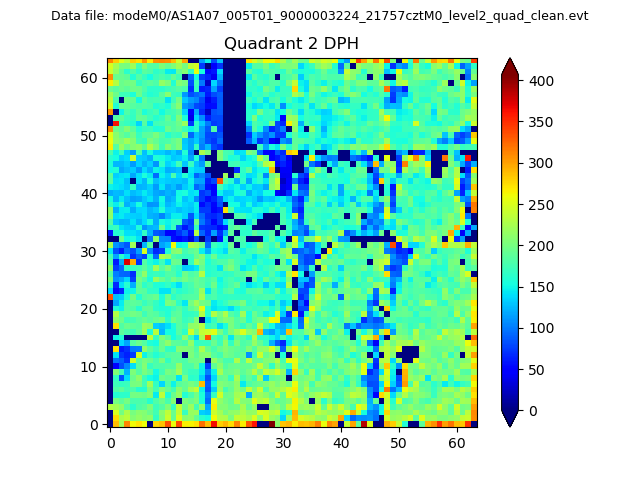
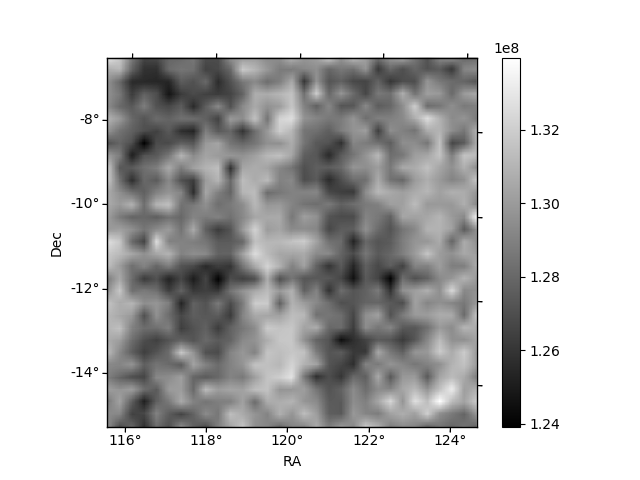
Histogram calculated using DETX and DETY for each event in the final _common_clean file
| Quadrant A |  |
 |
Quadrant B |
|---|---|---|---|
| Quadrant D |  |
 |
Quadrant C |
| Plot type | Count rate plots | Images |
|---|---|---|
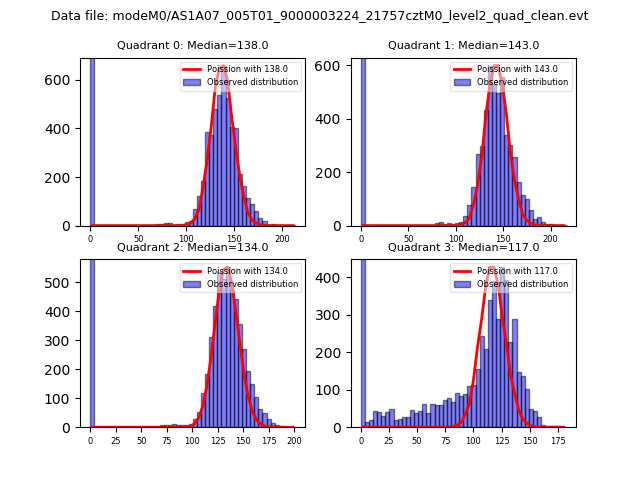
| Comparison with Poisson distribution Blue bars denote a histogram of data divided into 1 sec bins. Red curve is a Poisson curve with rate = median count rate of data. |
 |
 |
| Quadrant-wise count rates Data is divided into 100 sec bins |
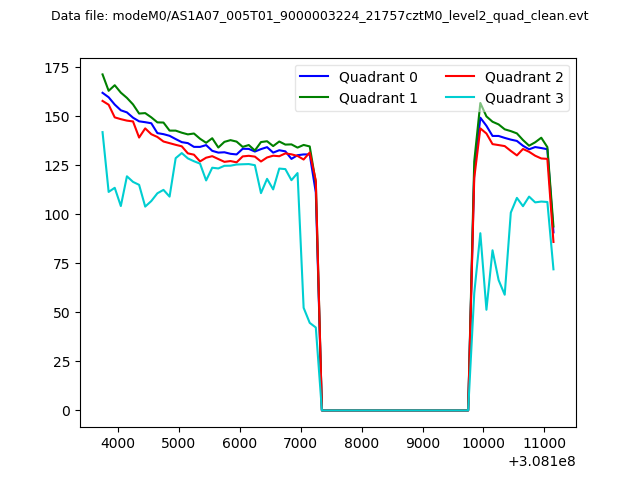 |
|
| Module-wise count rates for Quadrant A Data is divided into 100 sec bins |
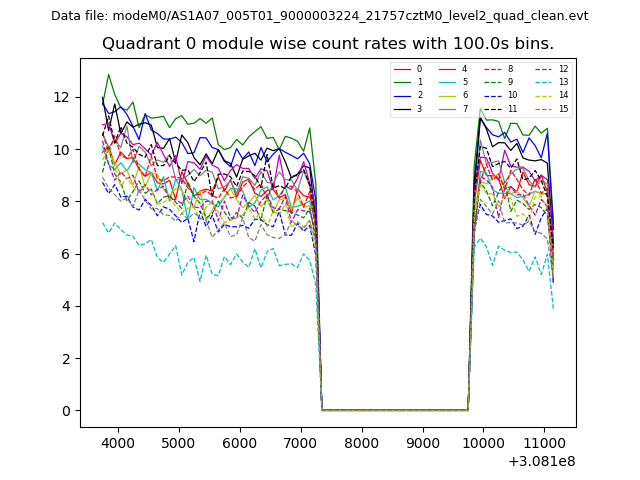 |
 |
| Module-wise count rates for Quadrant B Data is divided into 100 sec bins |
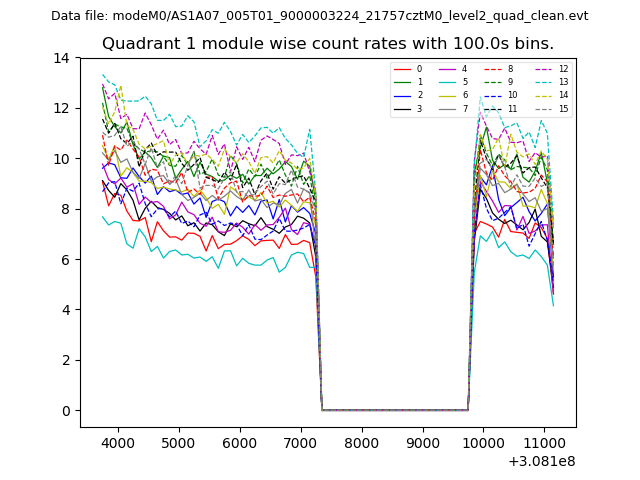 |
 |
| Module-wise count rates for Quadrant C Data is divided into 100 sec bins |
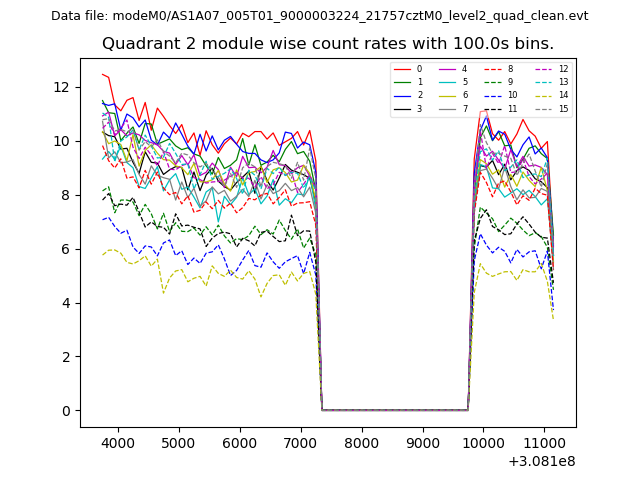 |
 |
| Module-wise count rates for Quadrant D Data is divided into 100 sec bins |
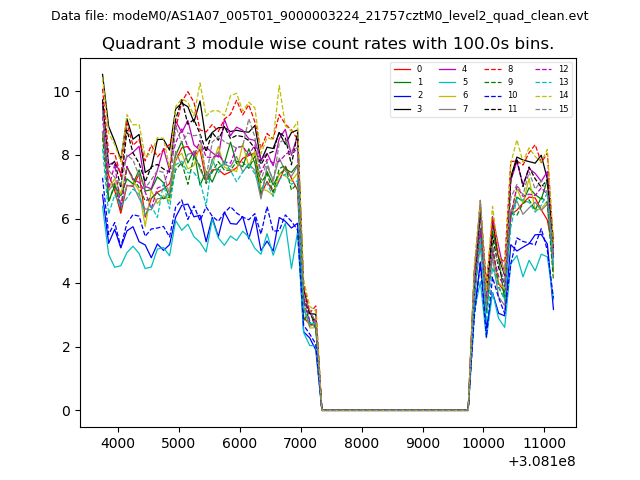 |
 |
| Parameter | Plot |
|---|---|
| CZT HV Monitor | 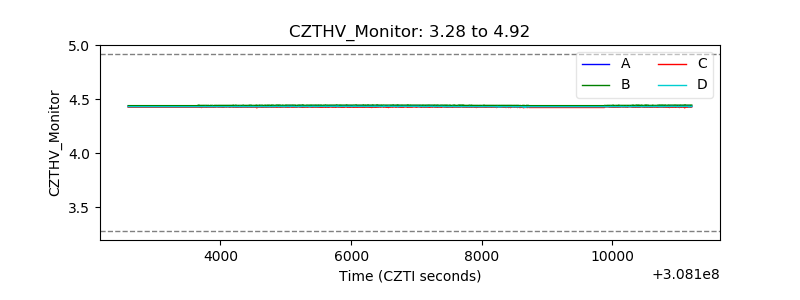 |
| D_VDD | 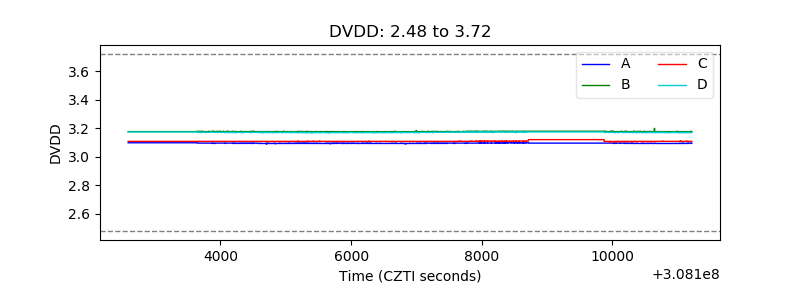 |
| Temperature 1 | 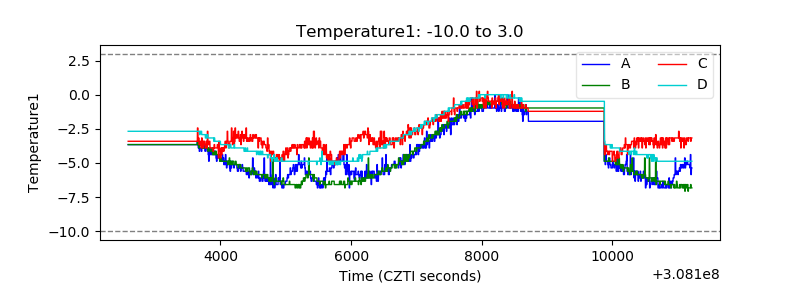 |
| Veto HV Monitor | 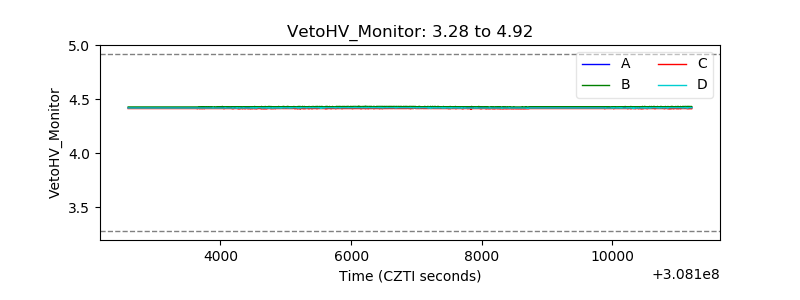 |
| Veto LLD | 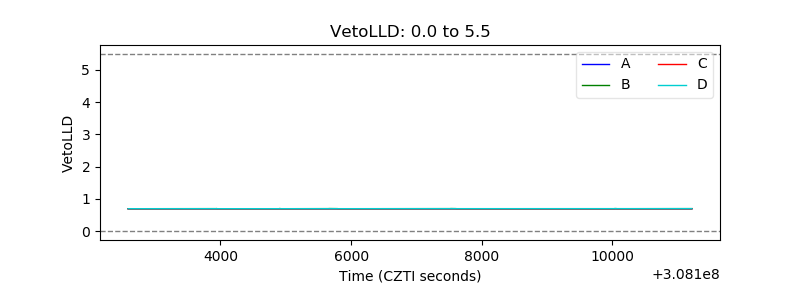 |
| Alpha Counter | 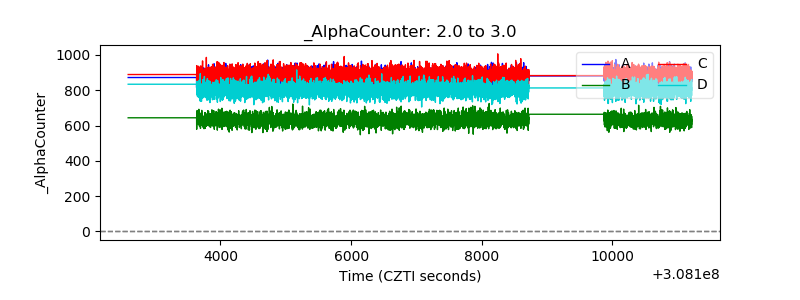 |
| _CPM_Rate | 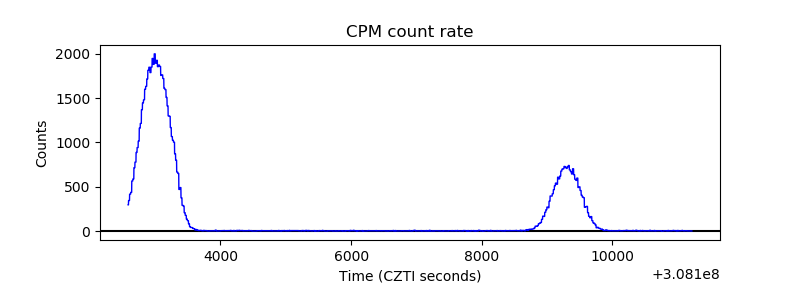 |
| CZT Counter | 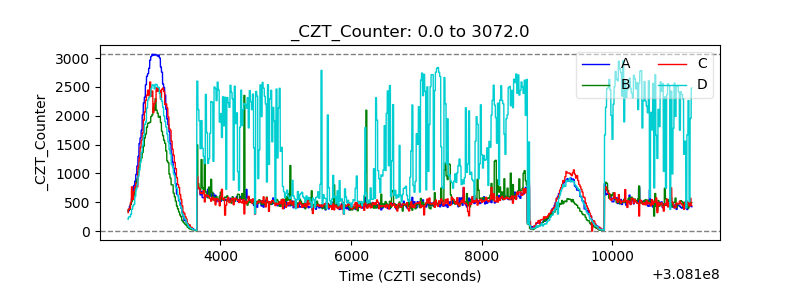 |
| +2.5 Volts monitor |  |
| +5 Volts monitor |  |
| _ROLL_ROT | 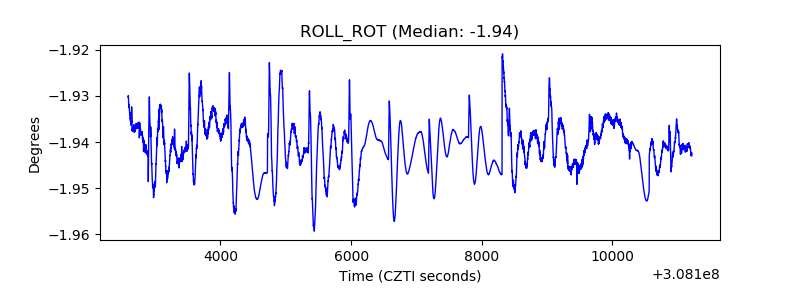 |
| _Roll_DEC | 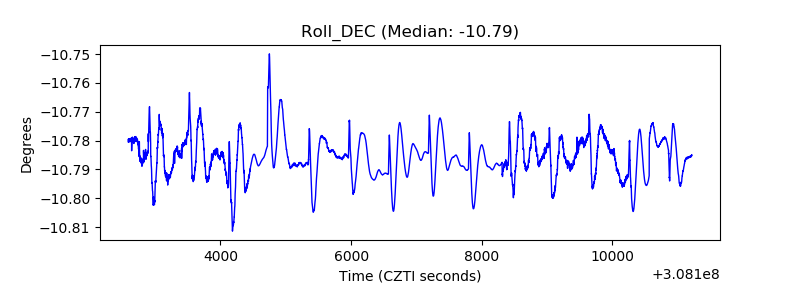 |
| _Roll_RA | 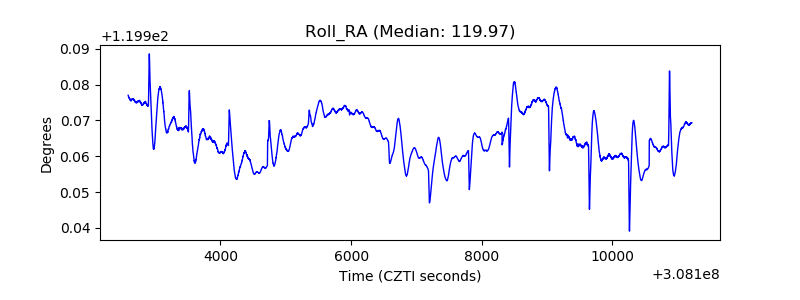 |
| Veto Counter | 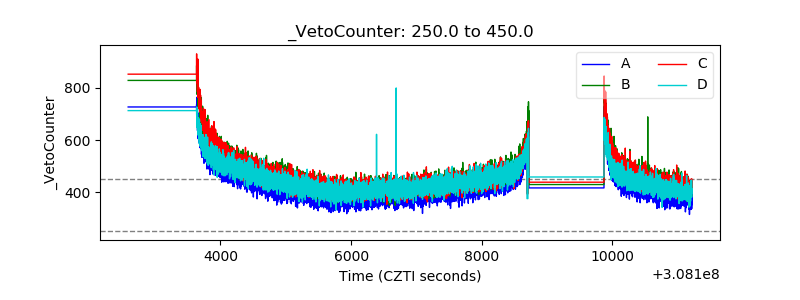 |