| Param | Original file | Final file |
|---|---|---|
| Filename | modeM0/AS1A07_005T01_9000003224_21764cztM0_level2.evt | modeM0/AS1A07_005T01_9000003224_21764cztM0_level2_quad_clean.evt |
| Size (bytes) | 2,859,272,640 | 282,070,080 |
| Size | 2.7 GB | 269.0 MB |
| Events in quadrant A | 11,957,989 | 1,856,271 |
| Events in quadrant B | 13,147,942 | 1,895,359 |
| Events in quadrant C | 11,821,793 | 1,808,269 |
| Events in quadrant D | 47,995,517 | 1,271,714 |
| Mode M9 | |||
|---|---|---|---|
| Quadrant | BADHDUFLAG | Total packets | Discarded packets |
| A | 0 | 29 | 0 |
| B | 0 | 29 | 0 |
| C | 0 | 29 | 0 |
| D | 0 | 29 | 0 |
| Mode M0 | |||
|---|---|---|---|
| Quadrant | BADHDUFLAG | Total packets | Discarded packets |
| A | 0 | 51245 | 5 |
| B | 0 | 54235 | 5 |
| C | 0 | 50828 | 5 |
| D | 0 | 159612 | 5 |
| Mode SS | |||
|---|---|---|---|
| Quadrant | BADHDUFLAG | Total packets | Discarded packets |
| A | 0 | 504 | 0 |
| B | 0 | 504 | 0 |
| C | 0 | 504 | 0 |
| D | 0 | 504 | 0 |
| Quadrant | Total seconds | Saturated seconds | Saturation percentage |
|---|---|---|---|
| A | 24835 | 370 | 1.489833% |
| B | 24835 | 523 | 2.105899% |
| C | 24835 | 433 | 1.743507% |
| D | 24834 | 14815 | 59.656117% |
Noise dominated data is calculated using 1-second bins in cleaned event files. If a bin has >2000 counts, and if more than 50% of those come from <1% of pixels, then it is considered to be noise-dominated and hence unusable.
| Quadrant | # 1 sec bins | Bins with >0 counts | Bins with >2000 counts | High rate bins dominated by noise | Noise dominated (total time) | Noise dominated (detector-on time) | Marked lightcurve |
|---|---|---|---|---|---|---|---|
| A | 27525 | 24839 | 2 | 2 | 0.01% | 0.01% |  |
| B | 27525 | 24840 | 95 | 95 | 0.35% | 0.38% | 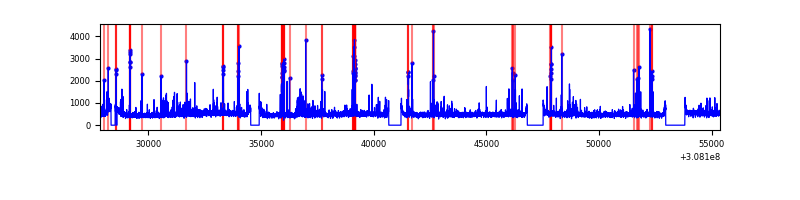 |
| C | 27525 | 24841 | 0 | 0 | 0.00% | 0.00% | 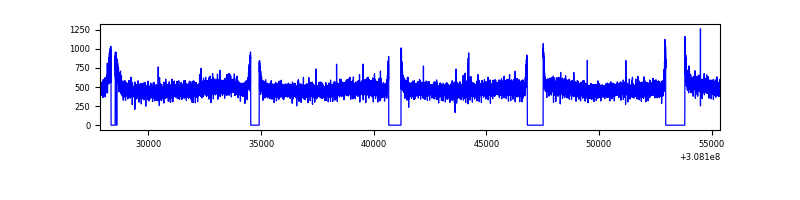 |
| D | 27524 | 24837 | 12484 | 12484 | 45.36% | 50.26% | 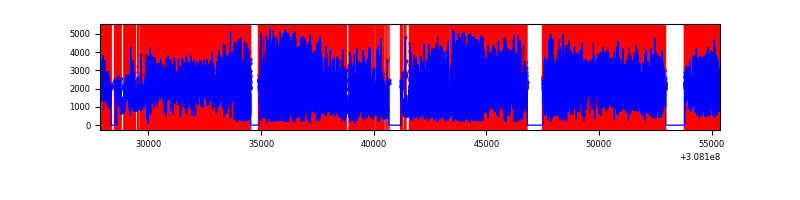 |
Top three noisy pixels from each quadrant. If the there are fewer than three noisy pixels in the level2.evt file, extra rows are filled as -1
| Pixel properties | Quadrant properties | ||||||
|---|---|---|---|---|---|---|---|
| Quadrant | DetID | PixID | Counts | Sigma | Mean | Median | Sigma |
| A | 14 | 235 | 87615 | 138.89 | 3030 | 2957 | 609.5 |
| A | 15 | 236 | 75825 | 119.55 | 3030 | 2957 | 609.5 |
| A | 12 | 96 | 55934 | 86.91 | 3030 | 2957 | 609.5 |
| B | 3 | 64 | 591061 | 1020.25 | 3028 | 2951 | 576.4 |
| B | 0 | 230 | 303819 | 521.94 | 3028 | 2951 | 576.4 |
| B | 0 | 190 | 135379 | 229.74 | 3028 | 2951 | 576.4 |
| C | 14 | 238 | 453366 | 660.89 | 2914 | 2930 | 681.6 |
| C | 13 | 61 | 20344 | 25.55 | 2914 | 2930 | 681.6 |
| C | 3 | 233 | 16220 | 19.5 | 2914 | 2930 | 681.6 |
| D | 7 | 238 | 32227601 | 59987.31 | 2211 | 2146 | 537.2 |
| D | 1 | 52 | 6149061 | 11442.41 | 2211 | 2146 | 537.2 |
| D | 2 | 136 | 363764 | 673.15 | 2211 | 2146 | 537.2 |
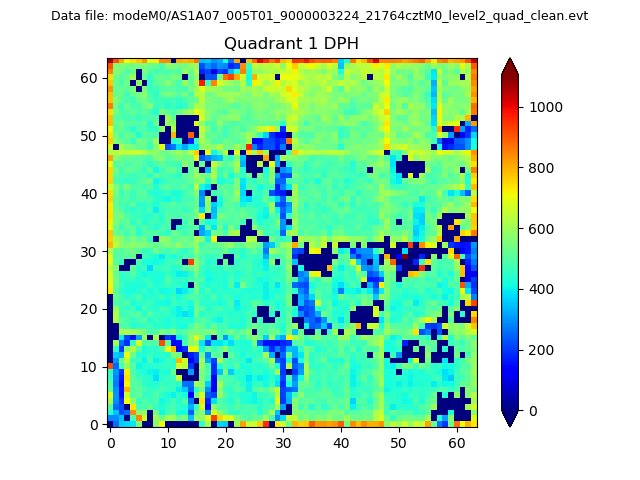
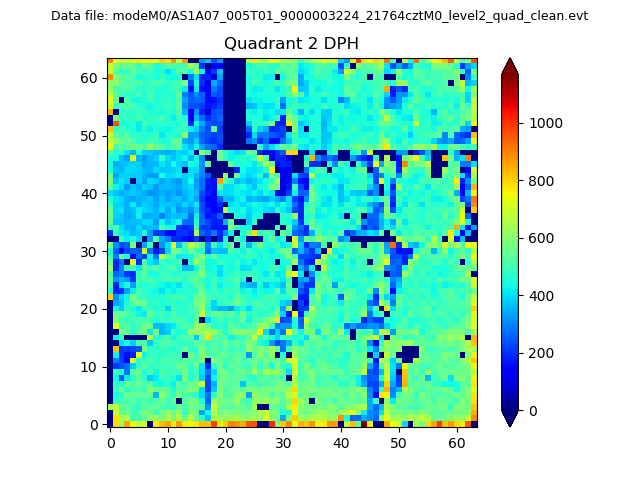
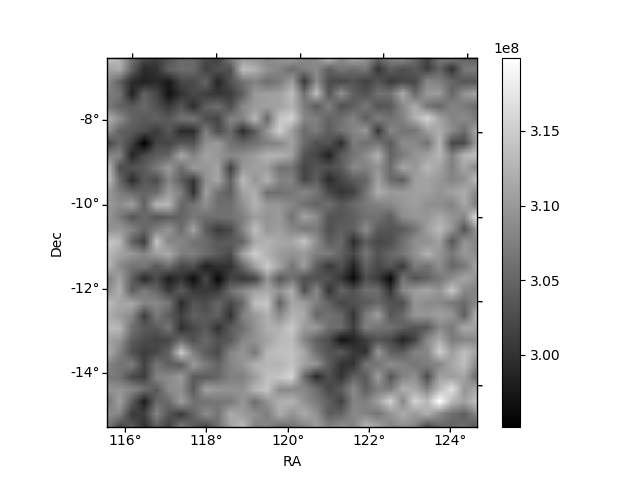
Histogram calculated using DETX and DETY for each event in the final _common_clean file
| Quadrant A | 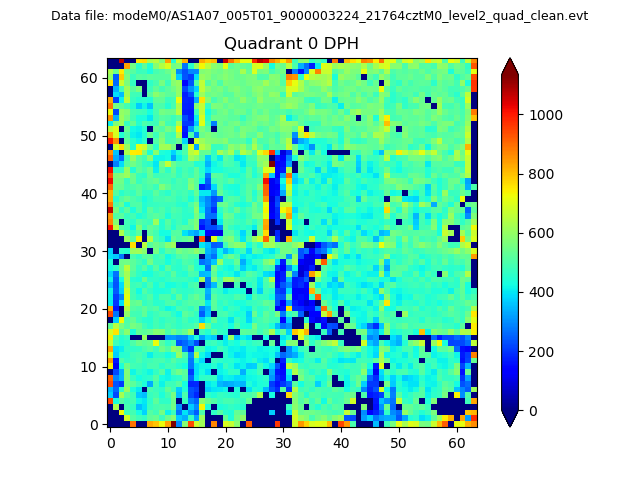 |
 |
Quadrant B |
|---|---|---|---|
| Quadrant D | 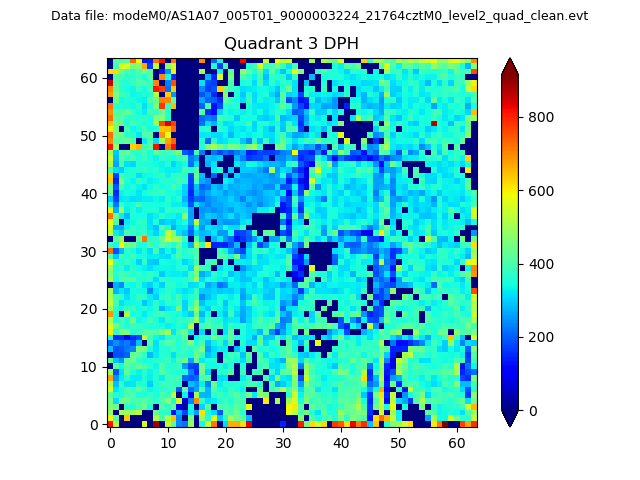 |
 |
Quadrant C |
| Plot type | Count rate plots | Images |
|---|---|---|
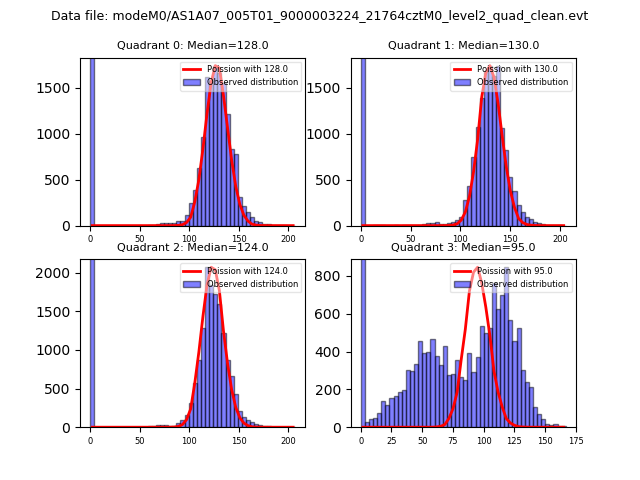
| Comparison with Poisson distribution Blue bars denote a histogram of data divided into 1 sec bins. Red curve is a Poisson curve with rate = median count rate of data. |
 |
 |
| Quadrant-wise count rates Data is divided into 100 sec bins |
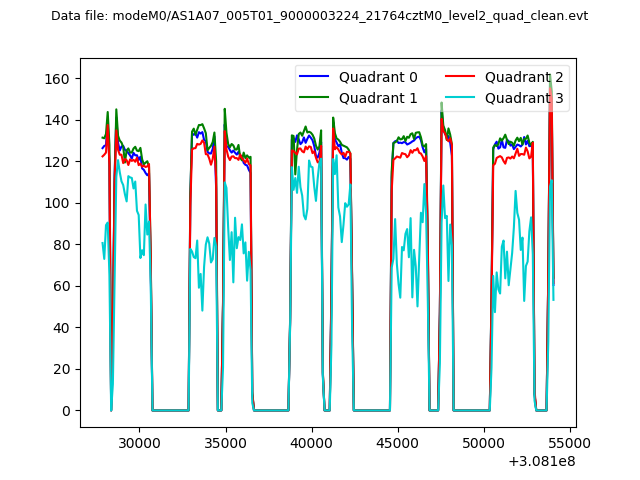 |
|
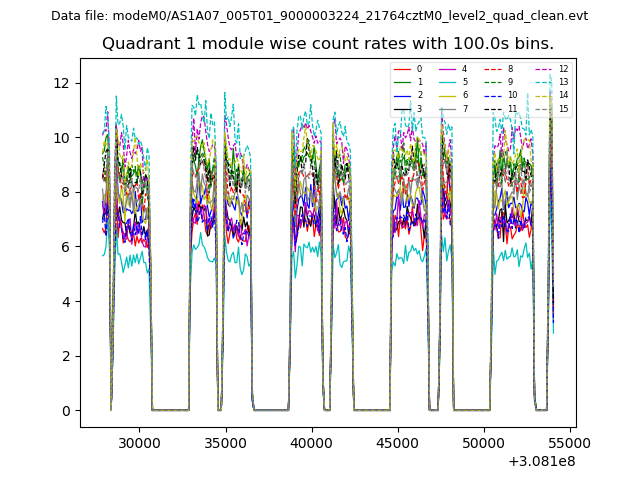
| Module-wise count rates for Quadrant A Data is divided into 100 sec bins |
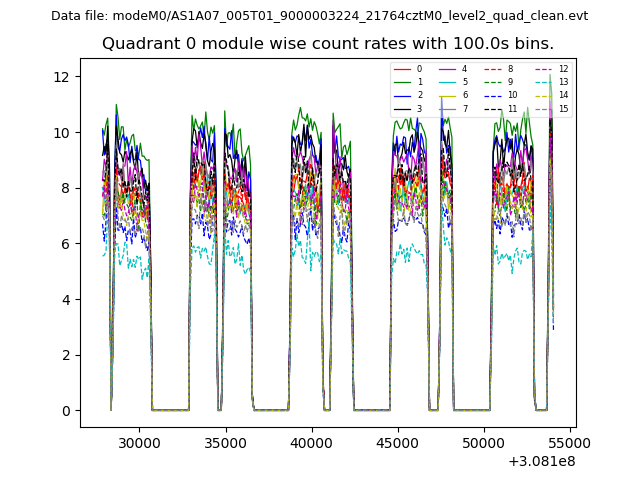 |
 |
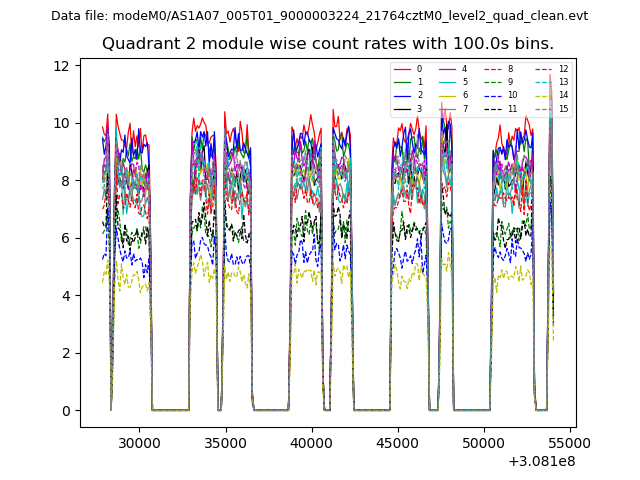
| Module-wise count rates for Quadrant B Data is divided into 100 sec bins |
 |
 |
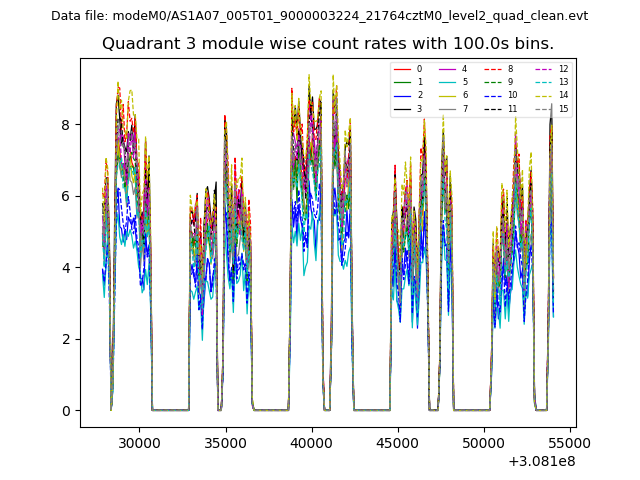
| Module-wise count rates for Quadrant C Data is divided into 100 sec bins |
 |
 |
| Module-wise count rates for Quadrant D Data is divided into 100 sec bins |
 |
 |
| Parameter | Plot |
|---|---|
| CZT HV Monitor | 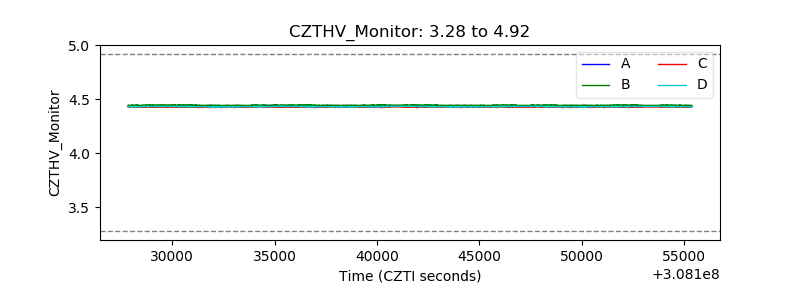 |
| D_VDD | 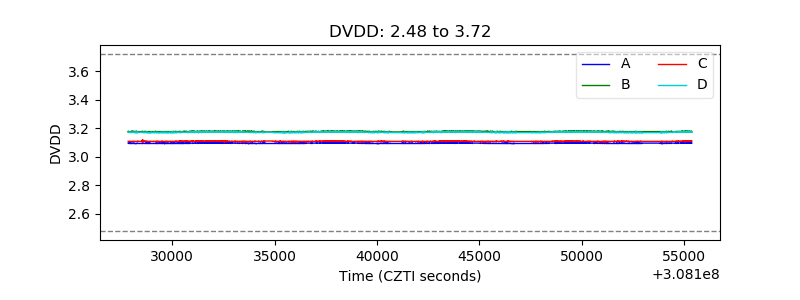 |
| Temperature 1 | 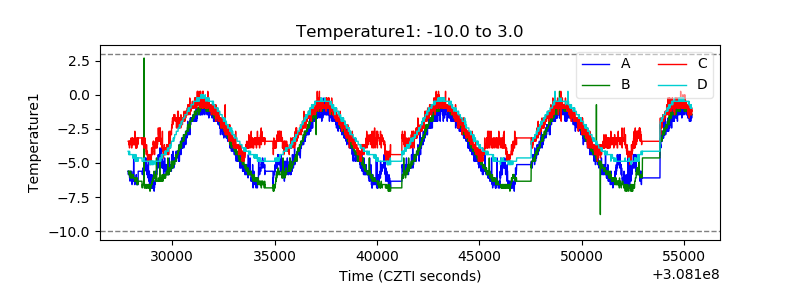 |
| Veto HV Monitor | 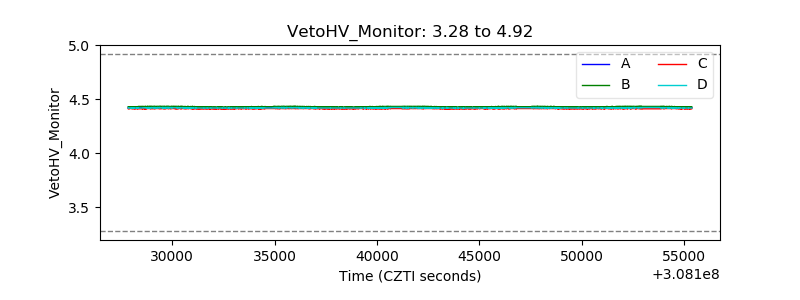 |
| Veto LLD | 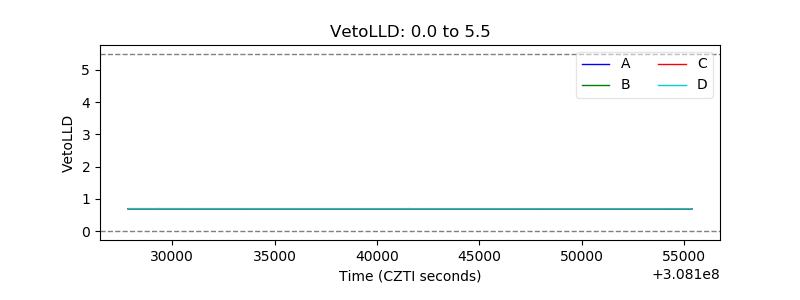 |
| Alpha Counter | 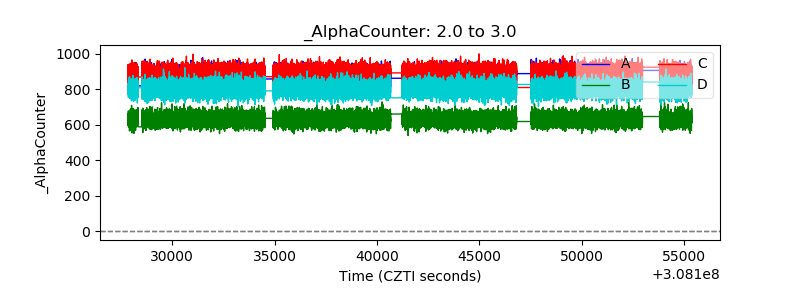 |
| _CPM_Rate | 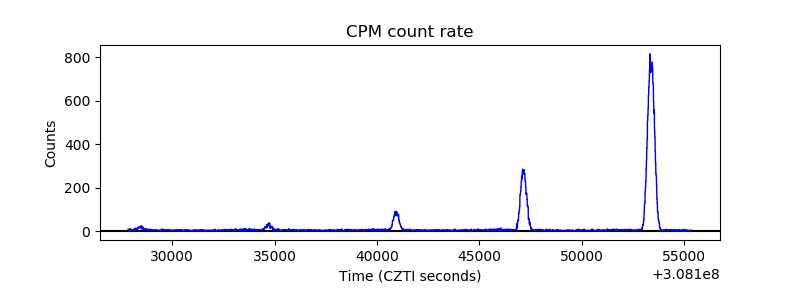 |
| CZT Counter | 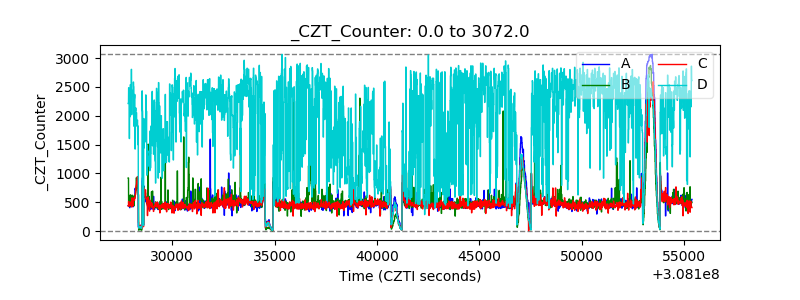 |
| +2.5 Volts monitor |  |
| +5 Volts monitor |  |
| _ROLL_ROT | 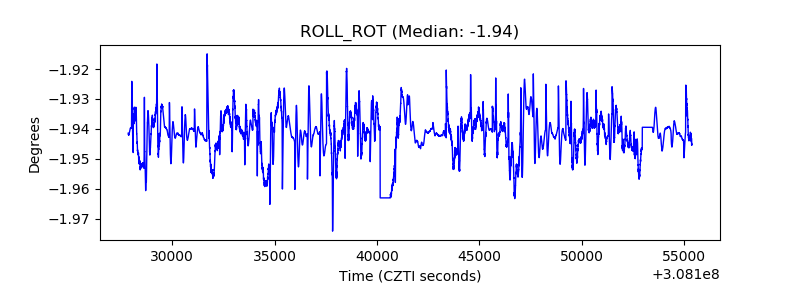 |
| _Roll_DEC | 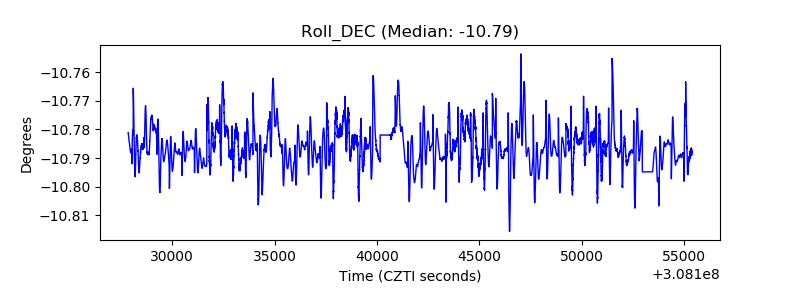 |
| _Roll_RA | 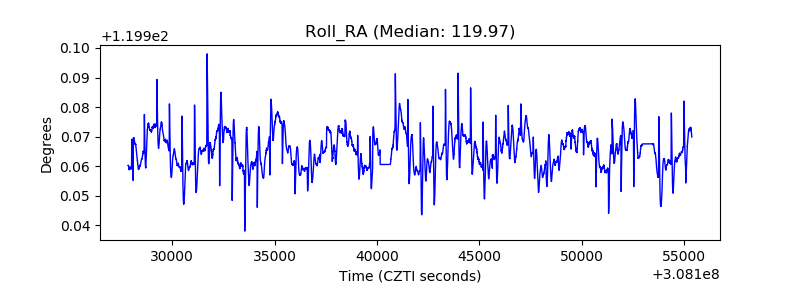 |
| Veto Counter | 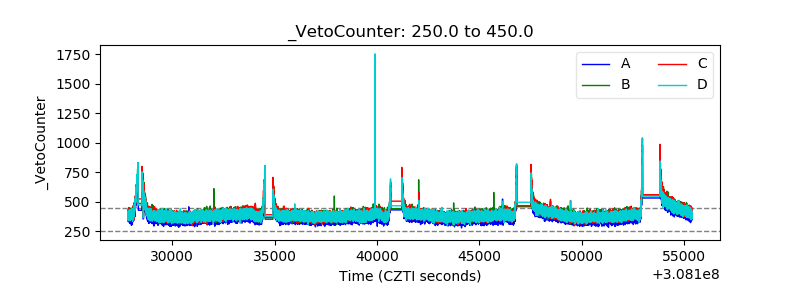 |