| Param | Original file | Final file |
|---|---|---|
| Filename | modeM0/AS1A07_005T01_9000003224_21770cztM0_level2.evt | modeM0/AS1A07_005T01_9000003224_21770cztM0_level2_quad_clean.evt |
| Size (bytes) | 752,241,600 | 91,846,080 |
| Size | 717.4 MB | 87.6 MB |
| Events in quadrant A | 3,247,570 | 641,828 |
| Events in quadrant B | 3,581,331 | 662,729 |
| Events in quadrant C | 3,264,803 | 621,178 |
| Events in quadrant D | 12,272,676 | 425,855 |
| Mode M9 | |||
|---|---|---|---|
| Quadrant | BADHDUFLAG | Total packets | Discarded packets |
| A | 0 | 15 | 0 |
| B | 0 | 16 | 0 |
| C | 0 | 16 | 0 |
| D | 0 | 16 | 0 |
| Mode M0 | |||
|---|---|---|---|
| Quadrant | BADHDUFLAG | Total packets | Discarded packets |
| A | 0 | 13525 | 2 |
| B | 0 | 14576 | 2 |
| C | 0 | 13473 | 2 |
| D | 0 | 40713 | 5 |
| Mode SS | |||
|---|---|---|---|
| Quadrant | BADHDUFLAG | Total packets | Discarded packets |
| A | 0 | 124 | 0 |
| B | 0 | 124 | 0 |
| C | 0 | 124 | 0 |
| D | 0 | 124 | 0 |
| Quadrant | Total seconds | Saturated seconds | Saturation percentage |
|---|---|---|---|
| A | 6144 | 74 | 1.204427% |
| B | 6144 | 131 | 2.132161% |
| C | 6144 | 121 | 1.969401% |
| D | 6143 | 3762 | 61.240436% |
Noise dominated data is calculated using 1-second bins in cleaned event files. If a bin has >2000 counts, and if more than 50% of those come from <1% of pixels, then it is considered to be noise-dominated and hence unusable.
| Quadrant | # 1 sec bins | Bins with >0 counts | Bins with >2000 counts | High rate bins dominated by noise | Noise dominated (total time) | Noise dominated (detector-on time) | Marked lightcurve |
|---|---|---|---|---|---|---|---|
| A | 7479 | 6145 | 0 | 0 | 0.00% | 0.00% | 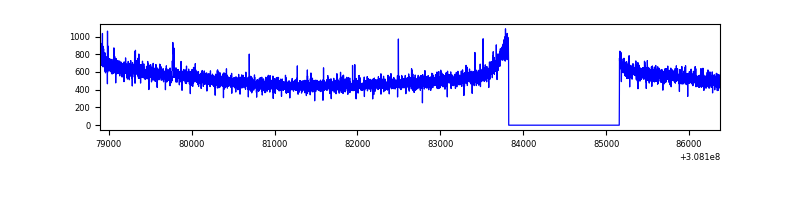 |
| B | 7479 | 6145 | 22 | 22 | 0.29% | 0.36% | 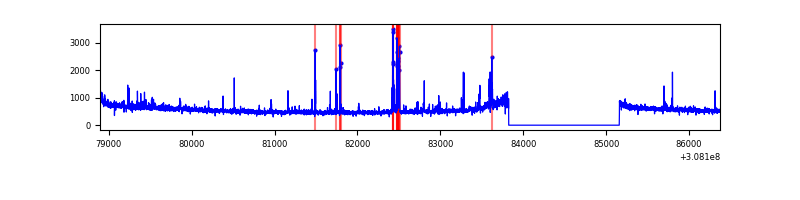 |
| C | 7479 | 6145 | 0 | 0 | 0.00% | 0.00% | 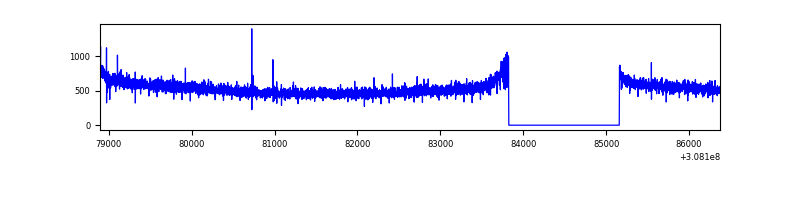 |
| D | 7478 | 6143 | 3203 | 3203 | 42.83% | 52.14% | 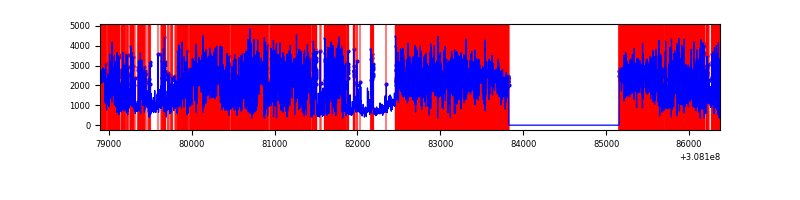 |
Top three noisy pixels from each quadrant. If the there are fewer than three noisy pixels in the level2.evt file, extra rows are filled as -1
| Pixel properties | Quadrant properties | ||||||
|---|---|---|---|---|---|---|---|
| Quadrant | DetID | PixID | Counts | Sigma | Mean | Median | Sigma |
| A | 13 | 254 | 11792 | 65.47 | 836 | 822 | 167.5 |
| A | 15 | 236 | 10214 | 56.06 | 836 | 822 | 167.5 |
| A | 0 | 226 | 7287 | 38.59 | 836 | 822 | 167.5 |
| B | 3 | 64 | 143136 | 902.2 | 844 | 824 | 157.7 |
| B | 15 | 35 | 36138 | 223.88 | 844 | 824 | 157.7 |
| B | 0 | 197 | 31979 | 197.51 | 844 | 824 | 157.7 |
| C | 14 | 238 | 127743 | 676.88 | 804 | 814 | 187.5 |
| C | 13 | 61 | 5613 | 25.59 | 804 | 814 | 187.5 |
| C | 3 | 202 | 1922 | 5.91 | 804 | 814 | 187.5 |
| D | 7 | 238 | 9549118 | 66550.38 | 588 | 573 | 143.5 |
| D | 2 | 136 | 220587 | 1533.43 | 588 | 573 | 143.5 |
| D | 2 | 16 | 81290 | 562.57 | 588 | 573 | 143.5 |
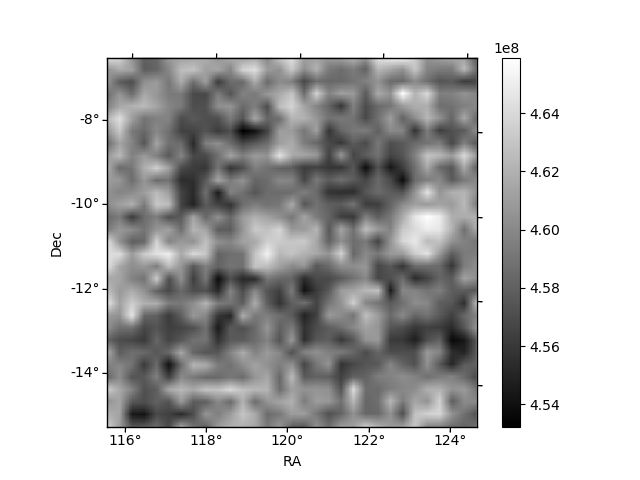
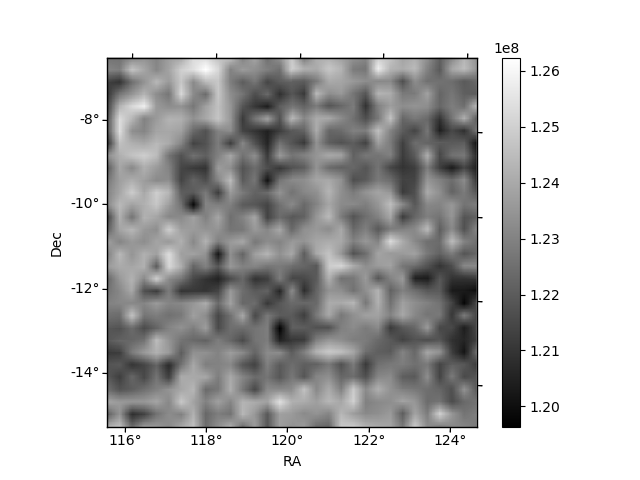
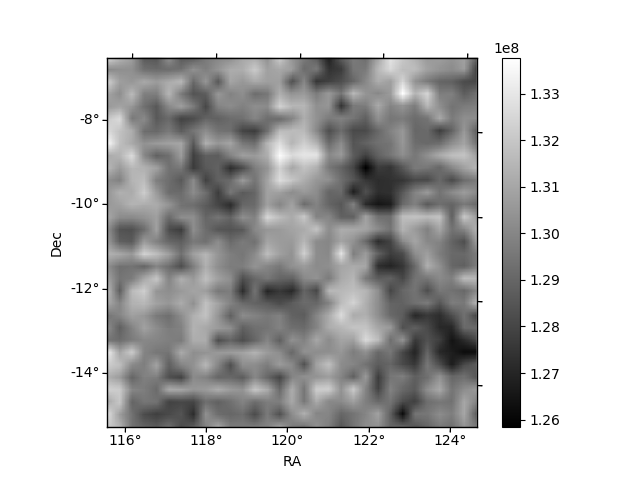
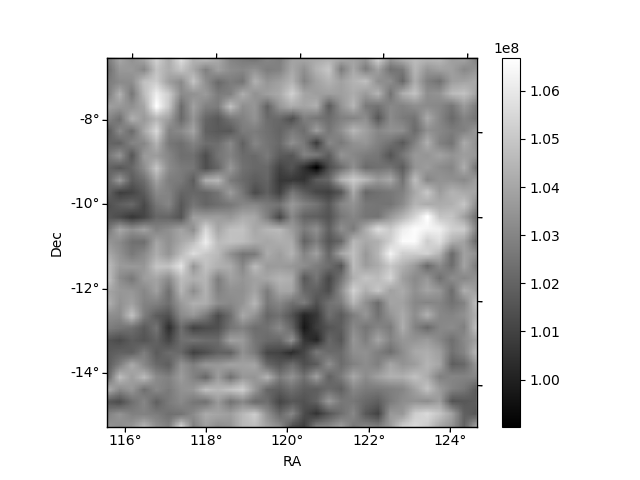
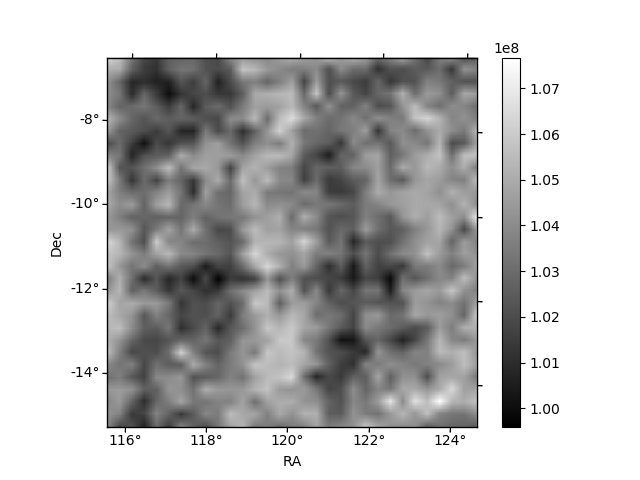
Histogram calculated using DETX and DETY for each event in the final _common_clean file
| Quadrant A | 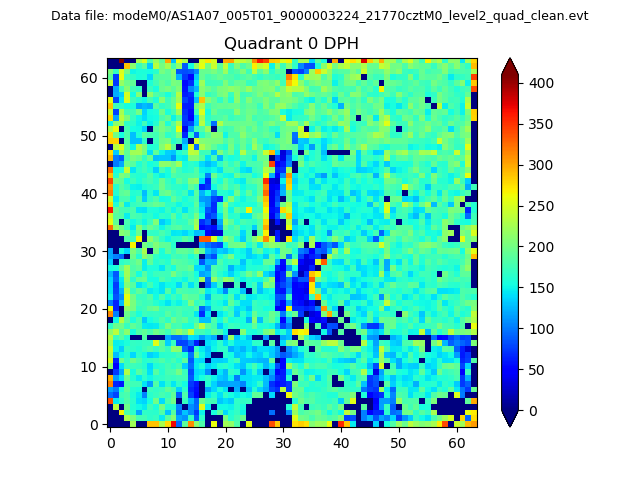 |
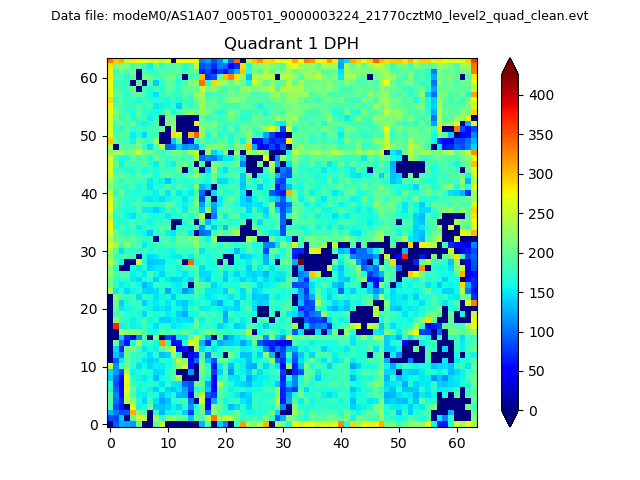 |
Quadrant B |
|---|---|---|---|
| Quadrant D | 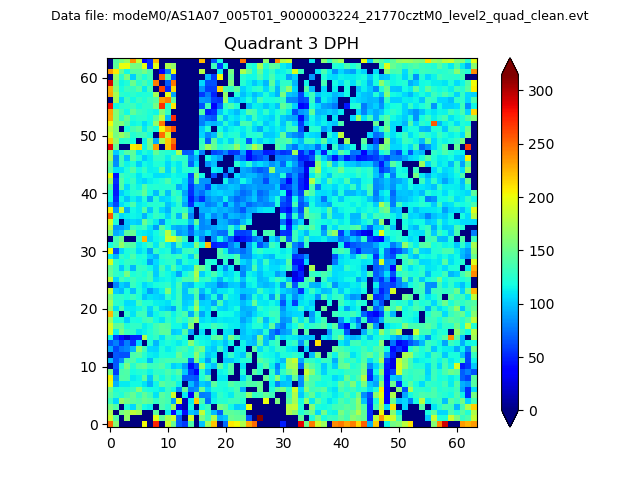 |
 |
Quadrant C |
| Plot type | Count rate plots | Images |
|---|---|---|
| Comparison with Poisson distribution Blue bars denote a histogram of data divided into 1 sec bins. Red curve is a Poisson curve with rate = median count rate of data. |
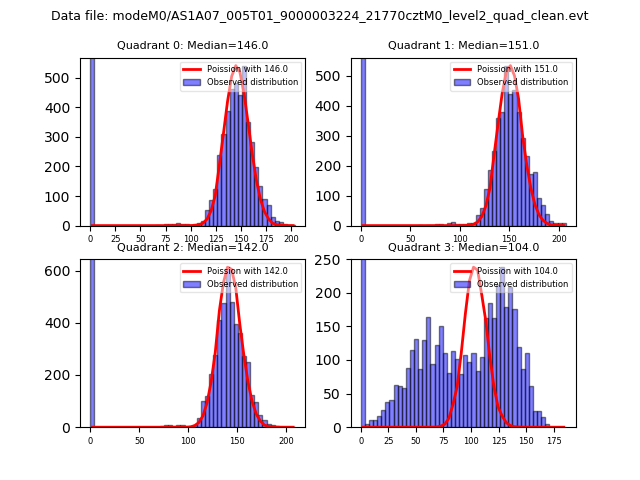 |
 |
| Quadrant-wise count rates Data is divided into 100 sec bins |
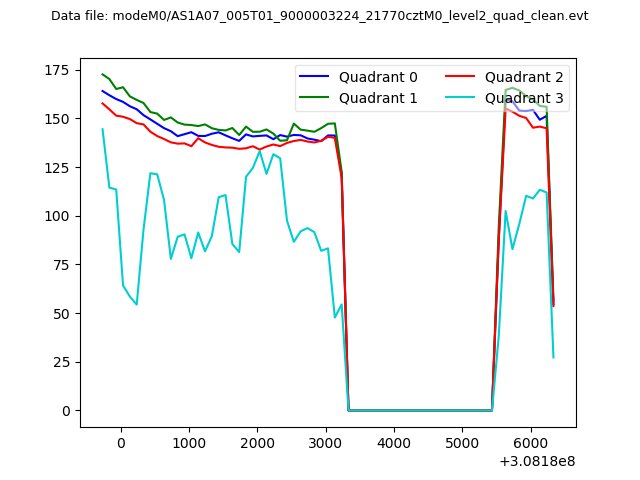 |
|
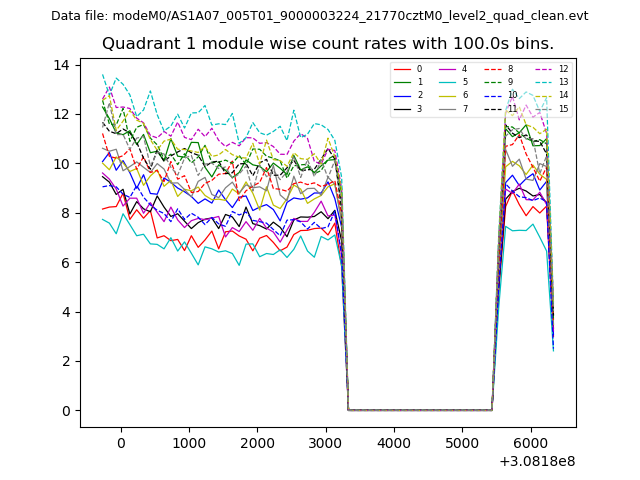
| Module-wise count rates for Quadrant A Data is divided into 100 sec bins |
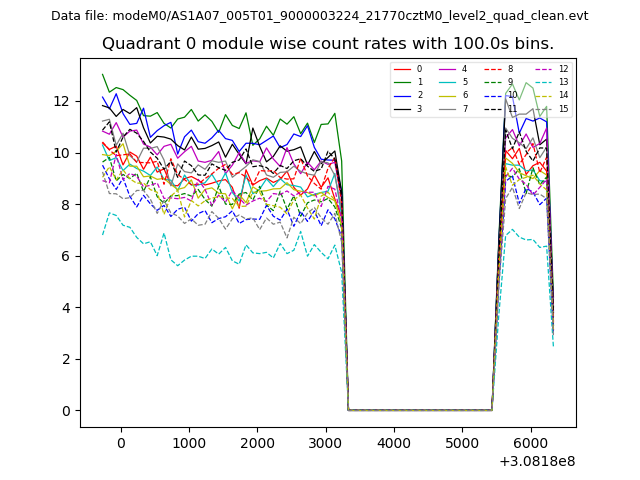 |
 |
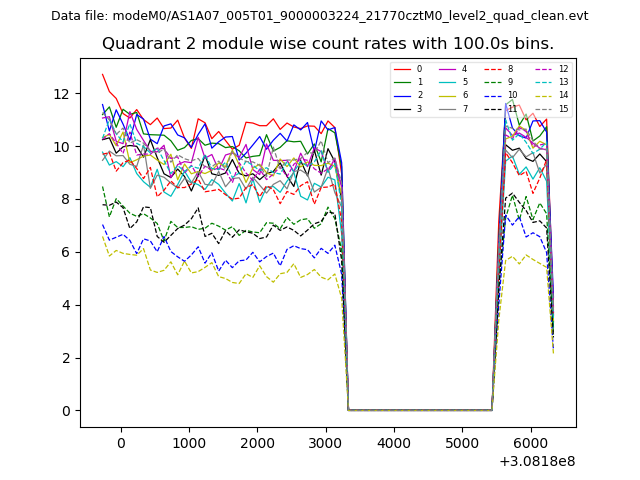
| Module-wise count rates for Quadrant B Data is divided into 100 sec bins |
 |
 |
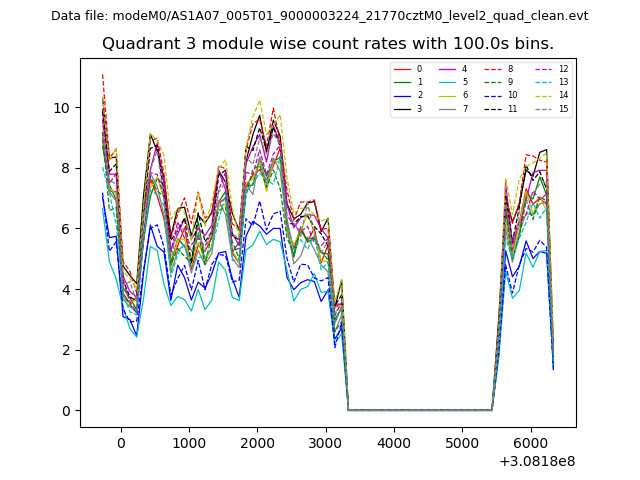
| Module-wise count rates for Quadrant C Data is divided into 100 sec bins |
 |
 |
| Module-wise count rates for Quadrant D Data is divided into 100 sec bins |
 |
 |
| Parameter | Plot |
|---|---|
| CZT HV Monitor | 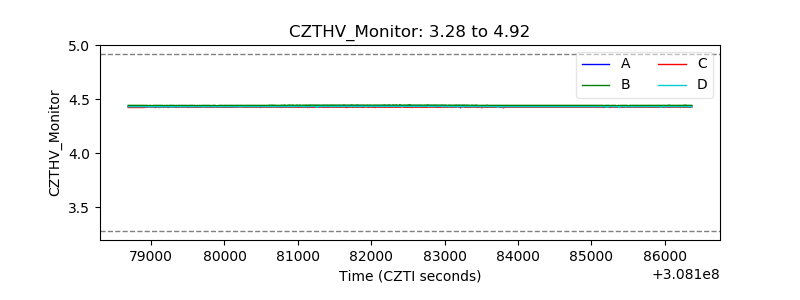 |
| D_VDD | 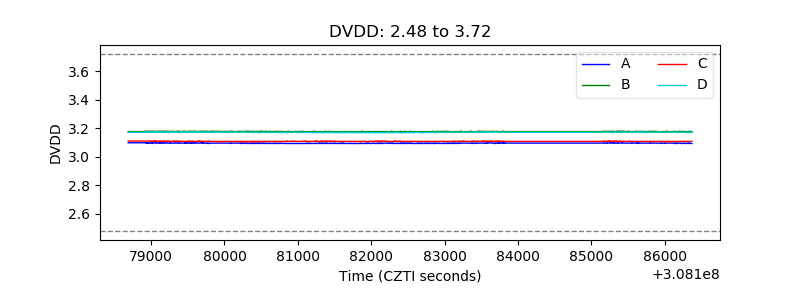 |
| Temperature 1 | 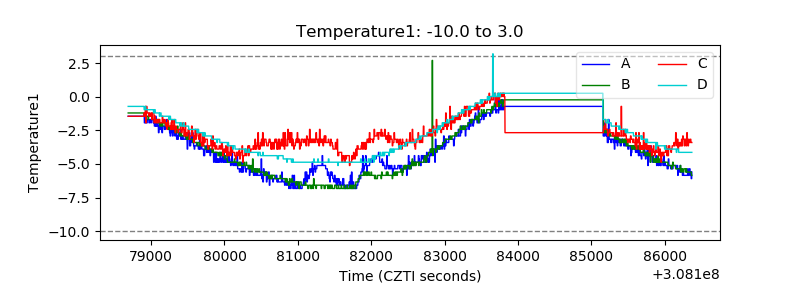 |
| Veto HV Monitor | 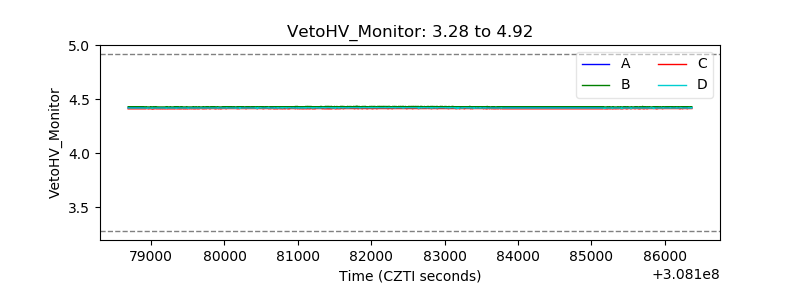 |
| Veto LLD | 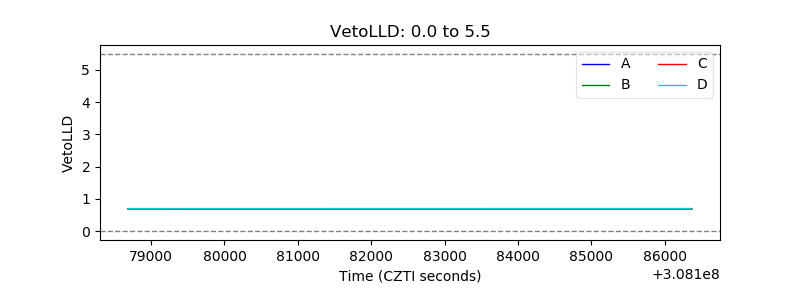 |
| Alpha Counter | 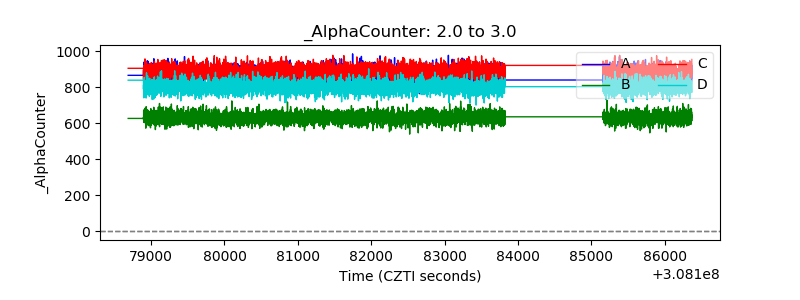 |
| _CPM_Rate | 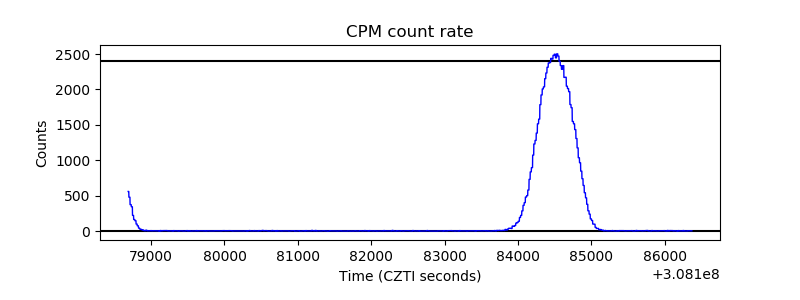 |
| CZT Counter |  |
| +2.5 Volts monitor |  |
| +5 Volts monitor |  |
| _ROLL_ROT | 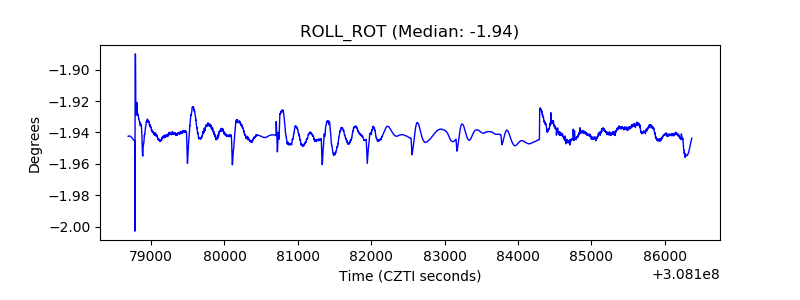 |
| _Roll_DEC | 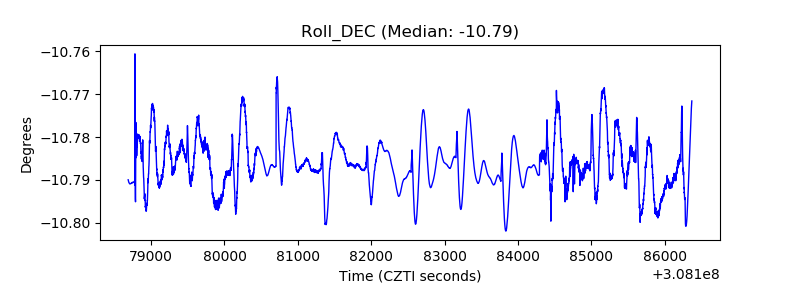 |
| _Roll_RA |  |
| Veto Counter | 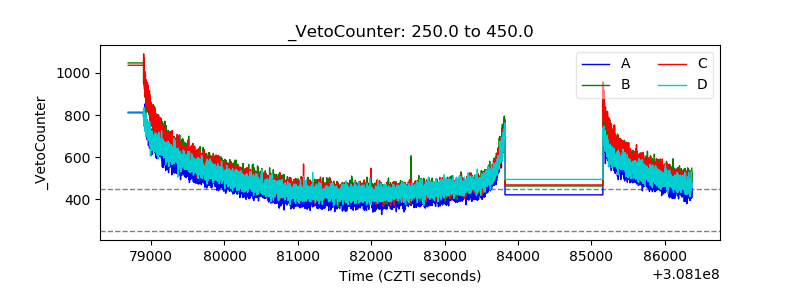 |