| Param | Original file | Final file |
|---|---|---|
| Filename | modeM0/AS1A07_005T01_9000003224_21771cztM0_level2.evt | modeM0/AS1A07_005T01_9000003224_21771cztM0_level2_quad_clean.evt |
| Size (bytes) | 768,153,600 | 98,118,720 |
| Size | 732.6 MB | 93.6 MB |
| Events in quadrant A | 3,206,742 | 690,348 |
| Events in quadrant B | 3,528,108 | 713,128 |
| Events in quadrant C | 3,208,412 | 671,911 |
| Events in quadrant D | 12,893,183 | 454,000 |
| Mode M9 | |||
|---|---|---|---|
| Quadrant | BADHDUFLAG | Total packets | Discarded packets |
| A | 0 | 19 | 0 |
| B | 0 | 20 | 0 |
| C | 0 | 20 | 0 |
| D | 0 | 20 | 0 |
| Mode M0 | |||
|---|---|---|---|
| Quadrant | BADHDUFLAG | Total packets | Discarded packets |
| A | 0 | 13502 | 3 |
| B | 0 | 14411 | 2 |
| C | 0 | 13406 | 2 |
| D | 0 | 42652 | 2 |
| Mode SS | |||
|---|---|---|---|
| Quadrant | BADHDUFLAG | Total packets | Discarded packets |
| A | 0 | 130 | 0 |
| B | 0 | 130 | 0 |
| C | 0 | 130 | 0 |
| D | 0 | 130 | 0 |
| Quadrant | Total seconds | Saturated seconds | Saturation percentage |
|---|---|---|---|
| A | 6309 | 39 | 0.618165% |
| B | 6309 | 96 | 1.521636% |
| C | 6309 | 89 | 1.410683% |
| D | 6309 | 4030 | 63.877001% |
Noise dominated data is calculated using 1-second bins in cleaned event files. If a bin has >2000 counts, and if more than 50% of those come from <1% of pixels, then it is considered to be noise-dominated and hence unusable.
| Quadrant | # 1 sec bins | Bins with >0 counts | Bins with >2000 counts | High rate bins dominated by noise | Noise dominated (total time) | Noise dominated (detector-on time) | Marked lightcurve |
|---|---|---|---|---|---|---|---|
| A | 7564 | 6310 | 10 | 10 | 0.13% | 0.16% | 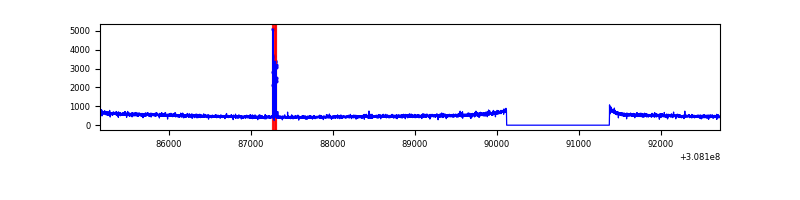 |
| B | 7564 | 6310 | 33 | 33 | 0.44% | 0.52% | 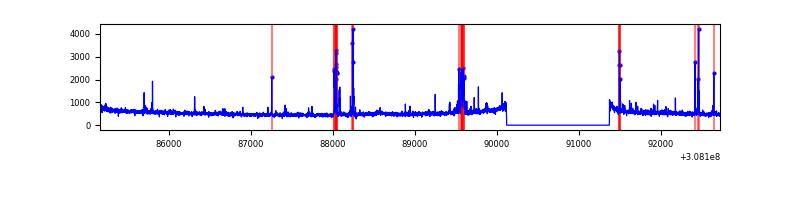 |
| C | 7564 | 6310 | 0 | 0 | 0.00% | 0.00% | 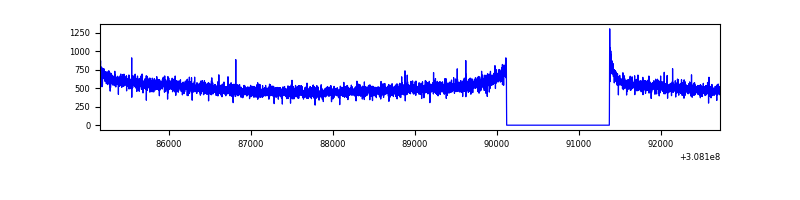 |
| D | 7564 | 6310 | 3411 | 3411 | 45.10% | 54.06% | 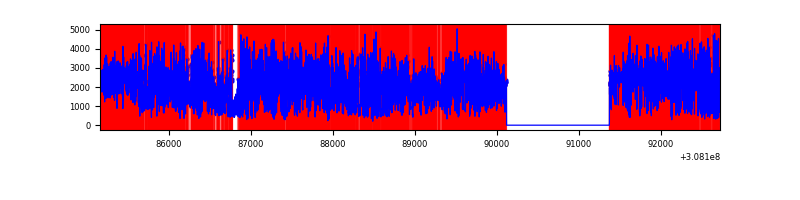 |
Top three noisy pixels from each quadrant. If the there are fewer than three noisy pixels in the level2.evt file, extra rows are filled as -1
| Pixel properties | Quadrant properties | ||||||
|---|---|---|---|---|---|---|---|
| Quadrant | DetID | PixID | Counts | Sigma | Mean | Median | Sigma |
| A | 12 | 96 | 46080 | 278.28 | 815 | 802 | 162.7 |
| A | 13 | 254 | 11856 | 67.94 | 815 | 802 | 162.7 |
| A | 13 | 252 | 9858 | 55.66 | 815 | 802 | 162.7 |
| B | 3 | 64 | 143075 | 915.16 | 828 | 811 | 155.5 |
| B | 0 | 197 | 68082 | 432.74 | 828 | 811 | 155.5 |
| B | 0 | 190 | 24111 | 149.89 | 828 | 811 | 155.5 |
| C | 14 | 238 | 124985 | 672.65 | 790 | 799 | 184.6 |
| C | 13 | 61 | 5445 | 25.17 | 790 | 799 | 184.6 |
| C | 0 | 10 | 3555 | 14.93 | 790 | 799 | 184.6 |
| D | 7 | 238 | 10245722 | 73269.83 | 577 | 561 | 139.8 |
| D | 2 | 136 | 107070 | 761.71 | 577 | 561 | 139.8 |
| D | 2 | 16 | 84700 | 601.73 | 577 | 561 | 139.8 |
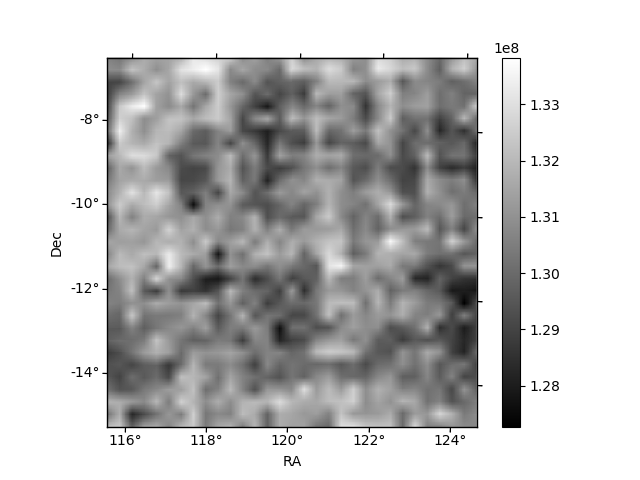
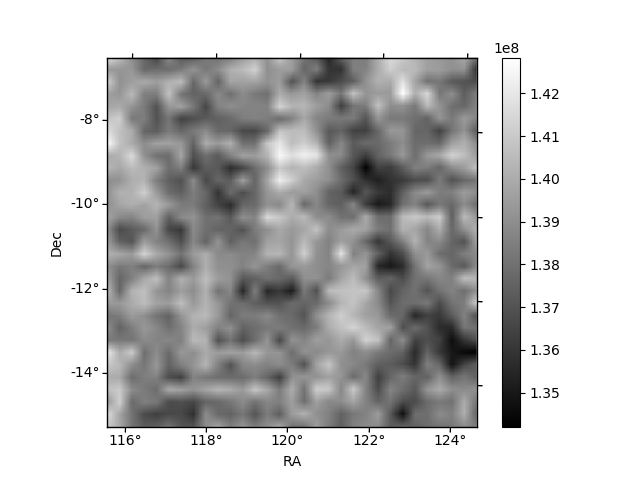
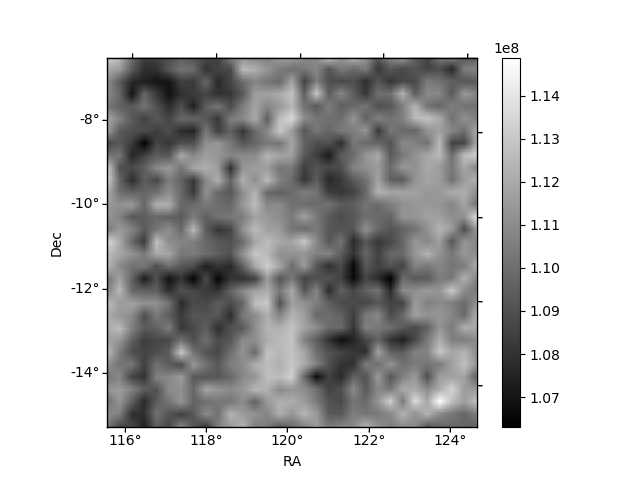
Histogram calculated using DETX and DETY for each event in the final _common_clean file
| Quadrant A | 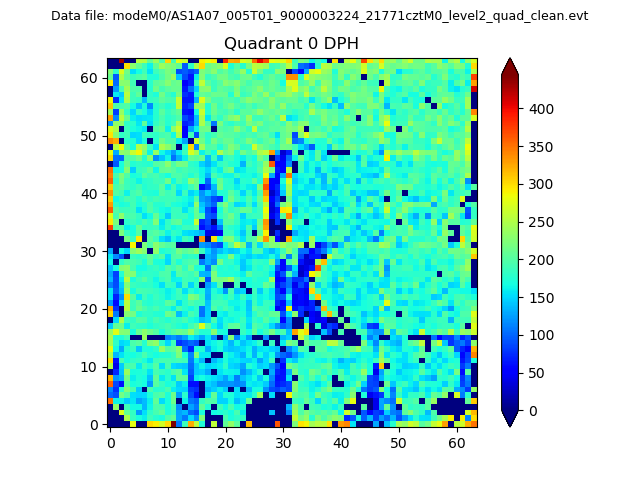 |
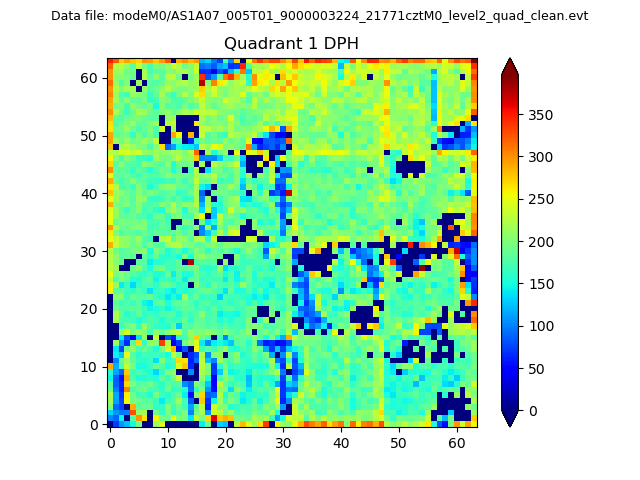 |
Quadrant B |
|---|---|---|---|
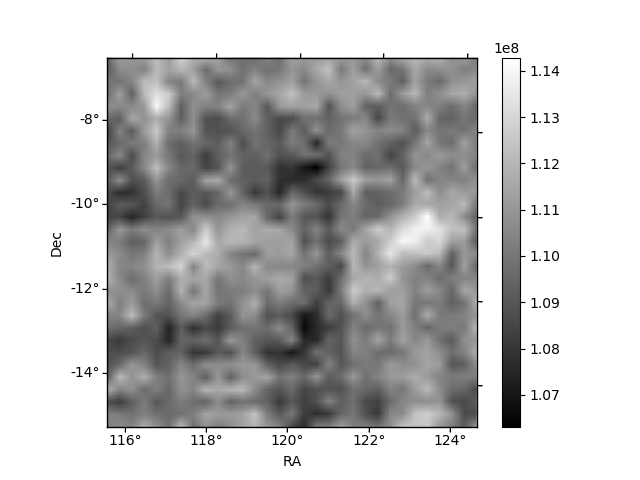
| Quadrant D | 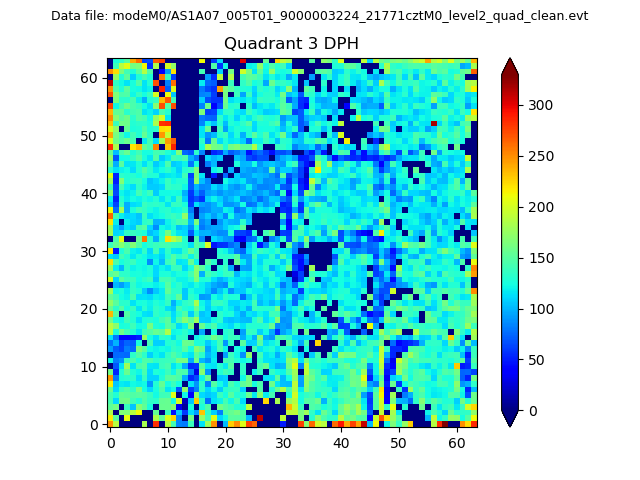 |
 |
Quadrant C |
| Plot type | Count rate plots | Images |
|---|---|---|
| Comparison with Poisson distribution Blue bars denote a histogram of data divided into 1 sec bins. Red curve is a Poisson curve with rate = median count rate of data. |
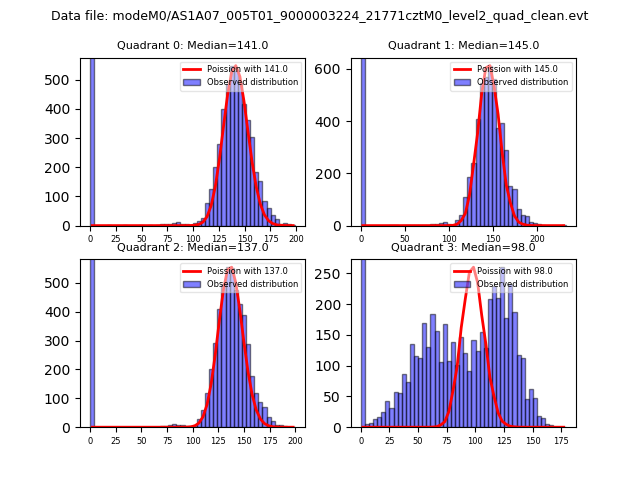 |
 |
| Quadrant-wise count rates Data is divided into 100 sec bins |
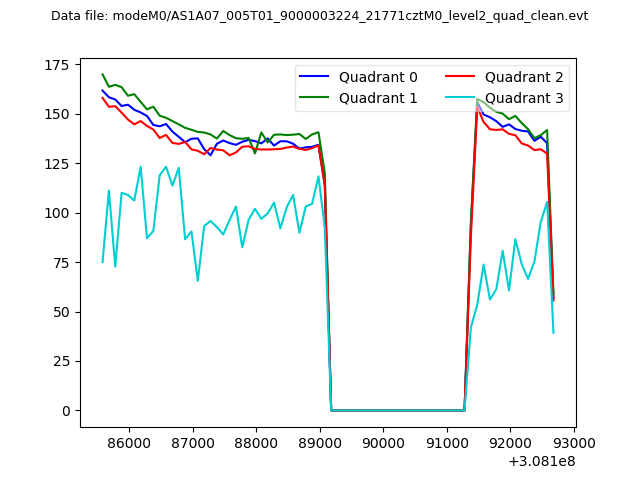 |
|
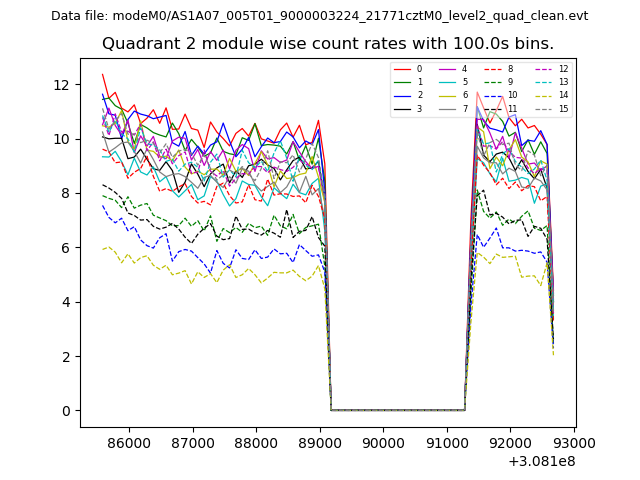
| Module-wise count rates for Quadrant A Data is divided into 100 sec bins |
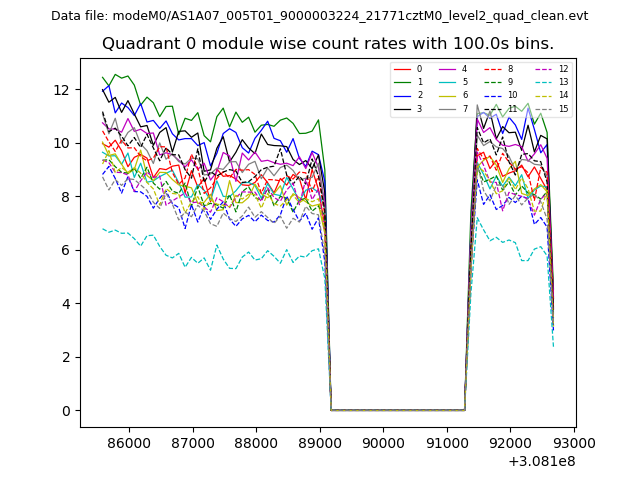 |
 |
| Module-wise count rates for Quadrant B Data is divided into 100 sec bins |
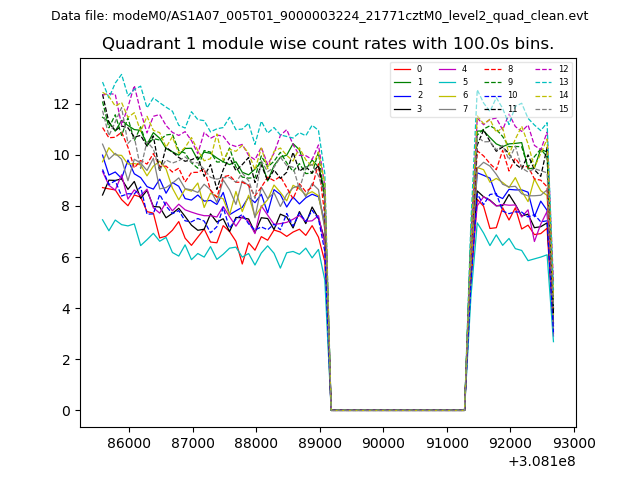 |
 |
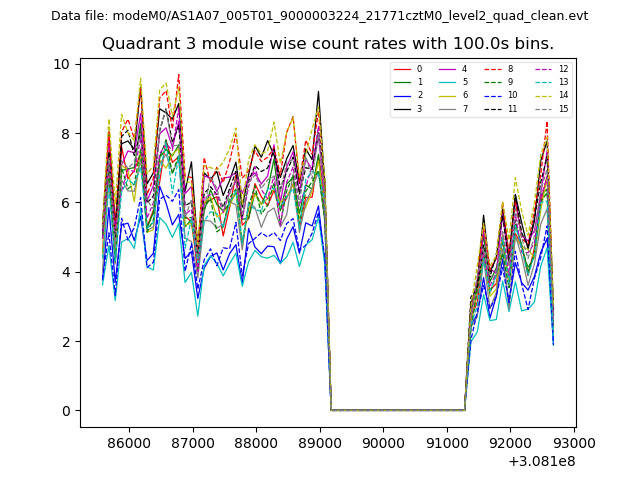
| Module-wise count rates for Quadrant C Data is divided into 100 sec bins |
 |
 |
| Module-wise count rates for Quadrant D Data is divided into 100 sec bins |
 |
 |
| Parameter | Plot |
|---|---|
| CZT HV Monitor | 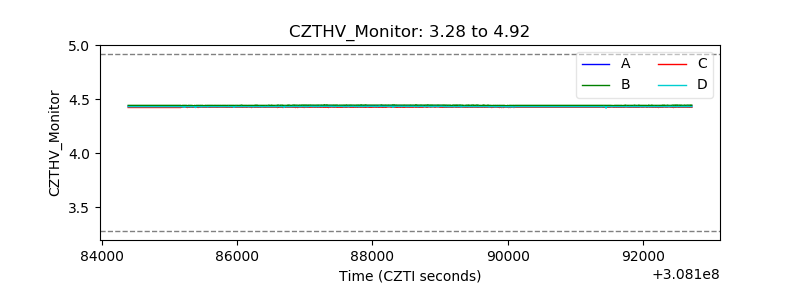 |
| D_VDD | 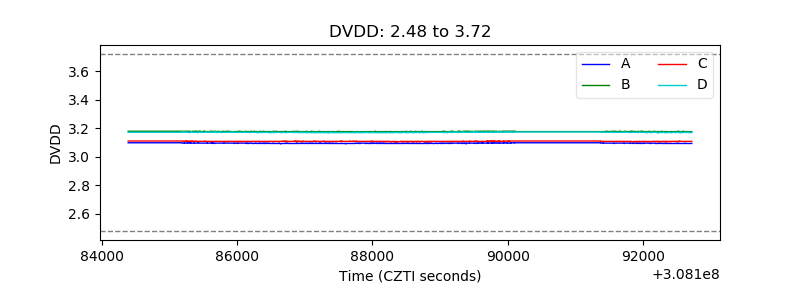 |
| Temperature 1 | 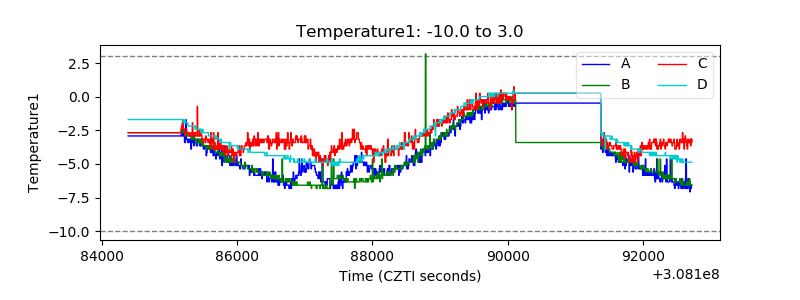 |
| Veto HV Monitor | 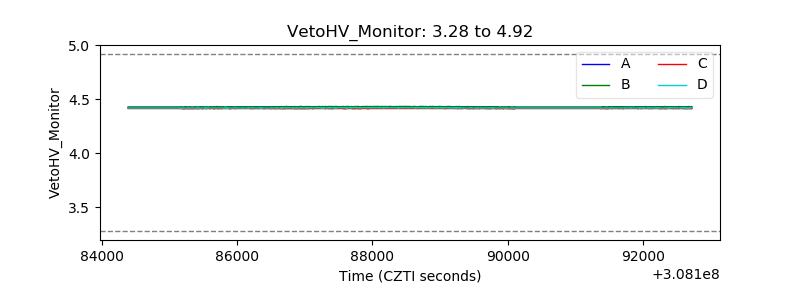 |
| Veto LLD | 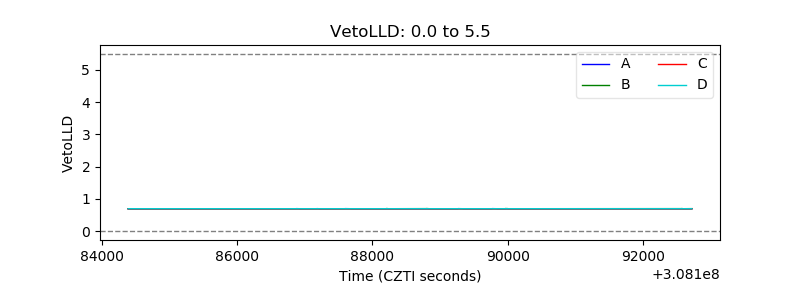 |
| Alpha Counter | 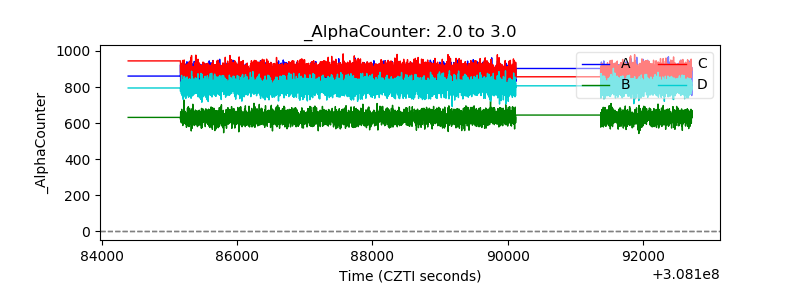 |
| _CPM_Rate | 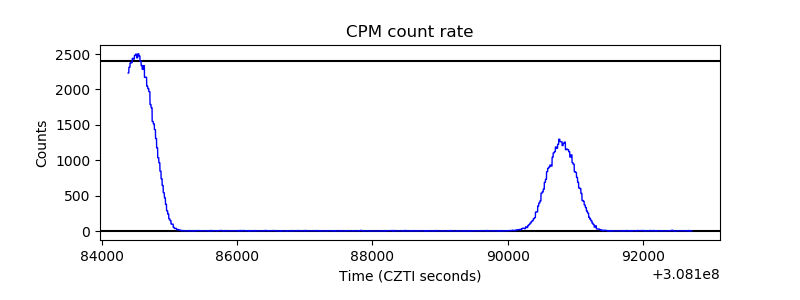 |
| CZT Counter |  |
| +2.5 Volts monitor |  |
| +5 Volts monitor |  |
| _ROLL_ROT | 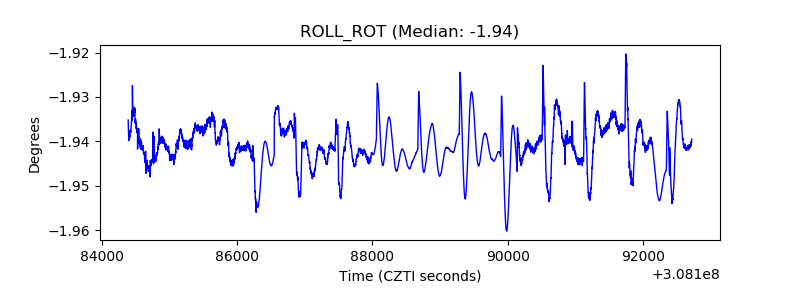 |
| _Roll_DEC | 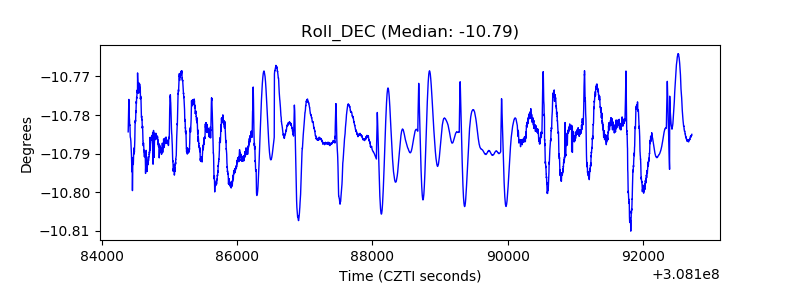 |
| _Roll_RA | 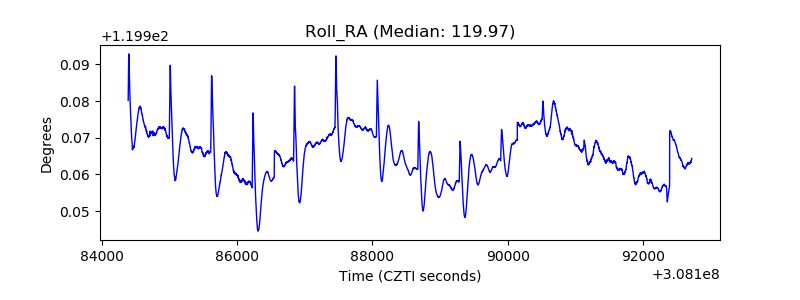 |
| Veto Counter | 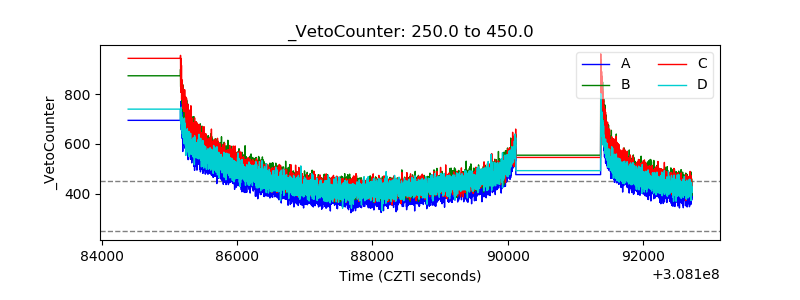 |