| Param | Original file | Final file |
|---|---|---|
| Filename | modeM0/AS1A07_005T01_9000003224_21773cztM0_level2.evt | modeM0/AS1A07_005T01_9000003224_21773cztM0_level2_quad_clean.evt |
| Size (bytes) | 891,806,400 | 79,842,240 |
| Size | 850.5 MB | 76.1 MB |
| Events in quadrant A | 3,172,230 | 571,324 |
| Events in quadrant B | 3,691,527 | 584,730 |
| Events in quadrant C | 3,217,131 | 555,168 |
| Events in quadrant D | 16,472,654 | 235,711 |
| Mode M9 | |||
|---|---|---|---|
| Quadrant | BADHDUFLAG | Total packets | Discarded packets |
| A | 0 | 6 | 0 |
| B | 0 | 6 | 0 |
| C | 0 | 6 | 0 |
| D | 0 | 6 | 0 |
| Mode M0 | |||
|---|---|---|---|
| Quadrant | BADHDUFLAG | Total packets | Discarded packets |
| A | 0 | 13870 | 2 |
| B | 0 | 15374 | 1 |
| C | 0 | 13836 | 1 |
| D | 0 | 53527 | 1 |
| Mode SS | |||
|---|---|---|---|
| Quadrant | BADHDUFLAG | Total packets | Discarded packets |
| A | 0 | 136 | 0 |
| B | 0 | 136 | 0 |
| C | 0 | 136 | 0 |
| D | 0 | 136 | 0 |
| Quadrant | Total seconds | Saturated seconds | Saturation percentage |
|---|---|---|---|
| A | 6727 | 38 | 0.564888% |
| B | 6728 | 131 | 1.947087% |
| C | 6728 | 85 | 1.263377% |
| D | 6728 | 5869 | 87.232461% |
Noise dominated data is calculated using 1-second bins in cleaned event files. If a bin has >2000 counts, and if more than 50% of those come from <1% of pixels, then it is considered to be noise-dominated and hence unusable.
| Quadrant | # 1 sec bins | Bins with >0 counts | Bins with >2000 counts | High rate bins dominated by noise | Noise dominated (total time) | Noise dominated (detector-on time) | Marked lightcurve |
|---|---|---|---|---|---|---|---|
| A | 7317 | 6728 | 0 | 0 | 0.00% | 0.00% | 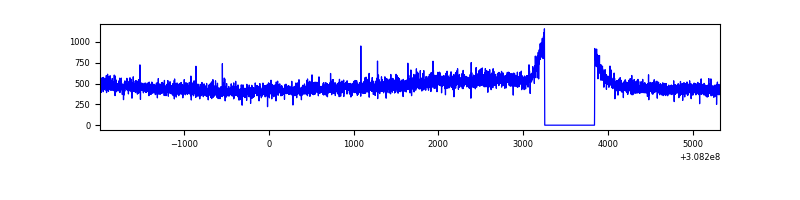 |
| B | 7318 | 6729 | 75 | 75 | 1.02% | 1.11% | 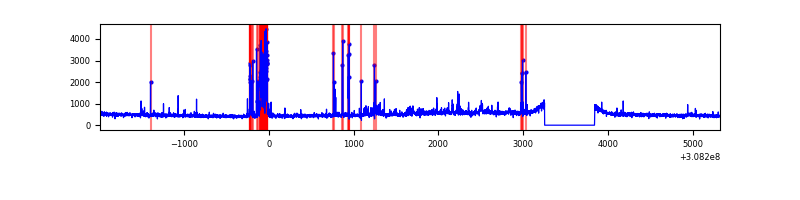 |
| C | 7318 | 6729 | 0 | 0 | 0.00% | 0.00% | 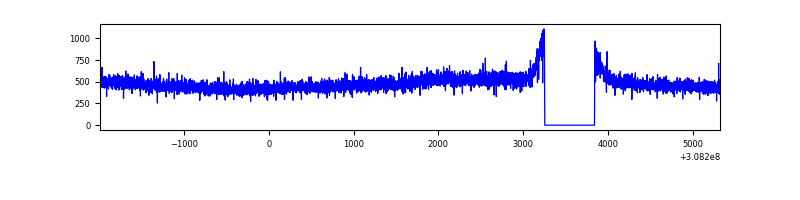 |
| D | 7318 | 6728 | 5336 | 5336 | 72.92% | 79.31% | 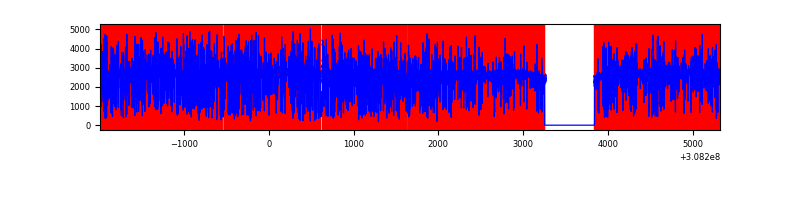 |
Top three noisy pixels from each quadrant. If the there are fewer than three noisy pixels in the level2.evt file, extra rows are filled as -1
| Pixel properties | Quadrant properties | ||||||
|---|---|---|---|---|---|---|---|
| Quadrant | DetID | PixID | Counts | Sigma | Mean | Median | Sigma |
| A | 15 | 236 | 13515 | 77.1 | 818 | 802 | 164.9 |
| A | 13 | 254 | 12332 | 69.93 | 818 | 802 | 164.9 |
| A | 0 | 226 | 7140 | 38.44 | 818 | 802 | 164.9 |
| B | 3 | 64 | 313159 | 1961.19 | 824 | 804 | 159.3 |
| B | 0 | 197 | 46435 | 286.51 | 824 | 804 | 159.3 |
| B | 0 | 230 | 38714 | 238.03 | 824 | 804 | 159.3 |
| C | 14 | 238 | 123946 | 653.92 | 792 | 799 | 188.3 |
| C | 13 | 61 | 5601 | 25.5 | 792 | 799 | 188.3 |
| C | 3 | 233 | 2993 | 11.65 | 792 | 799 | 188.3 |
| D | 7 | 238 | 14338736 | 150480.42 | 389 | 379 | 95.3 |
| D | 0 | 11 | 304901 | 3195.94 | 389 | 379 | 95.3 |
| D | 14 | 35 | 124257 | 1300.09 | 389 | 379 | 95.3 |
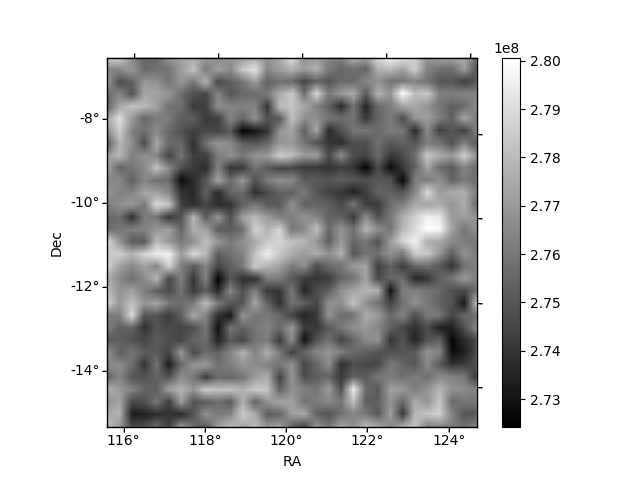
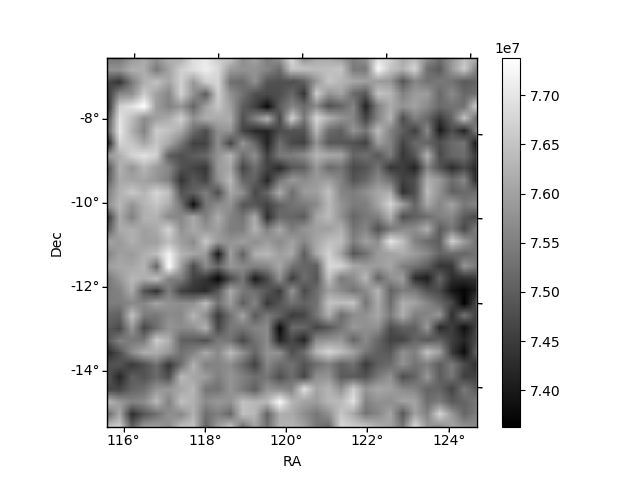
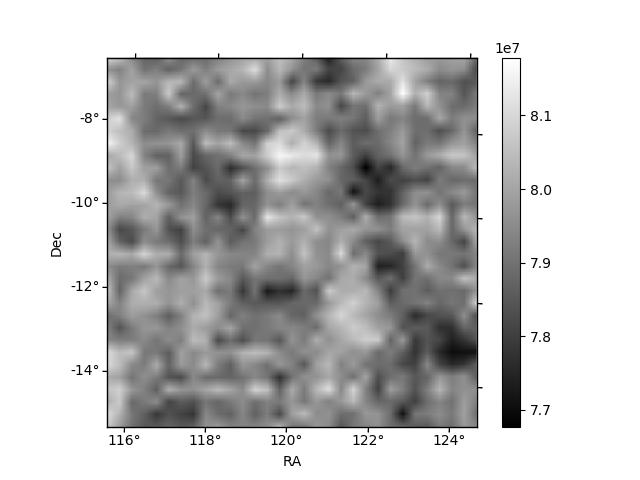
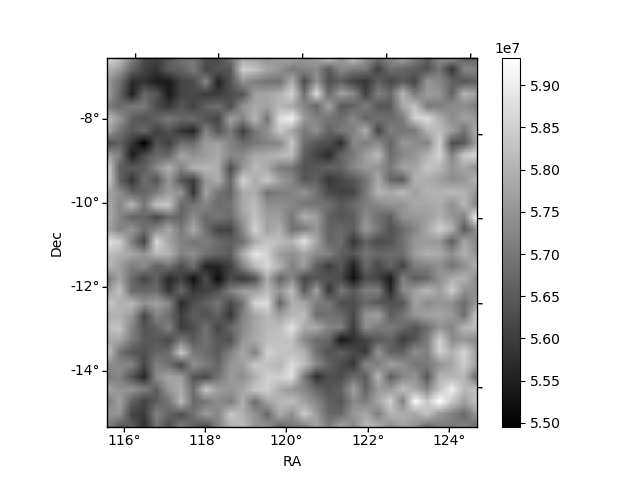
Histogram calculated using DETX and DETY for each event in the final _common_clean file
| Quadrant A | 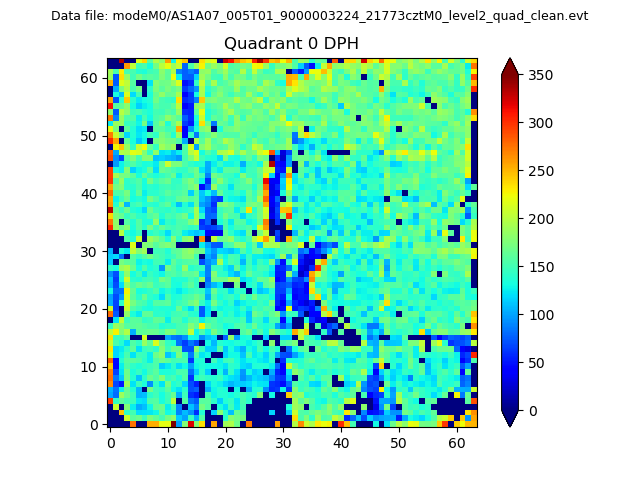 |
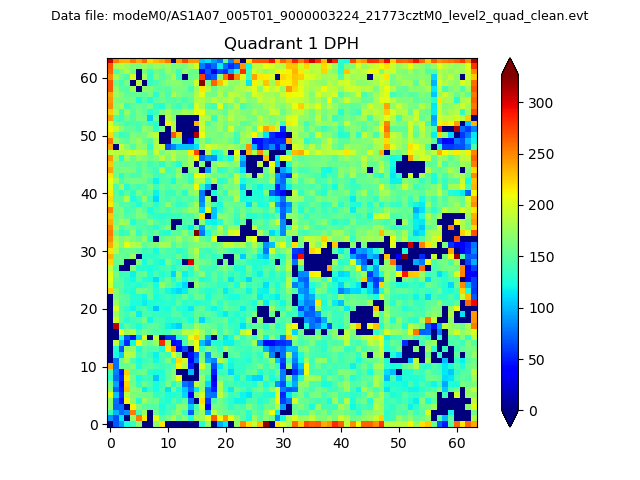 |
Quadrant B |
|---|---|---|---|
| Quadrant D | 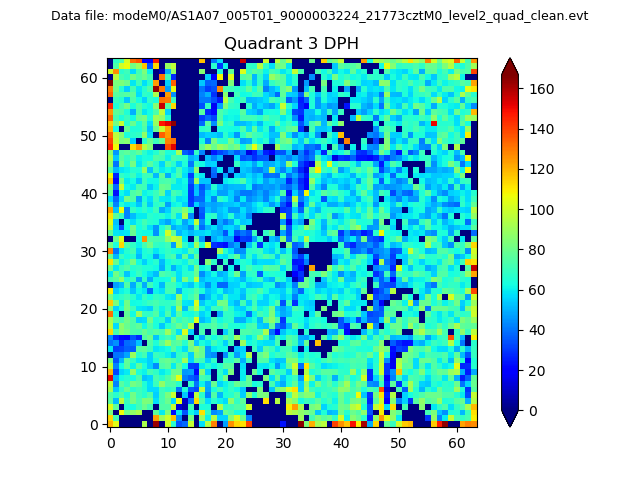 |
 |
Quadrant C |
| Plot type | Count rate plots | Images |
|---|---|---|
| Comparison with Poisson distribution Blue bars denote a histogram of data divided into 1 sec bins. Red curve is a Poisson curve with rate = median count rate of data. |
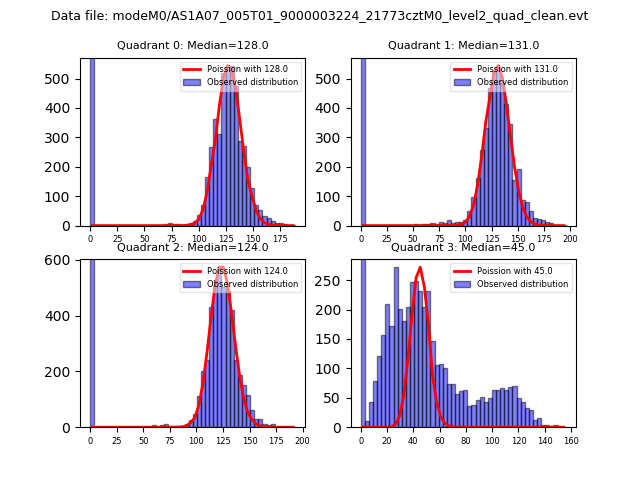 |
 |
| Quadrant-wise count rates Data is divided into 100 sec bins |
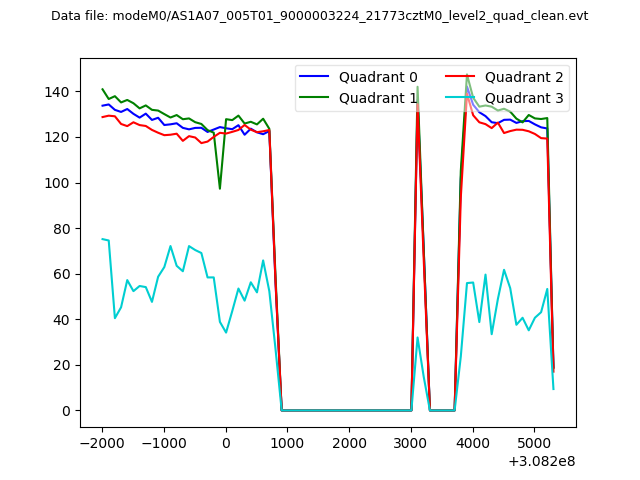 |
|
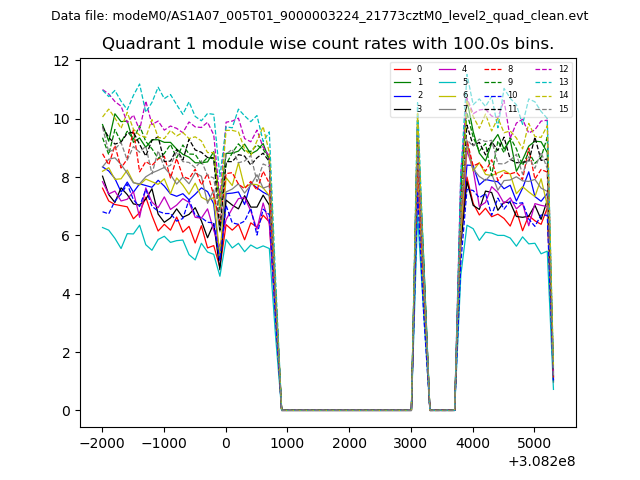
| Module-wise count rates for Quadrant A Data is divided into 100 sec bins |
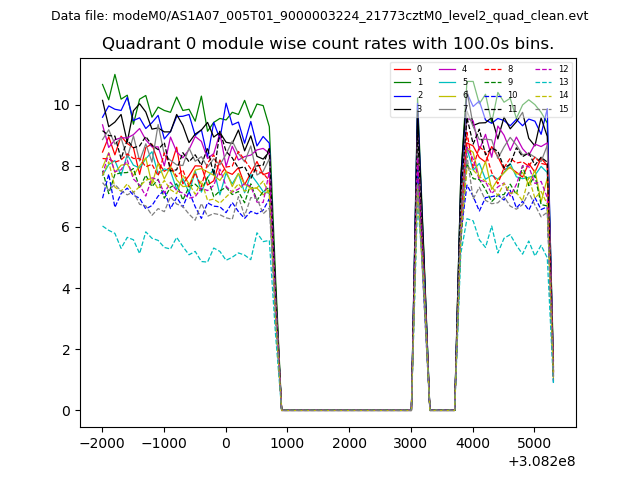 |
 |
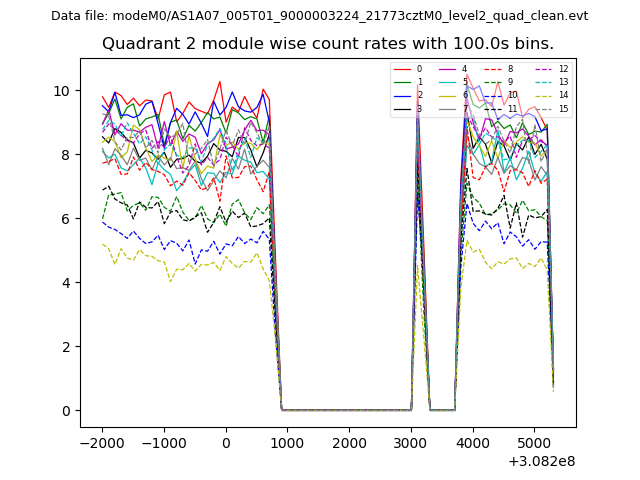
| Module-wise count rates for Quadrant B Data is divided into 100 sec bins |
 |
 |
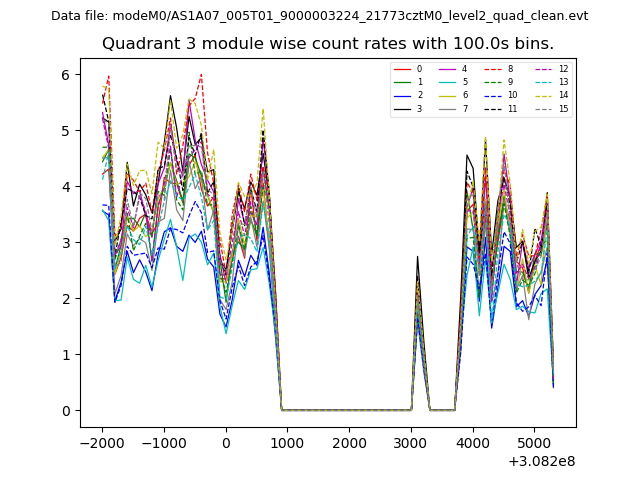
| Module-wise count rates for Quadrant C Data is divided into 100 sec bins |
 |
 |
| Module-wise count rates for Quadrant D Data is divided into 100 sec bins |
 |
 |
| Parameter | Plot |
|---|---|
| CZT HV Monitor |  |
| D_VDD |  |
| Temperature 1 | 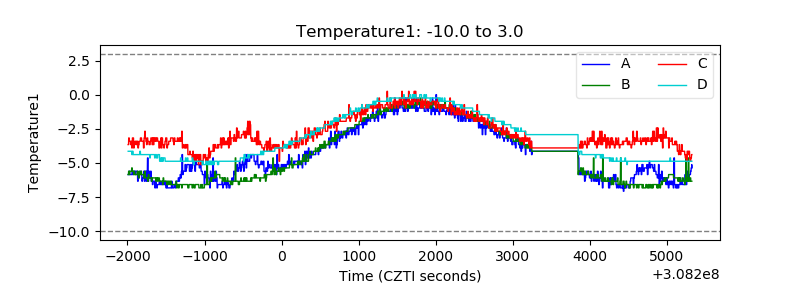 |
| Veto HV Monitor |  |
| Veto LLD | 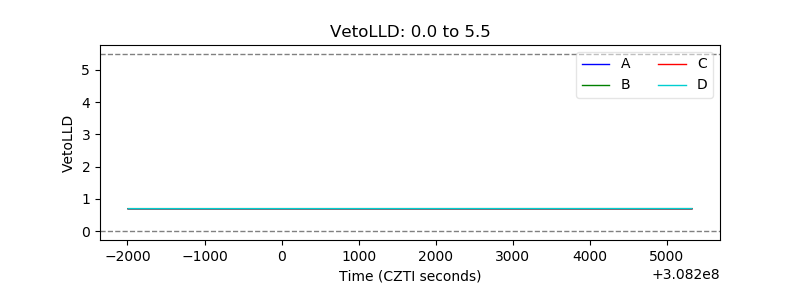 |
| Alpha Counter | 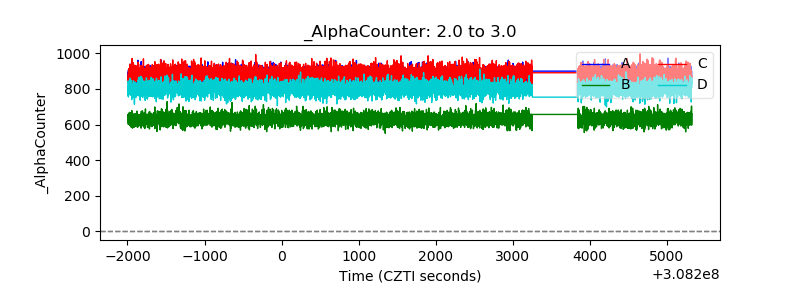 |
| _CPM_Rate | 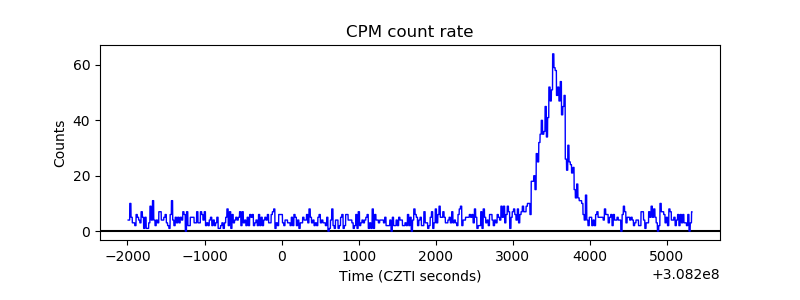 |
| CZT Counter |  |
| +2.5 Volts monitor |  |
| +5 Volts monitor | 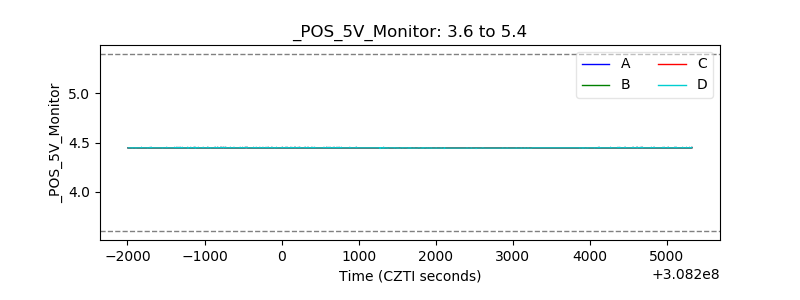 |
| _ROLL_ROT | 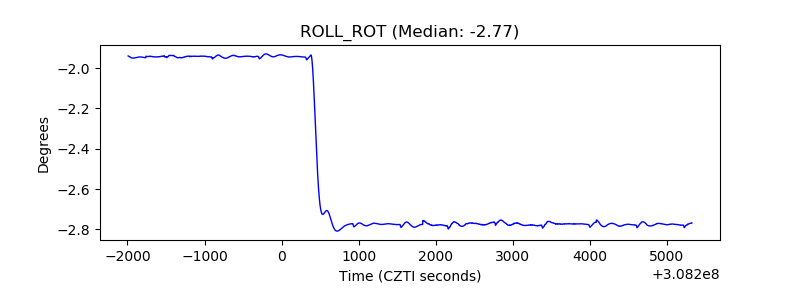 |
| _Roll_DEC | 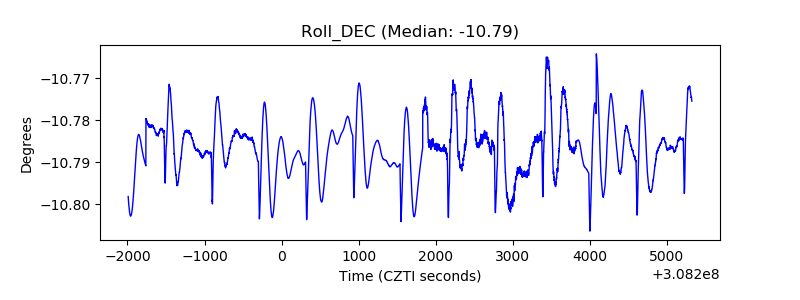 |
| _Roll_RA | 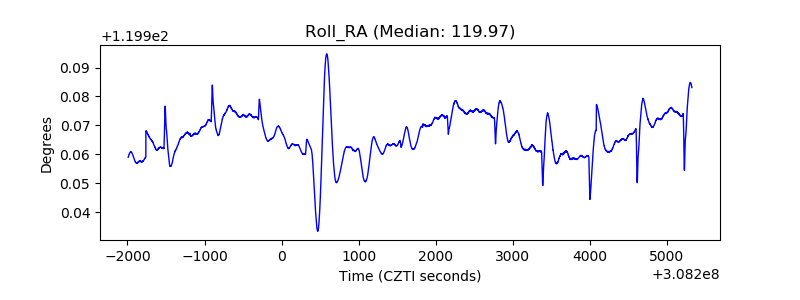 |
| Veto Counter | 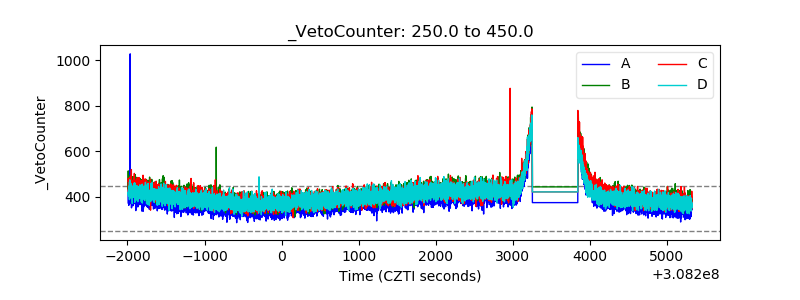 |