| Param | Original file | Final file |
|---|---|---|
| Filename | modeM0/AS1A07_005T01_9000003224_21779cztM0_level2.evt | modeM0/AS1A07_005T01_9000003224_21779cztM0_level2_quad_clean.evt |
| Size (bytes) | 2,698,246,080 | 270,063,360 |
| Size | 2.5 GB | 257.6 MB |
| Events in quadrant A | 11,462,954 | 1,784,741 |
| Events in quadrant B | 13,322,593 | 1,799,015 |
| Events in quadrant C | 11,592,776 | 1,722,011 |
| Events in quadrant D | 43,706,614 | 1,202,030 |
| Mode M9 | |||
|---|---|---|---|
| Quadrant | BADHDUFLAG | Total packets | Discarded packets |
| A | 0 | 32 | 0 |
| B | 0 | 32 | 0 |
| C | 0 | 32 | 0 |
| D | 0 | 32 | 0 |
| Mode M0 | |||
|---|---|---|---|
| Quadrant | BADHDUFLAG | Total packets | Discarded packets |
| A | 0 | 49693 | 6 |
| B | 0 | 54541 | 5 |
| C | 0 | 49702 | 5 |
| D | 0 | 146509 | 5 |
| Mode SS | |||
|---|---|---|---|
| Quadrant | BADHDUFLAG | Total packets | Discarded packets |
| A | 0 | 494 | 0 |
| B | 0 | 494 | 0 |
| C | 0 | 494 | 0 |
| D | 0 | 494 | 0 |
| Quadrant | Total seconds | Saturated seconds | Saturation percentage |
|---|---|---|---|
| A | 24236 | 321 | 1.324476% |
| B | 24237 | 708 | 2.921154% |
| C | 24237 | 378 | 1.559599% |
| D | 24237 | 13517 | 55.770104% |
Noise dominated data is calculated using 1-second bins in cleaned event files. If a bin has >2000 counts, and if more than 50% of those come from <1% of pixels, then it is considered to be noise-dominated and hence unusable.
| Quadrant | # 1 sec bins | Bins with >0 counts | Bins with >2000 counts | High rate bins dominated by noise | Noise dominated (total time) | Noise dominated (detector-on time) | Marked lightcurve |
|---|---|---|---|---|---|---|---|
| A | 27361 | 24238 | 0 | 0 | 0.00% | 0.00% | 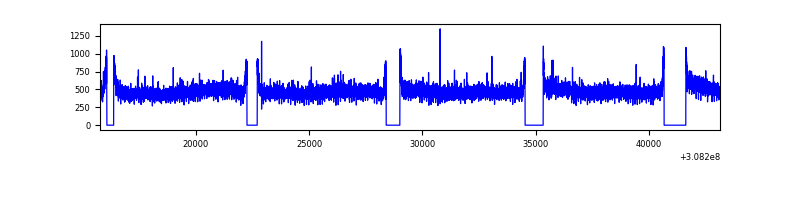 |
| B | 27362 | 24240 | 290 | 290 | 1.06% | 1.20% | 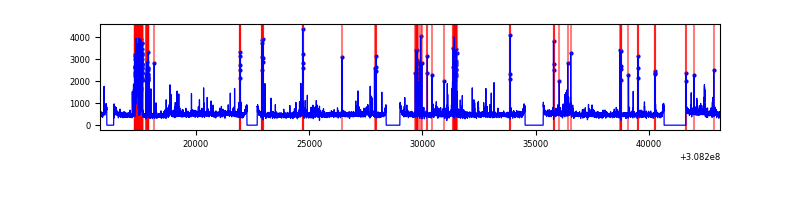 |
| C | 27362 | 24240 | 1 | 1 | 0.00% | 0.00% | 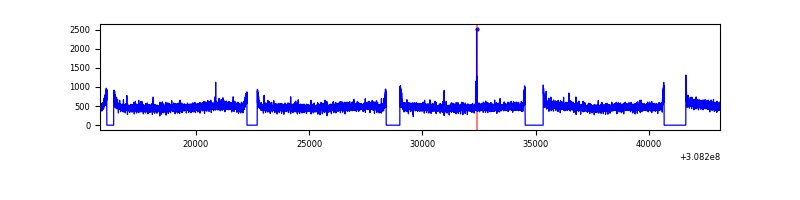 |
| D | 27362 | 24237 | 11837 | 11837 | 43.26% | 48.84% | 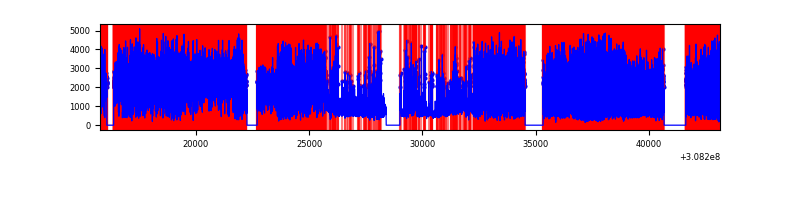 |
Top three noisy pixels from each quadrant. If the there are fewer than three noisy pixels in the level2.evt file, extra rows are filled as -1
| Pixel properties | Quadrant properties | ||||||
|---|---|---|---|---|---|---|---|
| Quadrant | DetID | PixID | Counts | Sigma | Mean | Median | Sigma |
| A | 13 | 254 | 44751 | 70.39 | 2968 | 2897 | 594.6 |
| A | 0 | 226 | 25655 | 38.28 | 2968 | 2897 | 594.6 |
| A | 3 | 137 | 24662 | 36.61 | 2968 | 2897 | 594.6 |
| B | 3 | 64 | 1203894 | 2164.81 | 2949 | 2877 | 554.8 |
| B | 0 | 190 | 150310 | 265.75 | 2949 | 2877 | 554.8 |
| B | 0 | 230 | 135706 | 239.42 | 2949 | 2877 | 554.8 |
| C | 14 | 238 | 444049 | 656.35 | 2853 | 2871 | 672.2 |
| C | 13 | 61 | 20058 | 25.57 | 2853 | 2871 | 672.2 |
| C | 10 | 23 | 15454 | 18.72 | 2853 | 2871 | 672.2 |
| D | 7 | 238 | 32984389 | 61968.12 | 2174 | 2106 | 532.2 |
| D | 1 | 52 | 1046128 | 1961.54 | 2174 | 2106 | 532.2 |
| D | 2 | 136 | 486546 | 910.18 | 2174 | 2106 | 532.2 |
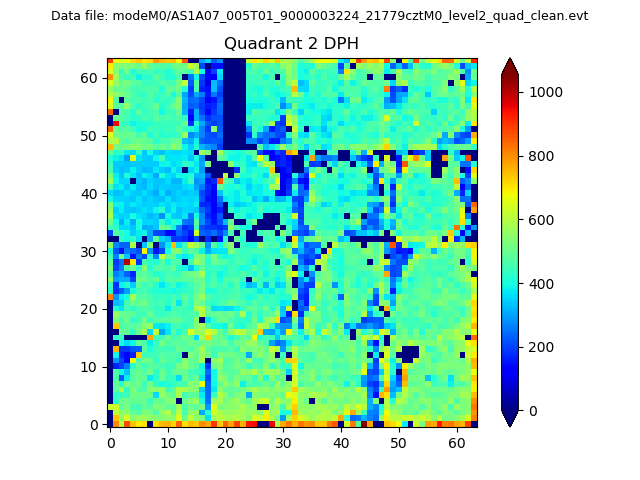
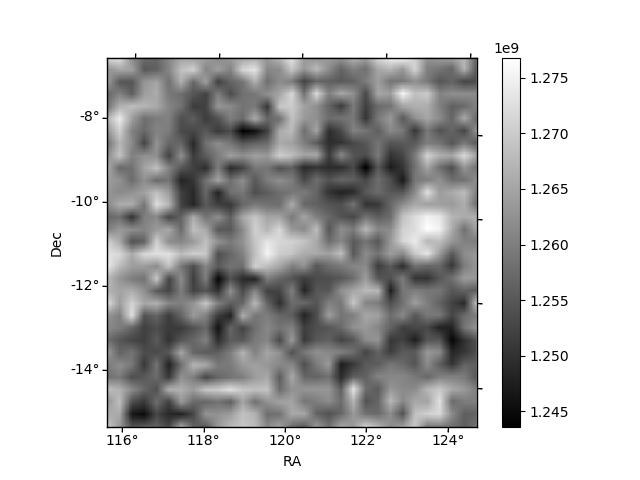
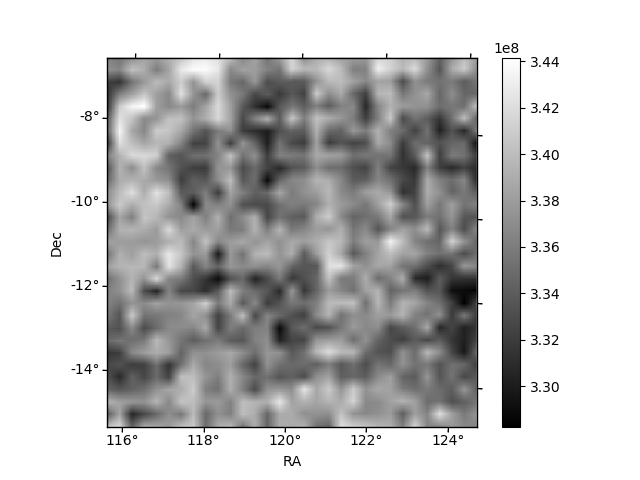
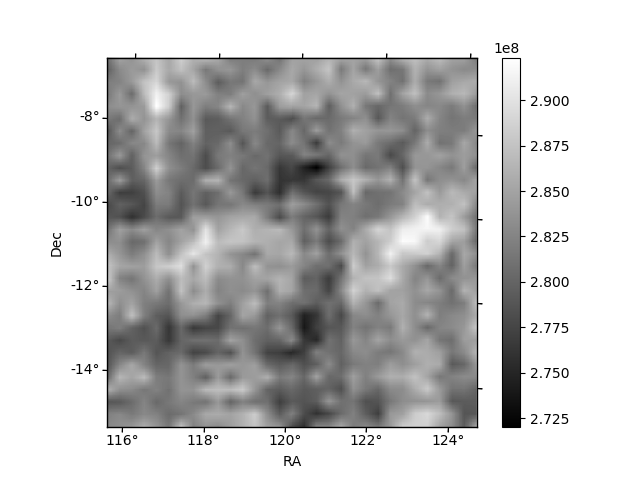
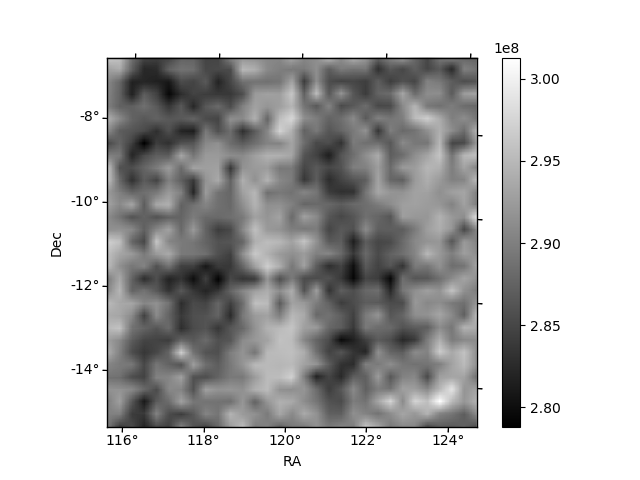
Histogram calculated using DETX and DETY for each event in the final _common_clean file
| Quadrant A | 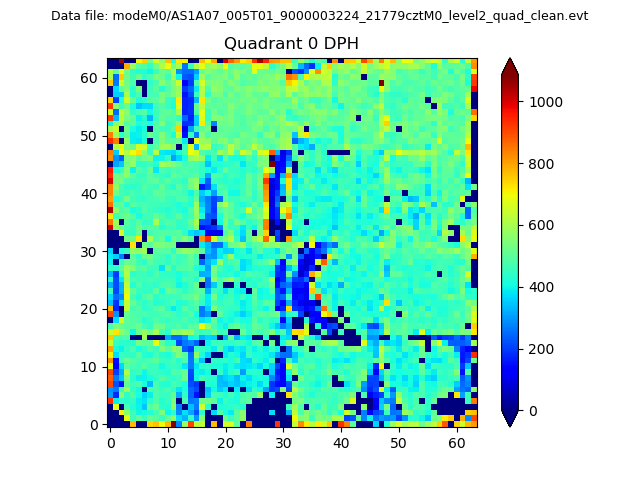 |
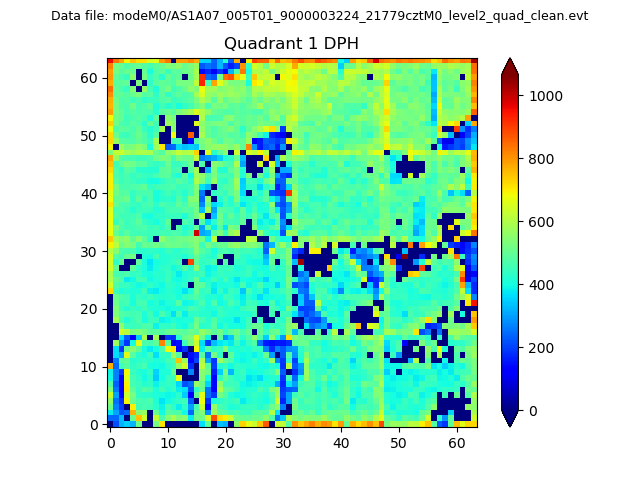 |
Quadrant B |
|---|---|---|---|
| Quadrant D | 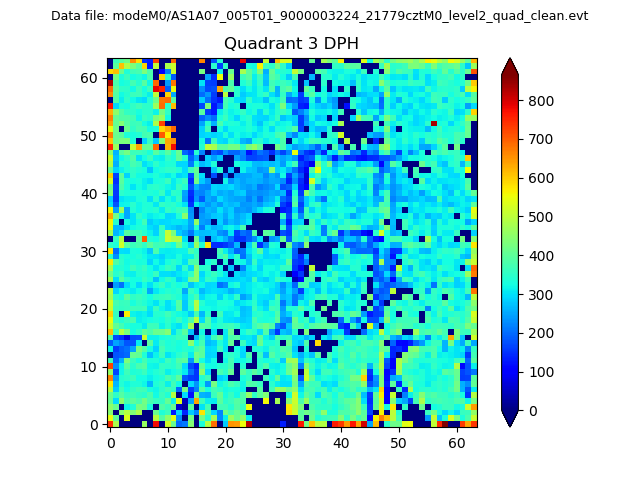 |
 |
Quadrant C |
| Plot type | Count rate plots | Images |
|---|---|---|
| Comparison with Poisson distribution Blue bars denote a histogram of data divided into 1 sec bins. Red curve is a Poisson curve with rate = median count rate of data. |
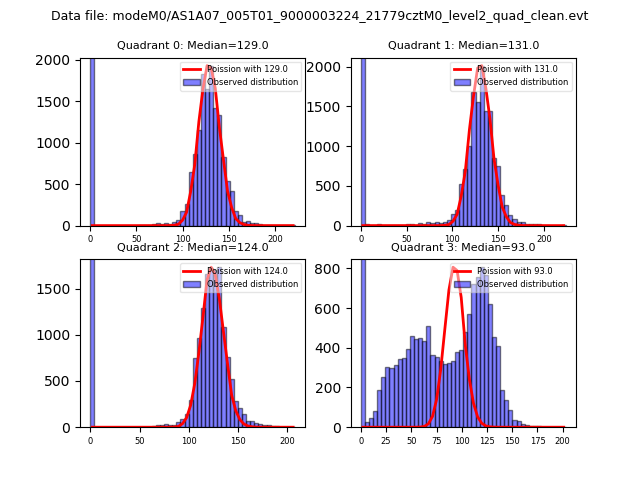 |
 |
| Quadrant-wise count rates Data is divided into 100 sec bins |
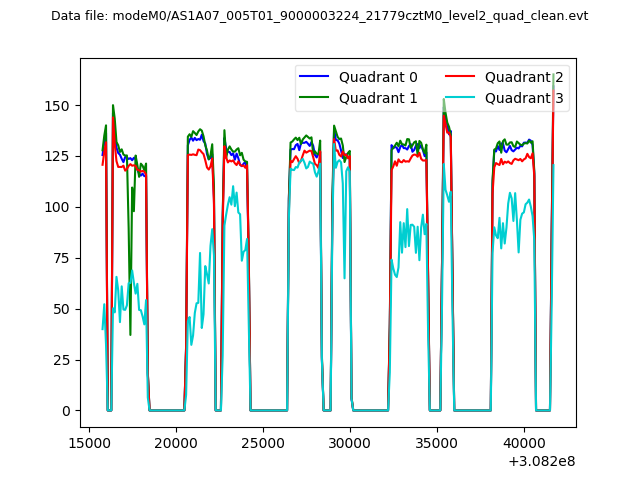 |
|
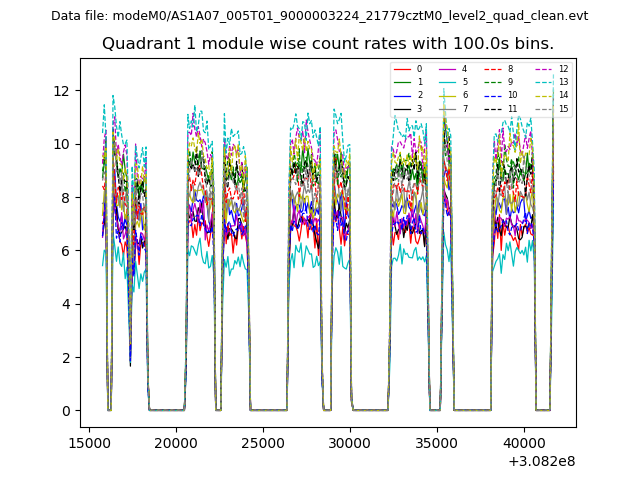
| Module-wise count rates for Quadrant A Data is divided into 100 sec bins |
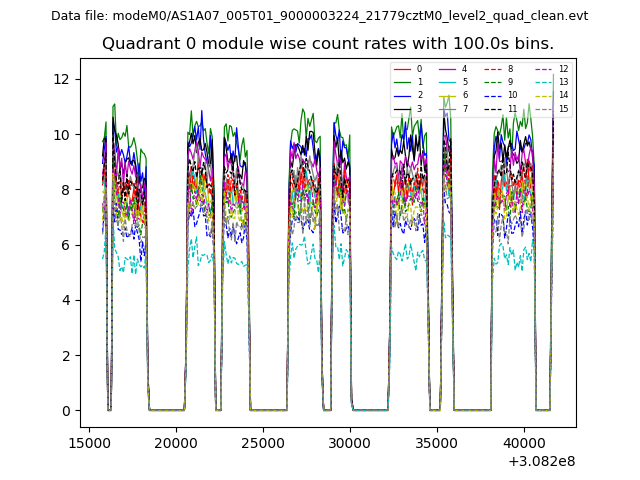 |
 |
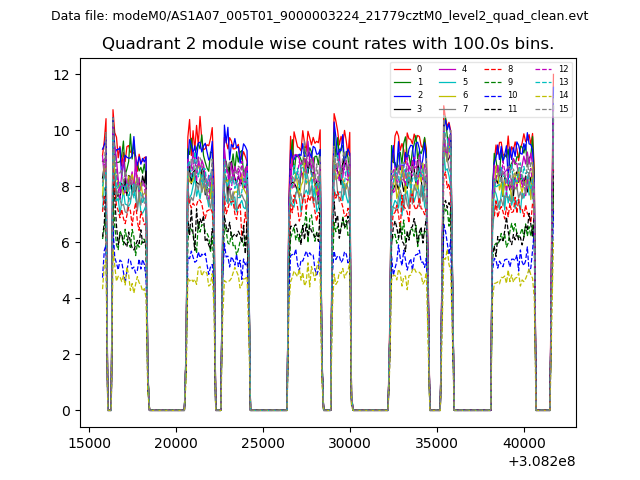
| Module-wise count rates for Quadrant B Data is divided into 100 sec bins |
 |
 |
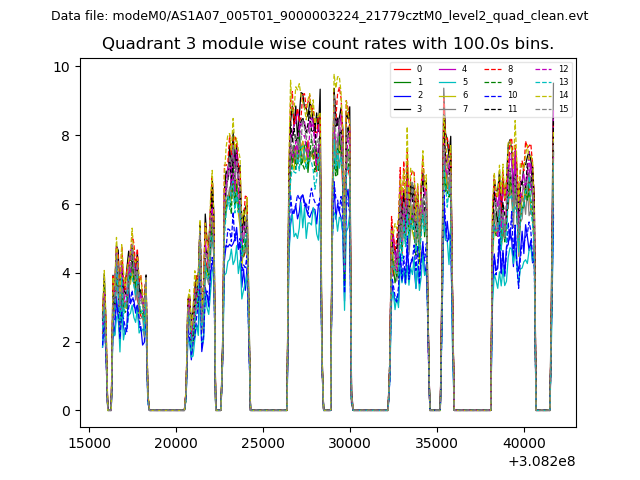
| Module-wise count rates for Quadrant C Data is divided into 100 sec bins |
 |
 |
| Module-wise count rates for Quadrant D Data is divided into 100 sec bins |
 |
 |
| Parameter | Plot |
|---|---|
| CZT HV Monitor | 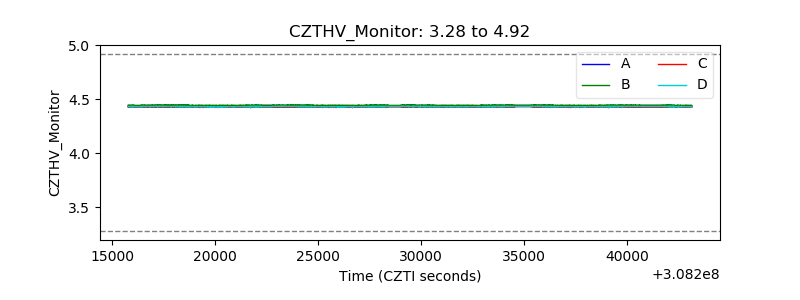 |
| D_VDD | 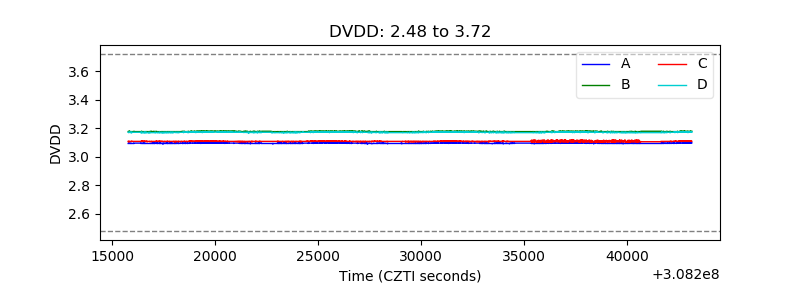 |
| Temperature 1 | 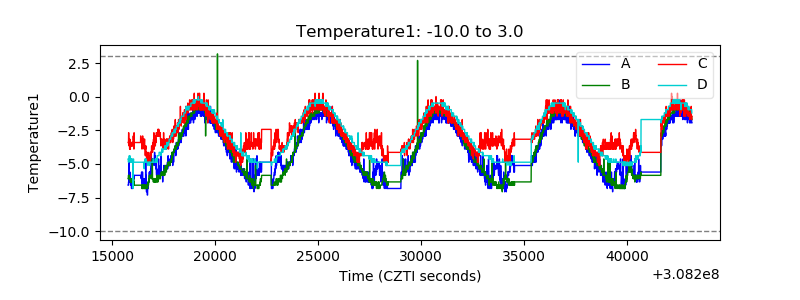 |
| Veto HV Monitor | 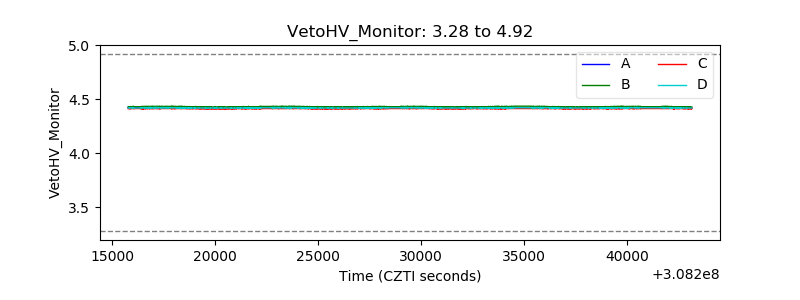 |
| Veto LLD | 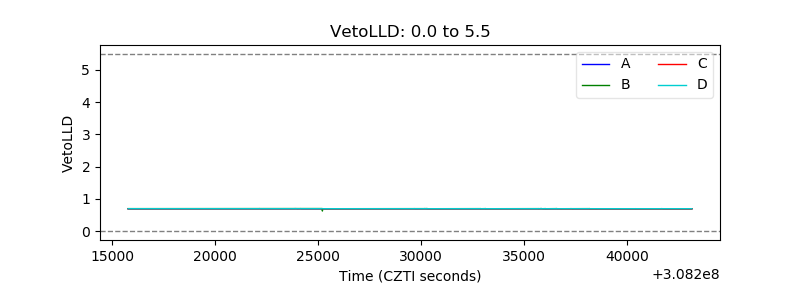 |
| Alpha Counter | 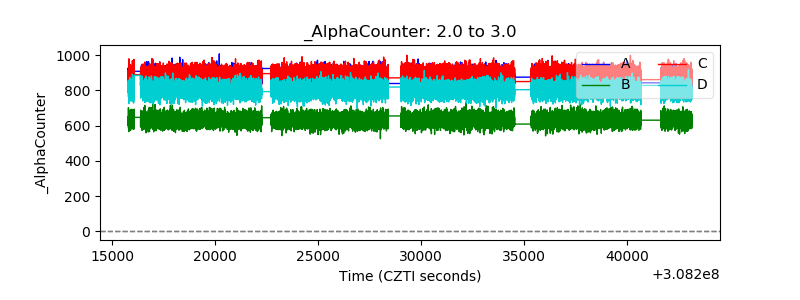 |
| _CPM_Rate | 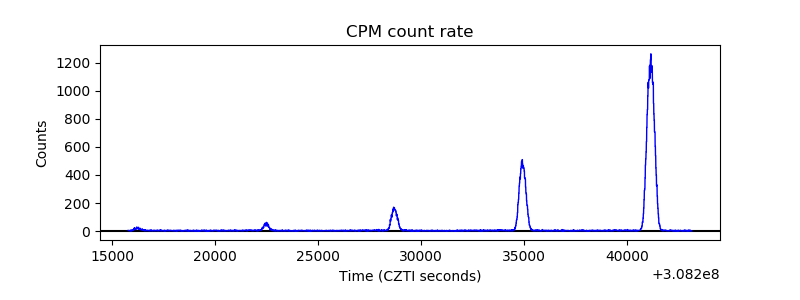 |
| CZT Counter | 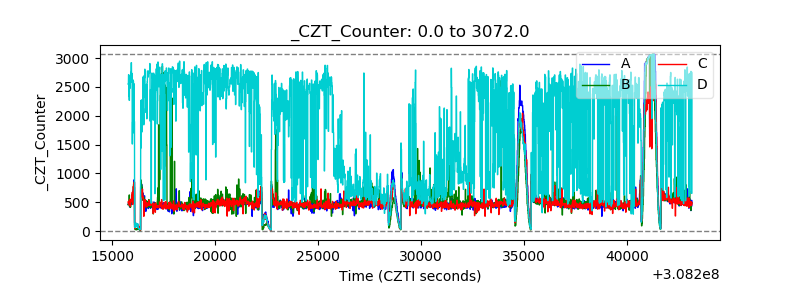 |
| +2.5 Volts monitor | 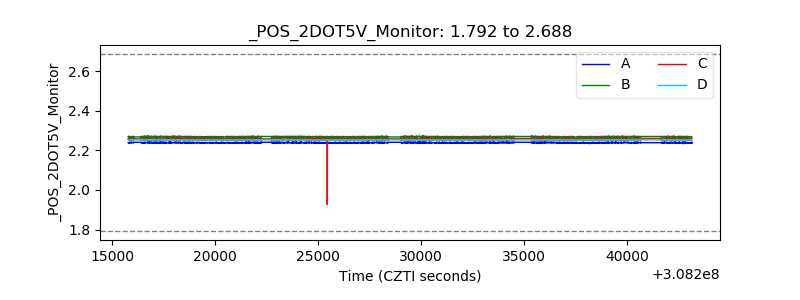 |
| +5 Volts monitor |  |
| _ROLL_ROT | 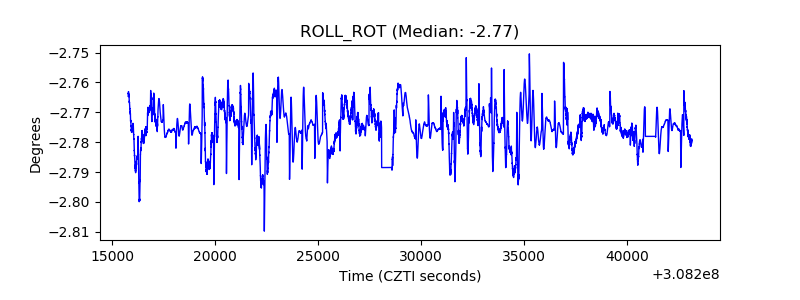 |
| _Roll_DEC | 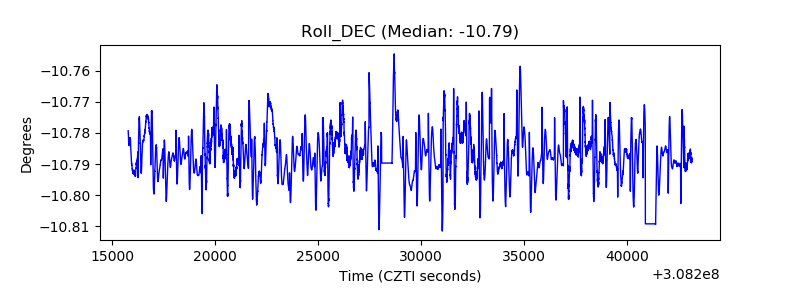 |
| _Roll_RA | 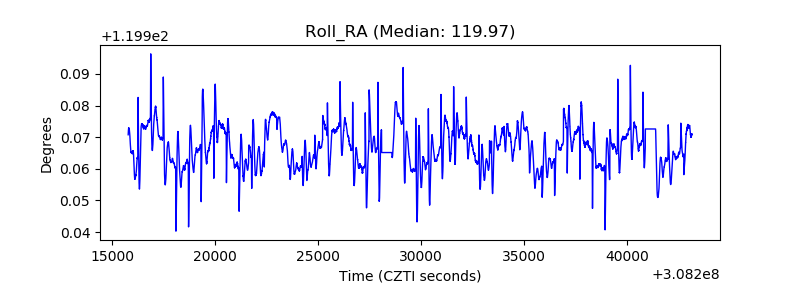 |
| Veto Counter | 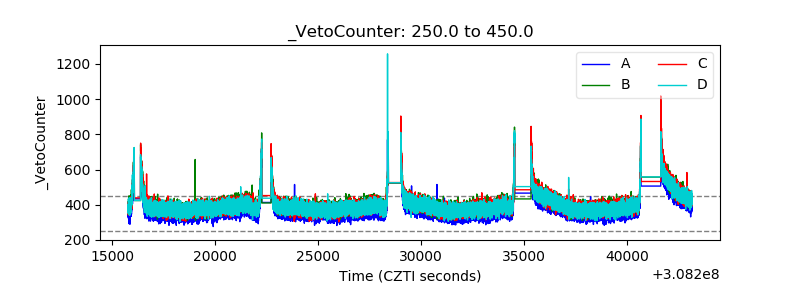 |