| Param | Original file | Final file |
|---|---|---|
| Filename | modeM0/AS1A07_005T01_9000003224_21782cztM0_level2.evt | modeM0/AS1A07_005T01_9000003224_21782cztM0_level2_quad_clean.evt |
| Size (bytes) | 796,348,800 | 64,494,720 |
| Size | 759.5 MB | 61.5 MB |
| Events in quadrant A | 3,324,219 | 423,674 |
| Events in quadrant B | 3,653,262 | 429,094 |
| Events in quadrant C | 3,328,667 | 402,352 |
| Events in quadrant D | 13,383,319 | 255,079 |
| Mode M9 | |||
|---|---|---|---|
| Quadrant | BADHDUFLAG | Total packets | Discarded packets |
| A | 0 | 12 | 0 |
| B | 0 | 12 | 0 |
| C | 0 | 12 | 0 |
| D | 0 | 12 | 0 |
| Mode M0 | |||
|---|---|---|---|
| Quadrant | BADHDUFLAG | Total packets | Discarded packets |
| A | 0 | 13983 | 2 |
| B | 0 | 14957 | 2 |
| C | 0 | 13885 | 2 |
| D | 0 | 44054 | 2 |
| Mode SS | |||
|---|---|---|---|
| Quadrant | BADHDUFLAG | Total packets | Discarded packets |
| A | 0 | 130 | 0 |
| B | 0 | 130 | 0 |
| C | 0 | 130 | 0 |
| D | 0 | 130 | 0 |
| Quadrant | Total seconds | Saturated seconds | Saturation percentage |
|---|---|---|---|
| A | 6319 | 45 | 0.712138% |
| B | 6320 | 88 | 1.392405% |
| C | 6320 | 88 | 1.392405% |
| D | 6320 | 4755 | 75.237342% |
Noise dominated data is calculated using 1-second bins in cleaned event files. If a bin has >2000 counts, and if more than 50% of those come from <1% of pixels, then it is considered to be noise-dominated and hence unusable.
| Quadrant | # 1 sec bins | Bins with >0 counts | Bins with >2000 counts | High rate bins dominated by noise | Noise dominated (total time) | Noise dominated (detector-on time) | Marked lightcurve |
|---|---|---|---|---|---|---|---|
| A | 7544 | 6320 | 1 | 1 | 0.01% | 0.02% | 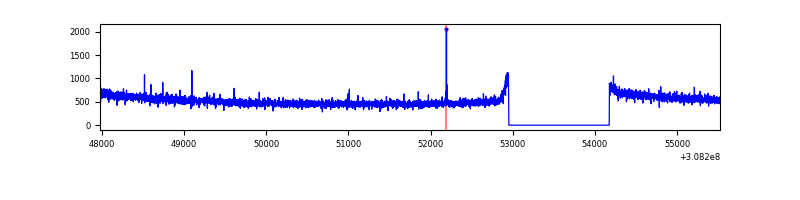 |
| B | 7545 | 6321 | 19 | 19 | 0.25% | 0.30% | 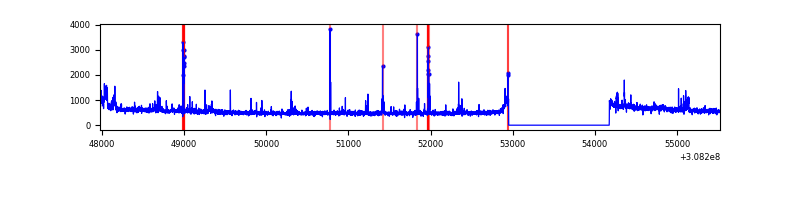 |
| C | 7545 | 6321 | 0 | 0 | 0.00% | 0.00% | 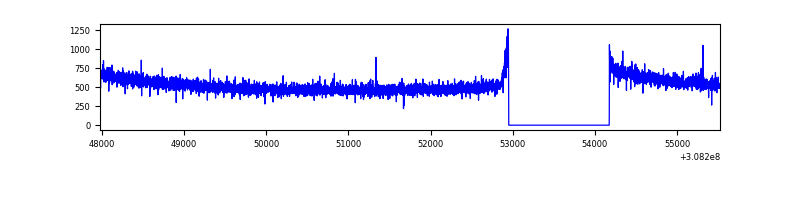 |
| D | 7545 | 6320 | 4116 | 4116 | 54.55% | 65.13% | 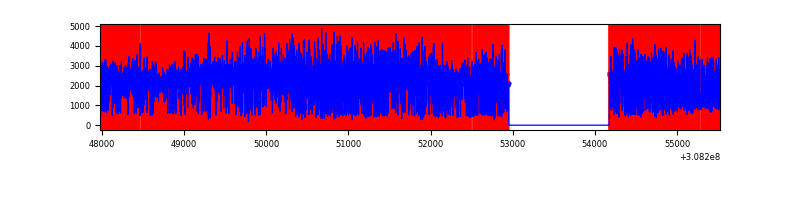 |
Top three noisy pixels from each quadrant. If the there are fewer than three noisy pixels in the level2.evt file, extra rows are filled as -1
| Pixel properties | Quadrant properties | ||||||
|---|---|---|---|---|---|---|---|
| Quadrant | DetID | PixID | Counts | Sigma | Mean | Median | Sigma |
| A | 13 | 254 | 12482 | 68.01 | 860 | 845 | 171.1 |
| A | 0 | 226 | 7770 | 40.47 | 860 | 845 | 171.1 |
| A | 5 | 16 | 7258 | 37.48 | 860 | 845 | 171.1 |
| B | 3 | 64 | 125829 | 780.55 | 858 | 840 | 160.1 |
| B | 0 | 190 | 57055 | 351.06 | 858 | 840 | 160.1 |
| B | 0 | 230 | 50695 | 311.34 | 858 | 840 | 160.1 |
| C | 14 | 238 | 131471 | 689.17 | 819 | 825 | 189.6 |
| C | 13 | 61 | 5961 | 27.09 | 819 | 825 | 189.6 |
| C | 1 | 16 | 3263 | 12.86 | 819 | 825 | 189.6 |
| D | 7 | 238 | 10523477 | 72902.09 | 600 | 582 | 144.3 |
| D | 1 | 52 | 278385 | 1924.61 | 600 | 582 | 144.3 |
| D | 13 | 153 | 137554 | 948.94 | 600 | 582 | 144.3 |
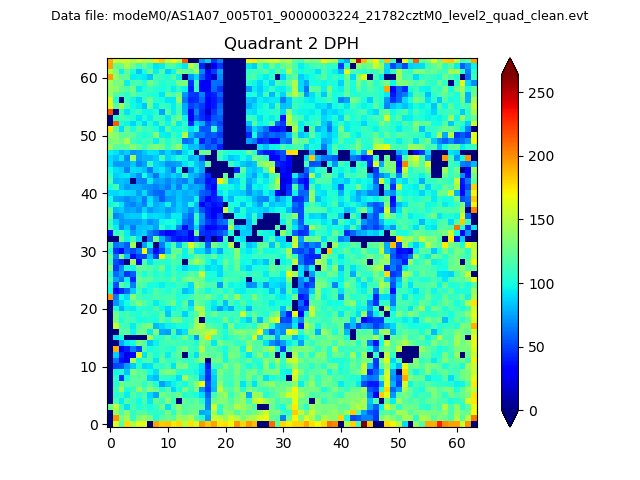
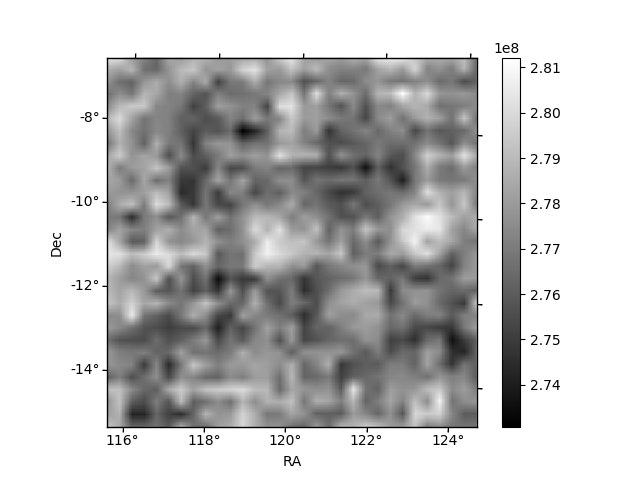
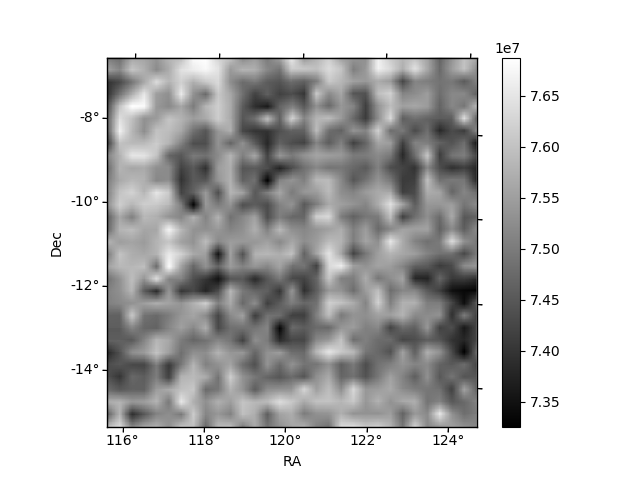
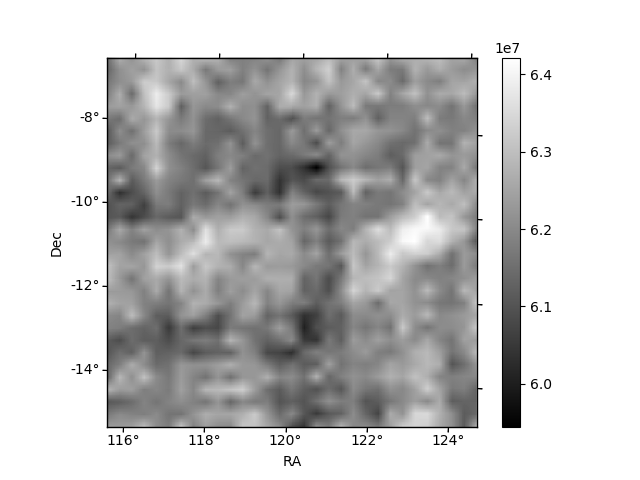
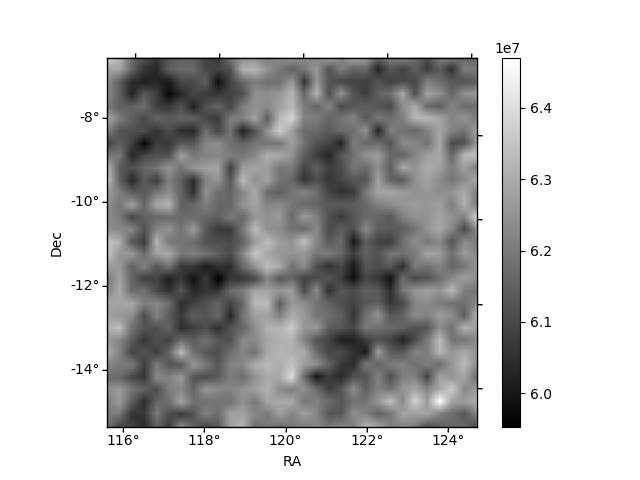
Histogram calculated using DETX and DETY for each event in the final _common_clean file
| Quadrant A | 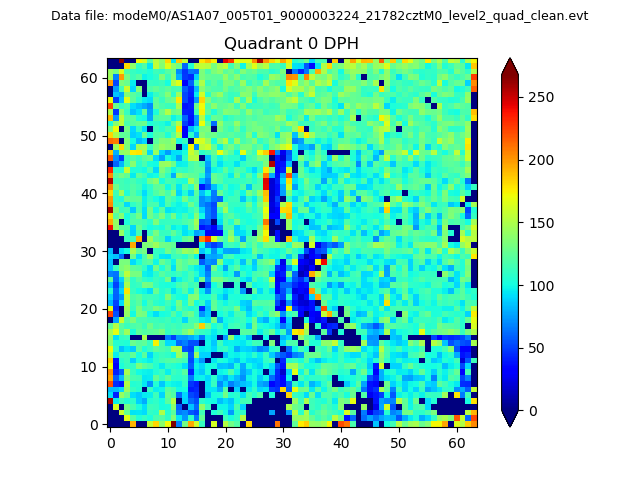 |
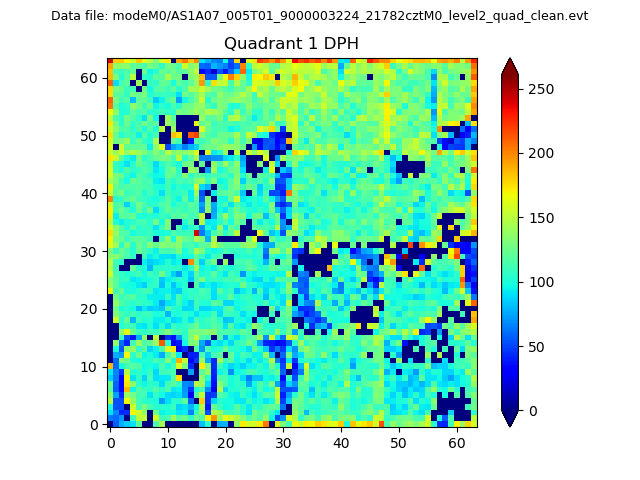 |
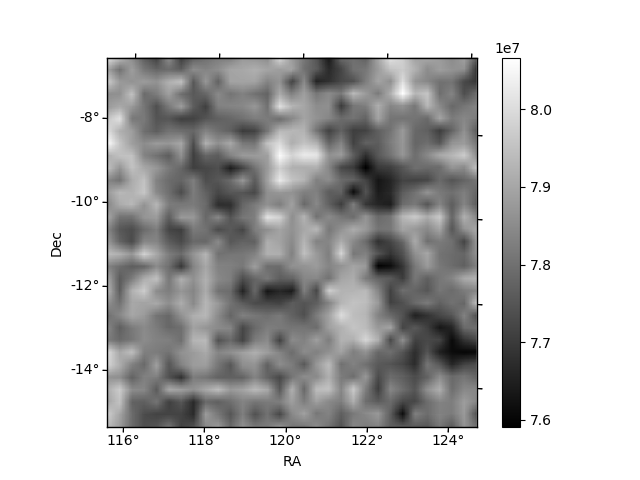
Quadrant B |
|---|---|---|---|
| Quadrant D | 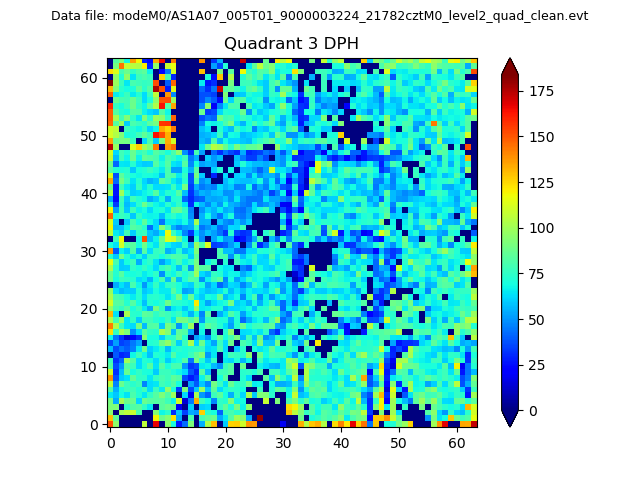 |
 |
Quadrant C |
| Plot type | Count rate plots | Images |
|---|---|---|
| Comparison with Poisson distribution Blue bars denote a histogram of data divided into 1 sec bins. Red curve is a Poisson curve with rate = median count rate of data. |
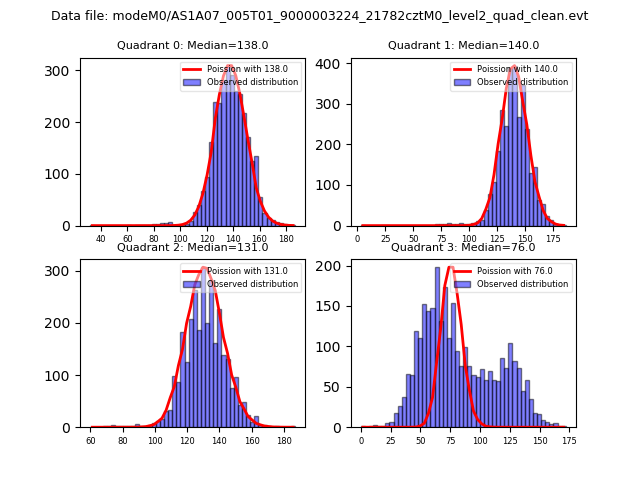 |
 |
| Quadrant-wise count rates Data is divided into 100 sec bins |
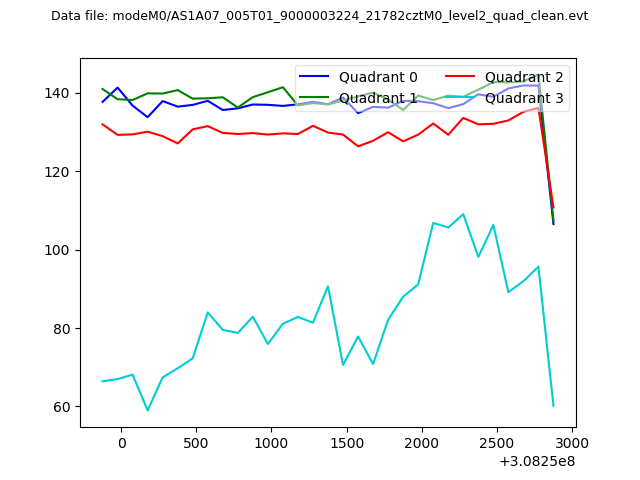 |
|
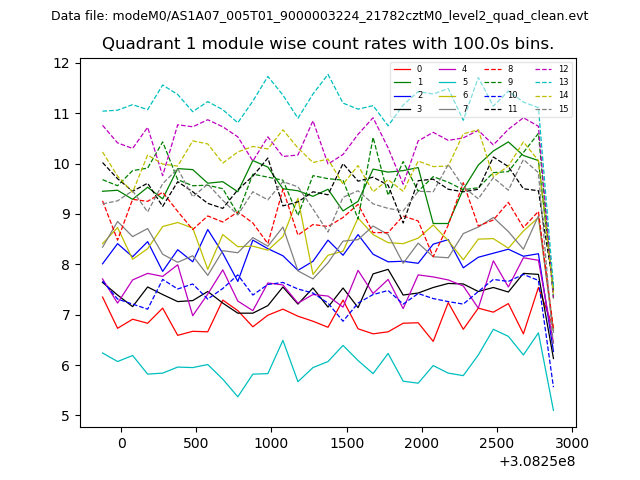
| Module-wise count rates for Quadrant A Data is divided into 100 sec bins |
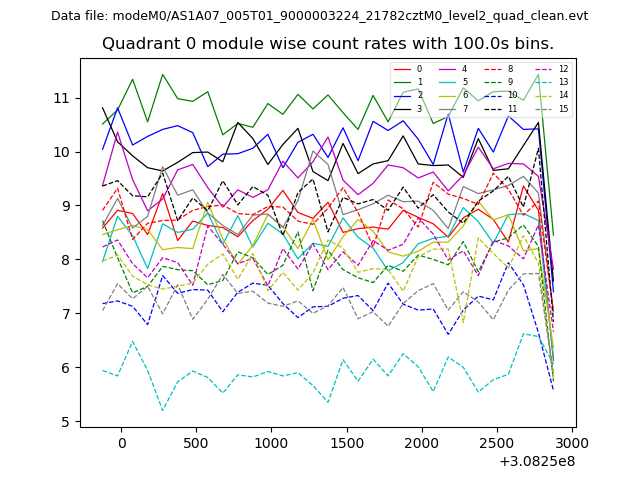 |
 |
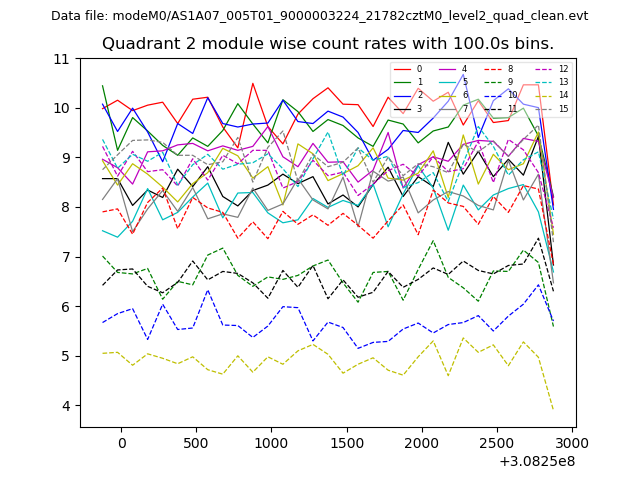
| Module-wise count rates for Quadrant B Data is divided into 100 sec bins |
 |
 |
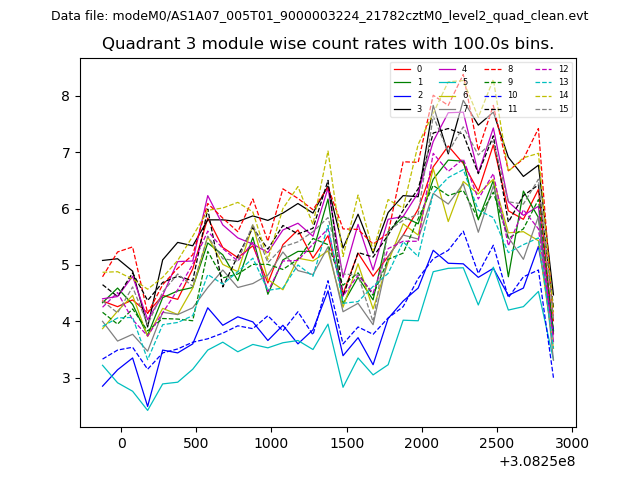
| Module-wise count rates for Quadrant C Data is divided into 100 sec bins |
 |
 |
| Module-wise count rates for Quadrant D Data is divided into 100 sec bins |
 |
 |
| Parameter | Plot |
|---|---|
| CZT HV Monitor | 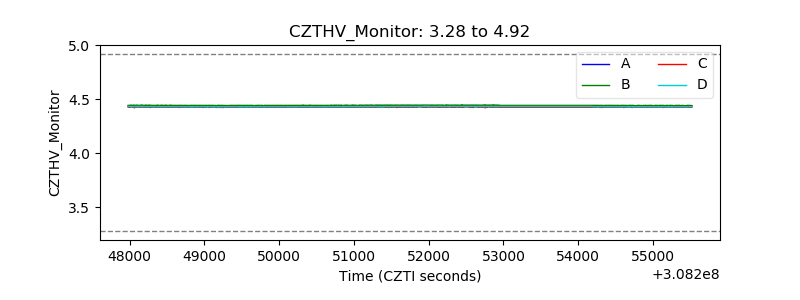 |
| D_VDD | 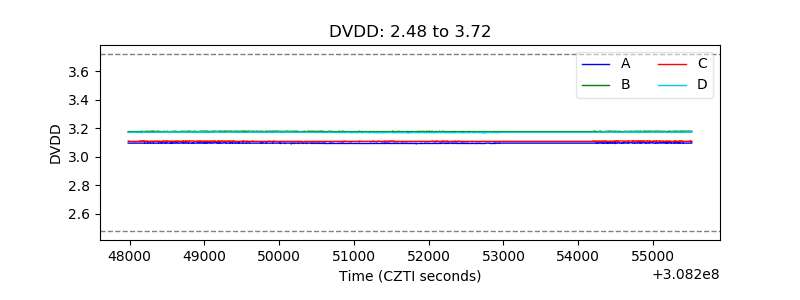 |
| Temperature 1 | 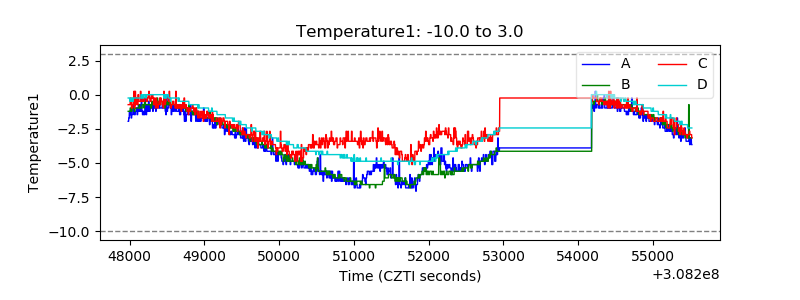 |
| Veto HV Monitor | 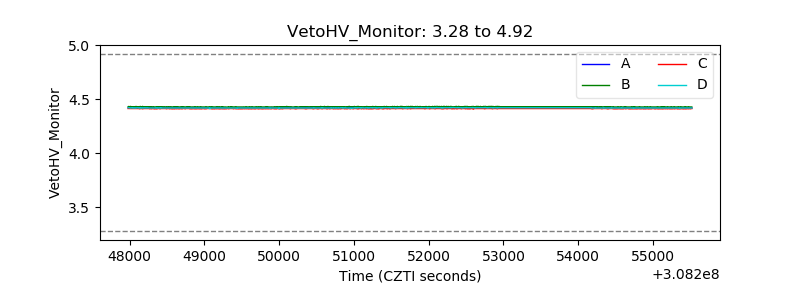 |
| Veto LLD | 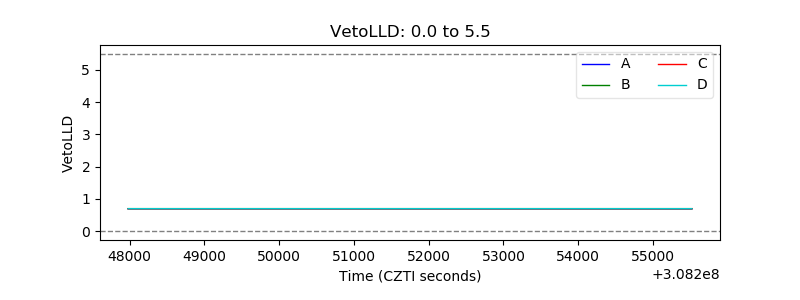 |
| Alpha Counter | 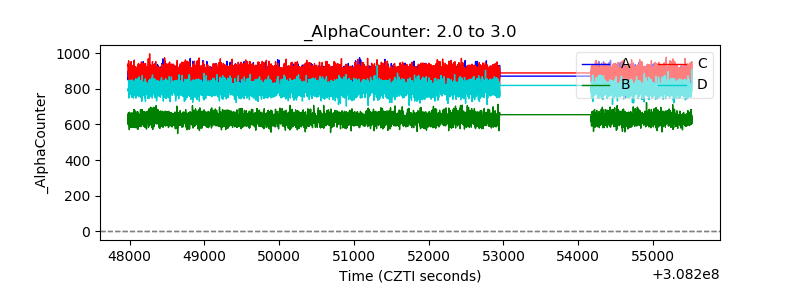 |
| _CPM_Rate |  |
| CZT Counter | 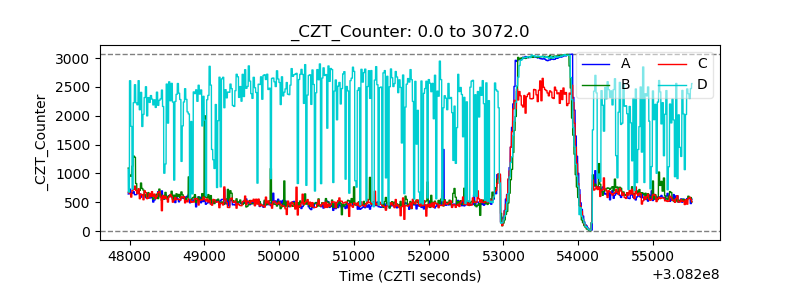 |
| +2.5 Volts monitor |  |
| +5 Volts monitor |  |
| _ROLL_ROT | 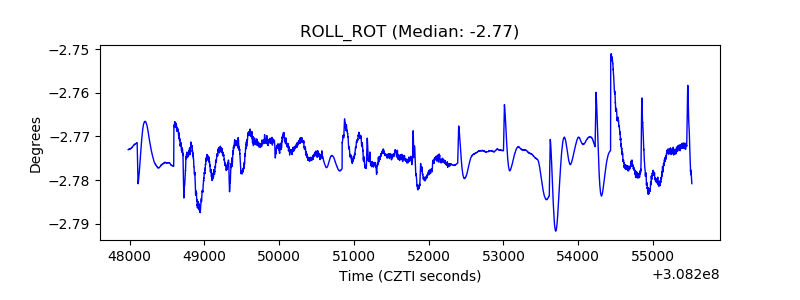 |
| _Roll_DEC | 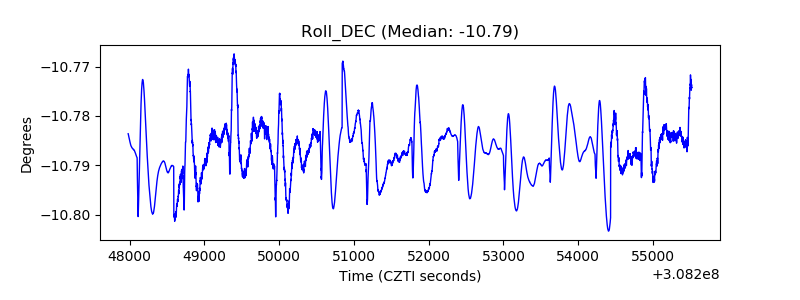 |
| _Roll_RA | 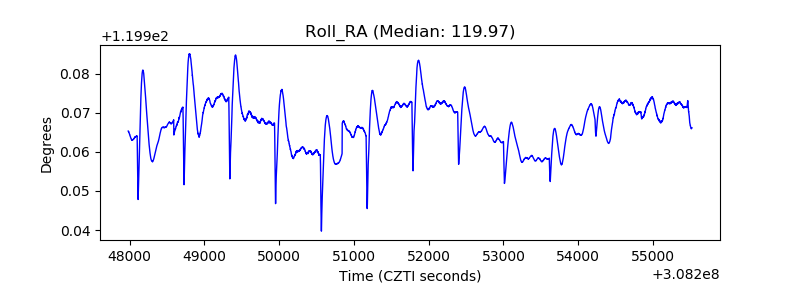 |
| Veto Counter | 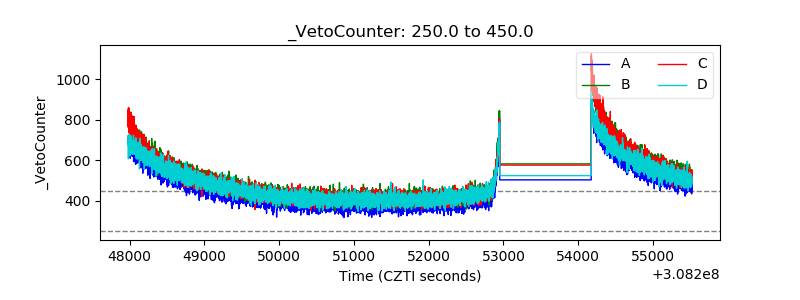 |