| Param | Original file | Final file |
|---|---|---|
| Filename | modeM0/AS1A07_005T01_9000003224_21783cztM0_level2.evt | modeM0/AS1A07_005T01_9000003224_21783cztM0_level2_quad_clean.evt |
| Size (bytes) | 3,417,704,640 | 367,911,360 |
| Size | 3.2 GB | 350.9 MB |
| Events in quadrant A | 15,531,675 | 2,407,398 |
| Events in quadrant B | 17,035,283 | 2,447,535 |
| Events in quadrant C | 15,664,310 | 2,300,404 |
| Events in quadrant D | 53,150,715 | 1,815,090 |
| Mode M9 | |||
|---|---|---|---|
| Quadrant | BADHDUFLAG | Total packets | Discarded packets |
| A | 0 | 60 | 0 |
| B | 0 | 60 | 0 |
| C | 0 | 60 | 0 |
| D | 0 | 60 | 0 |
| Mode M0 | |||
|---|---|---|---|
| Quadrant | BADHDUFLAG | Total packets | Discarded packets |
| A | 0 | 66416 | 6 |
| B | 0 | 70320 | 6 |
| C | 0 | 66308 | 6 |
| D | 0 | 179517 | 6 |
| Mode SS | |||
|---|---|---|---|
| Quadrant | BADHDUFLAG | Total packets | Discarded packets |
| A | 0 | 642 | 0 |
| B | 0 | 642 | 0 |
| C | 0 | 642 | 0 |
| D | 0 | 642 | 0 |
| Quadrant | Total seconds | Saturated seconds | Saturation percentage |
|---|---|---|---|
| A | 31567 | 353 | 1.118256% |
| B | 31567 | 525 | 1.663129% |
| C | 31567 | 471 | 1.492064% |
| D | 31567 | 15670 | 49.640447% |
Noise dominated data is calculated using 1-second bins in cleaned event files. If a bin has >2000 counts, and if more than 50% of those come from <1% of pixels, then it is considered to be noise-dominated and hence unusable.
| Quadrant | # 1 sec bins | Bins with >0 counts | Bins with >2000 counts | High rate bins dominated by noise | Noise dominated (total time) | Noise dominated (detector-on time) | Marked lightcurve |
|---|---|---|---|---|---|---|---|
| A | 37527 | 31569 | 1 | 1 | 0.00% | 0.00% | 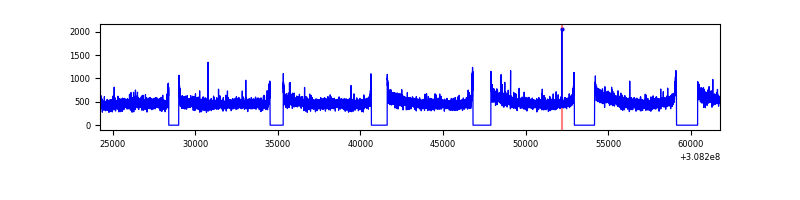 |
| B | 37527 | 31569 | 103 | 103 | 0.27% | 0.33% | 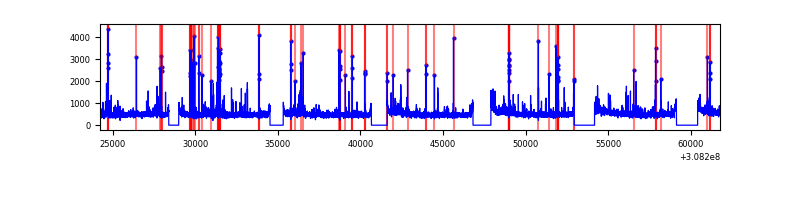 |
| C | 37527 | 31570 | 1 | 1 | 0.00% | 0.00% | 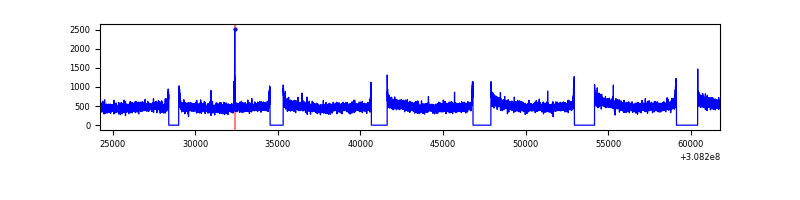 |
| D | 37527 | 31567 | 13838 | 13838 | 36.87% | 43.84% | 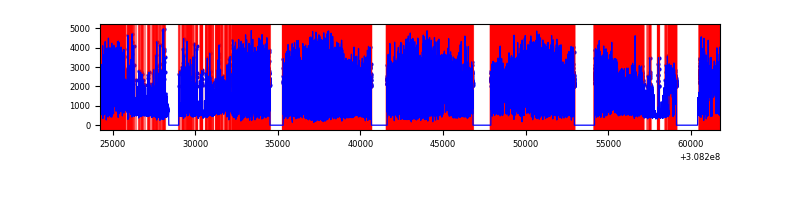 |
Top three noisy pixels from each quadrant. If the there are fewer than three noisy pixels in the level2.evt file, extra rows are filled as -1
| Pixel properties | Quadrant properties | ||||||
|---|---|---|---|---|---|---|---|
| Quadrant | DetID | PixID | Counts | Sigma | Mean | Median | Sigma |
| A | 13 | 254 | 59387 | 69.27 | 4021 | 3936 | 800.5 |
| A | 0 | 226 | 35274 | 39.15 | 4021 | 3936 | 800.5 |
| A | 3 | 137 | 32208 | 35.32 | 4021 | 3936 | 800.5 |
| B | 3 | 64 | 619590 | 822.46 | 4020 | 3934 | 748.6 |
| B | 0 | 190 | 230212 | 302.29 | 4020 | 3934 | 748.6 |
| B | 0 | 230 | 160740 | 209.48 | 4020 | 3934 | 748.6 |
| C | 14 | 238 | 607818 | 673.26 | 3851 | 3873 | 897.0 |
| C | 13 | 61 | 27113 | 25.91 | 3851 | 3873 | 897.0 |
| C | 10 | 23 | 16280 | 13.83 | 3851 | 3873 | 897.0 |
| D | 7 | 238 | 37618160 | 48566.45 | 3186 | 3094 | 774.5 |
| D | 1 | 52 | 1661403 | 2141.11 | 3186 | 3094 | 774.5 |
| D | 2 | 136 | 546759 | 701.95 | 3186 | 3094 | 774.5 |
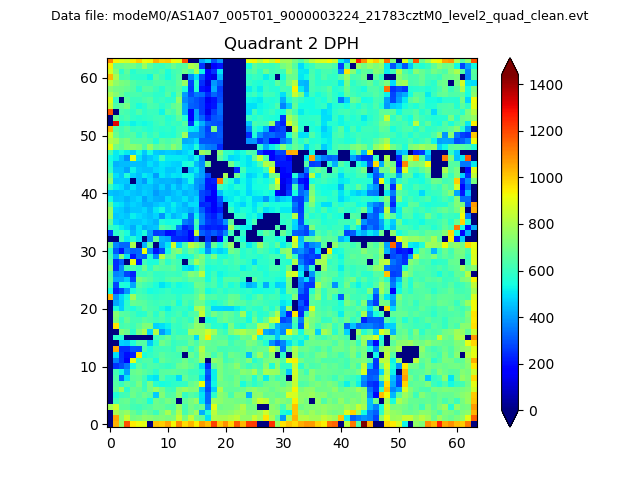
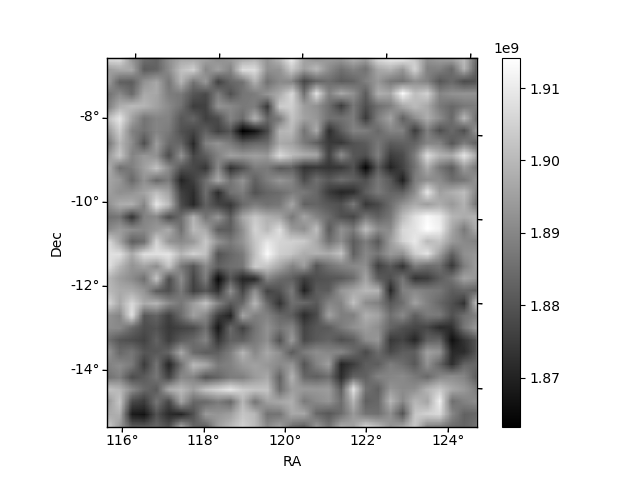
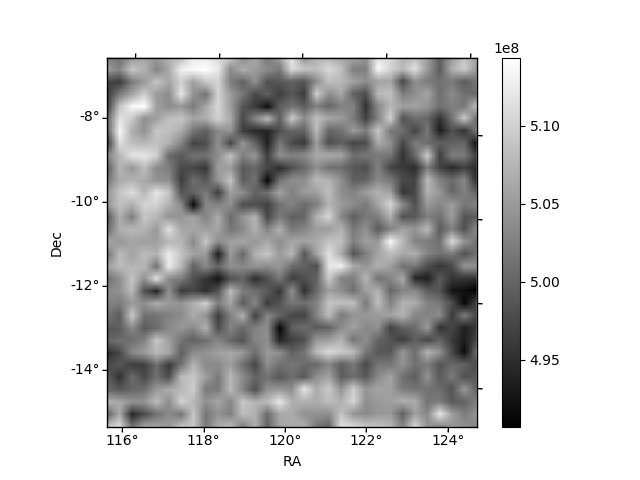
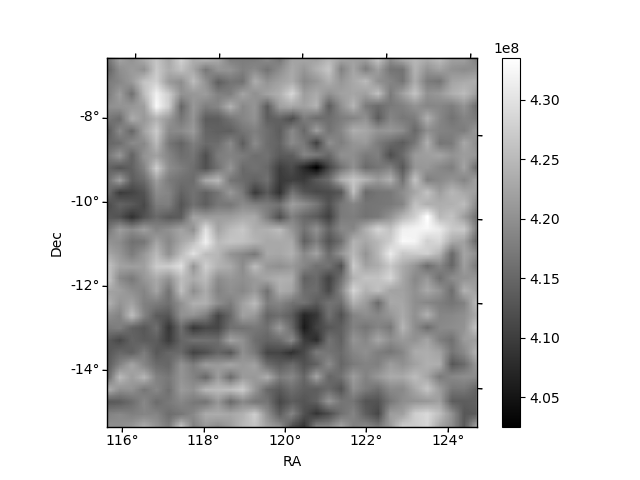
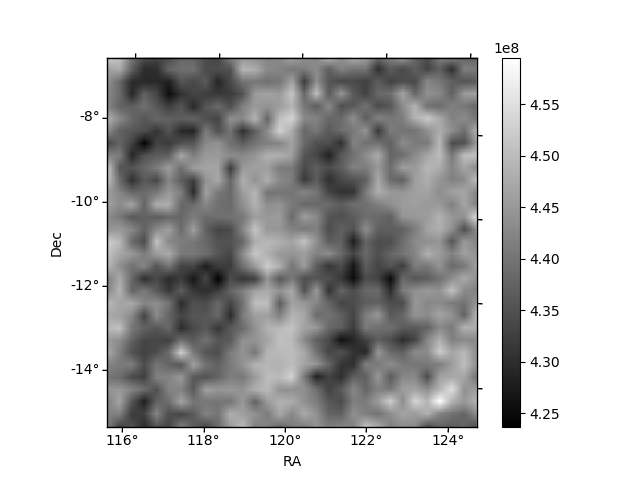
Histogram calculated using DETX and DETY for each event in the final _common_clean file
| Quadrant A | 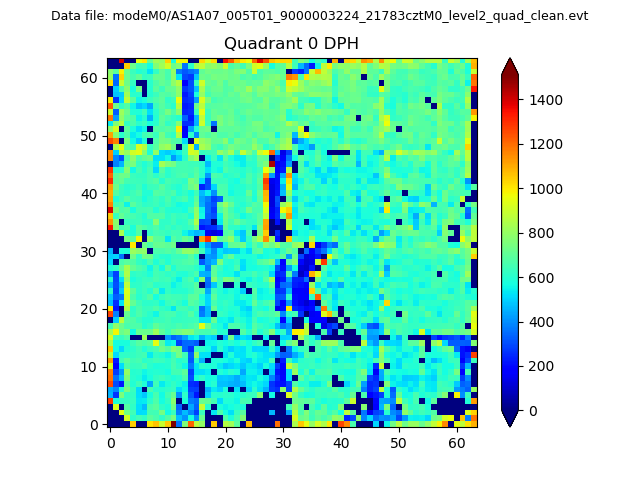 |
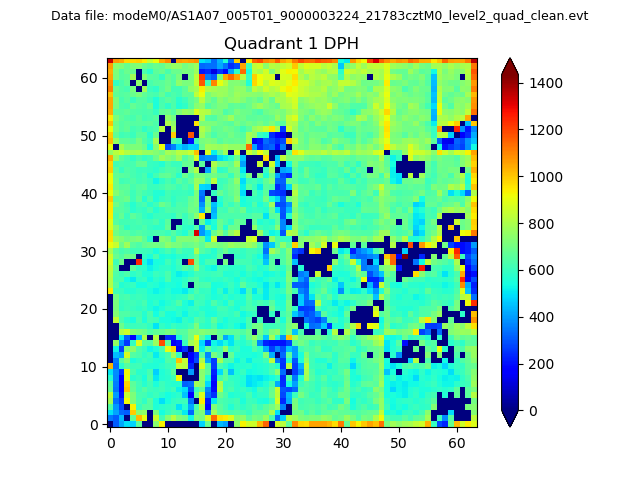 |
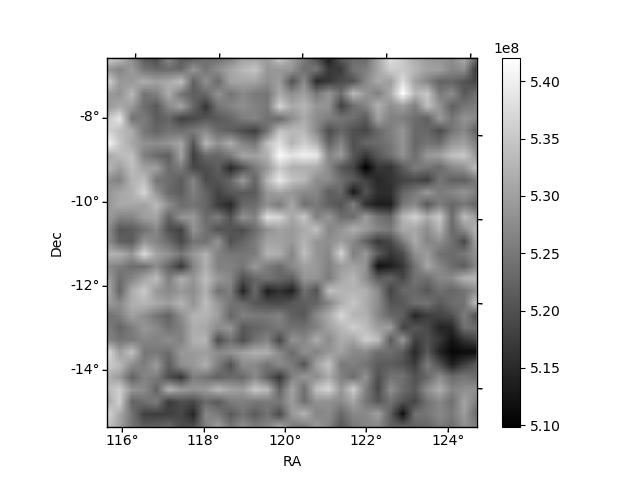
Quadrant B |
|---|---|---|---|
| Quadrant D | 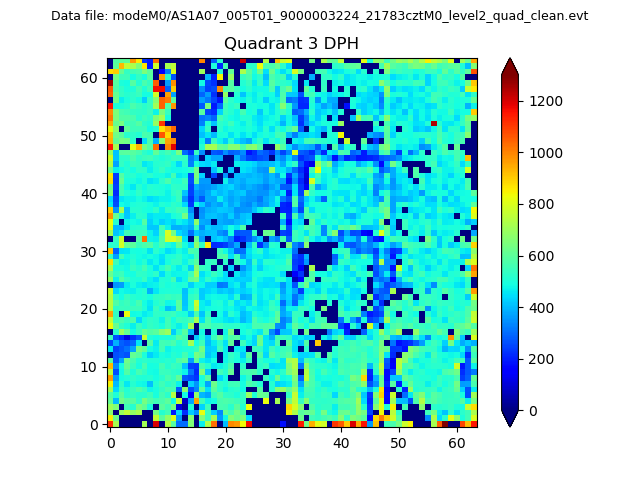 |
 |
Quadrant C |
| Plot type | Count rate plots | Images |
|---|---|---|
| Comparison with Poisson distribution Blue bars denote a histogram of data divided into 1 sec bins. Red curve is a Poisson curve with rate = median count rate of data. |
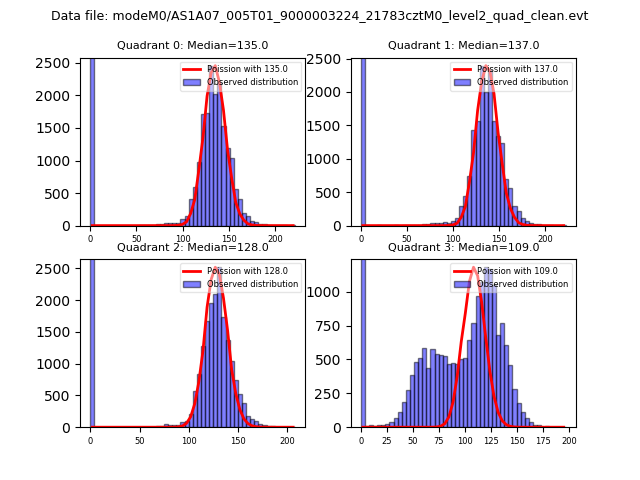 |
 |
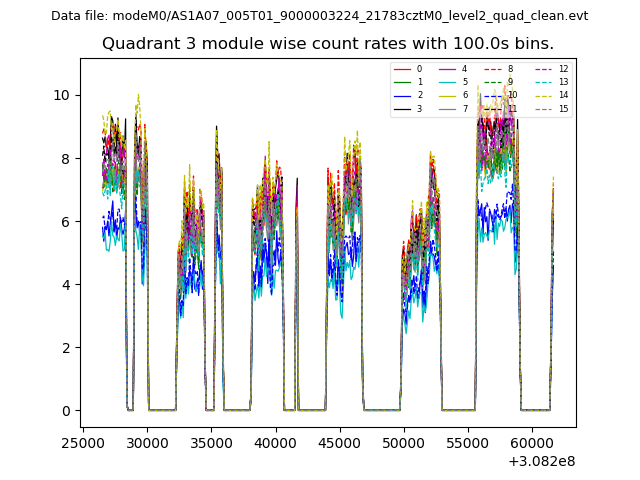
| Quadrant-wise count rates Data is divided into 100 sec bins |
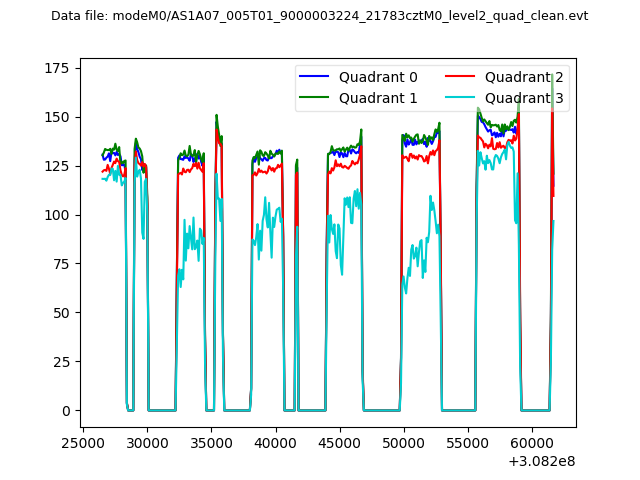 |
|
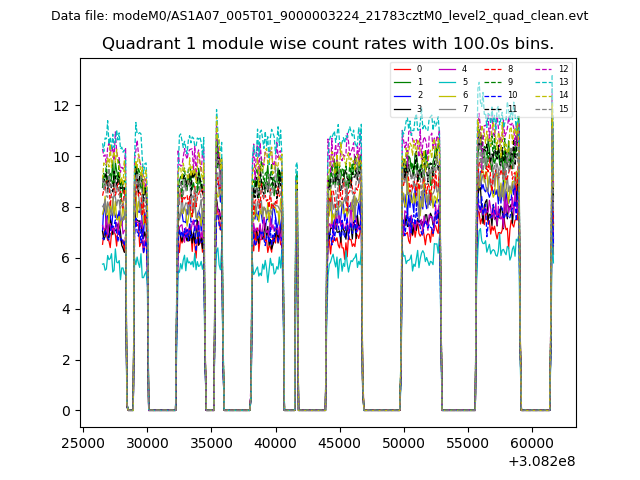
| Module-wise count rates for Quadrant A Data is divided into 100 sec bins |
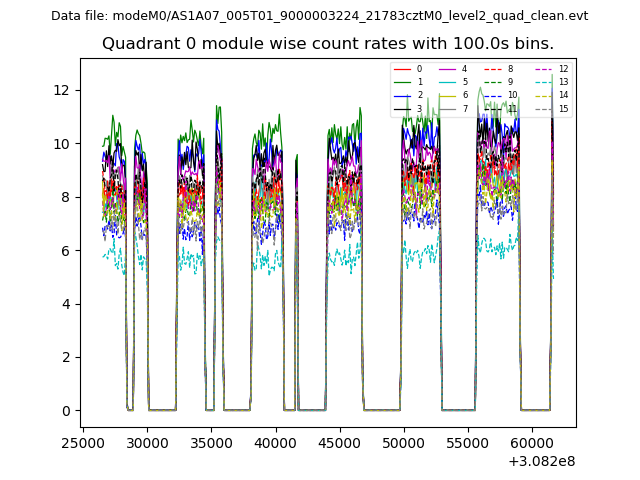 |
 |
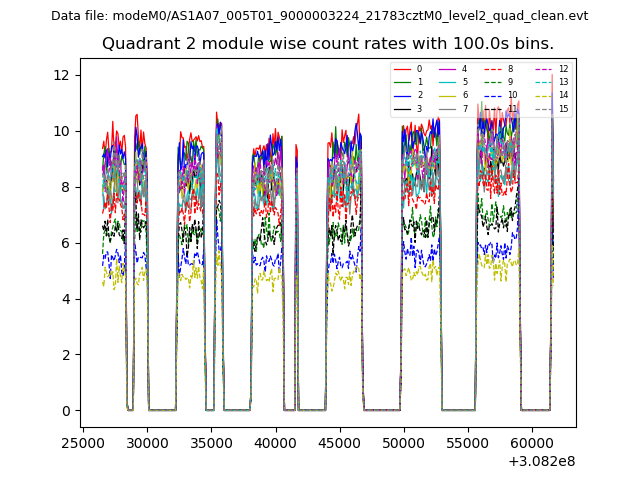
| Module-wise count rates for Quadrant B Data is divided into 100 sec bins |
 |
 |
| Module-wise count rates for Quadrant C Data is divided into 100 sec bins |
 |
 |
| Module-wise count rates for Quadrant D Data is divided into 100 sec bins |
 |
 |
| Parameter | Plot |
|---|---|
| CZT HV Monitor | 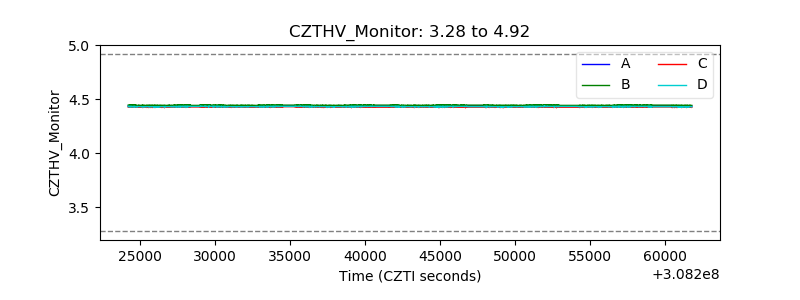 |
| D_VDD | 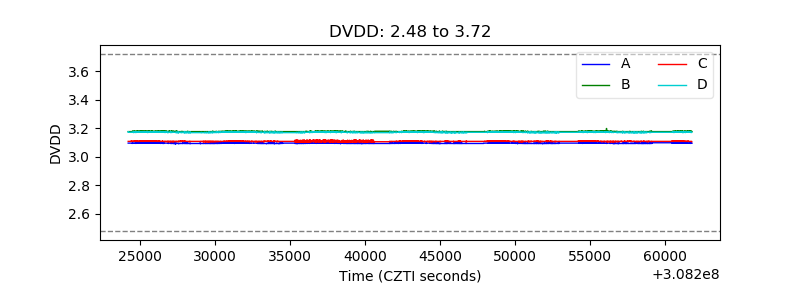 |
| Temperature 1 | 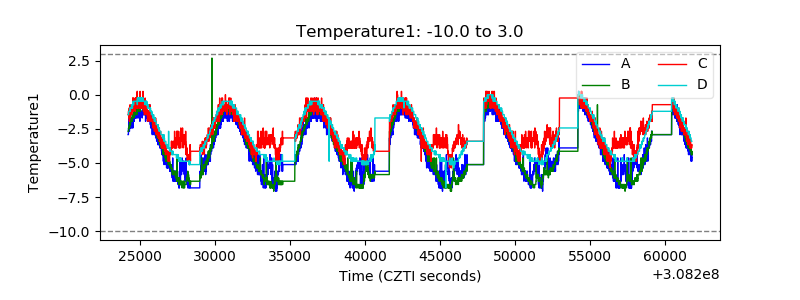 |
| Veto HV Monitor | 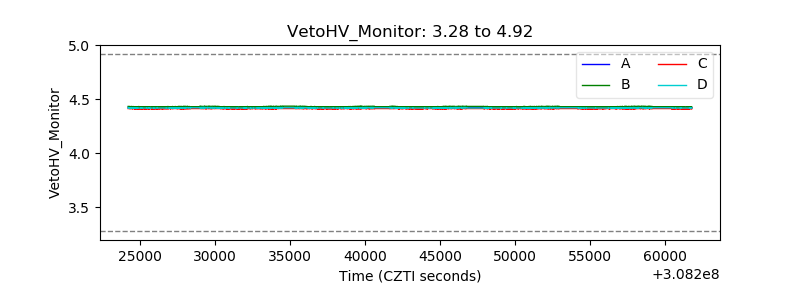 |
| Veto LLD | 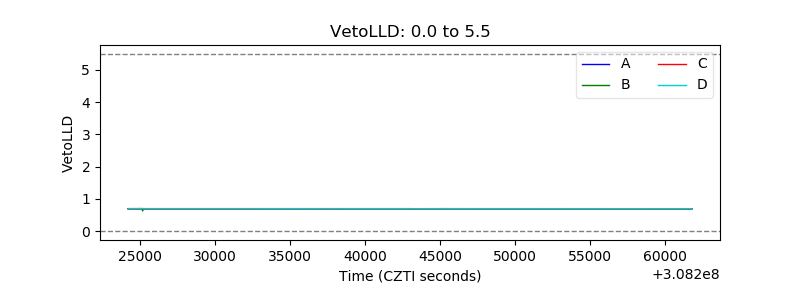 |
| Alpha Counter | 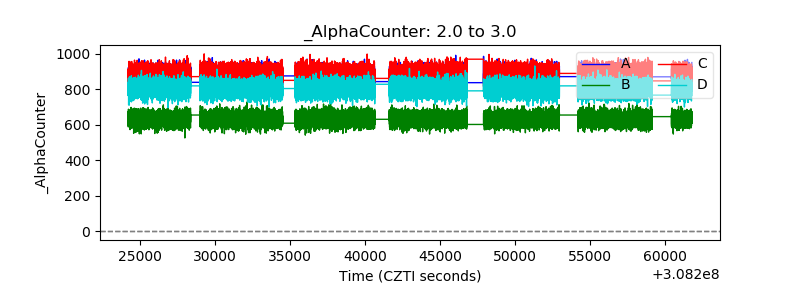 |
| _CPM_Rate | 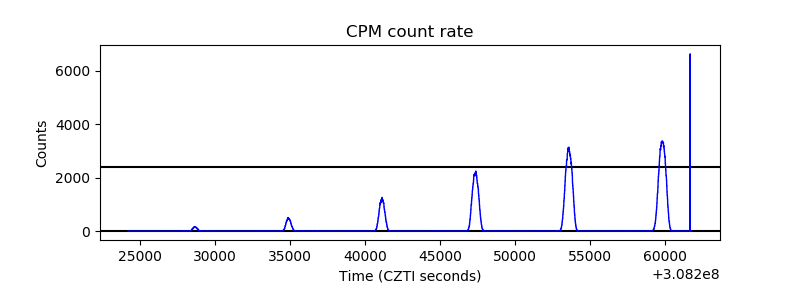 |
| CZT Counter | 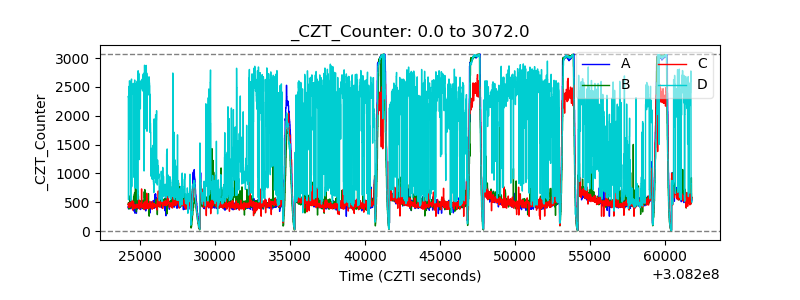 |
| +2.5 Volts monitor |  |
| +5 Volts monitor | 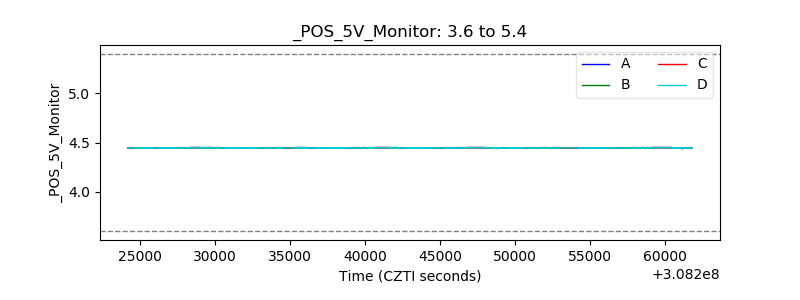 |
| _ROLL_ROT | 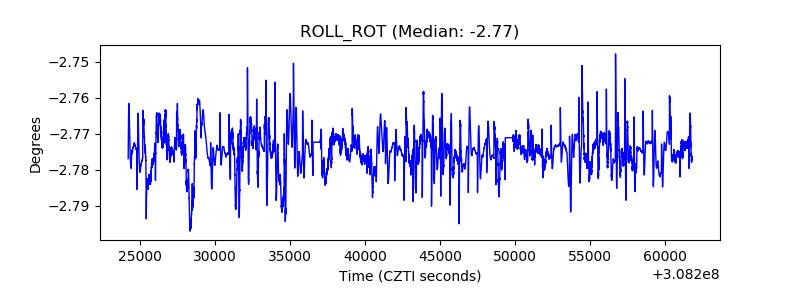 |
| _Roll_DEC | 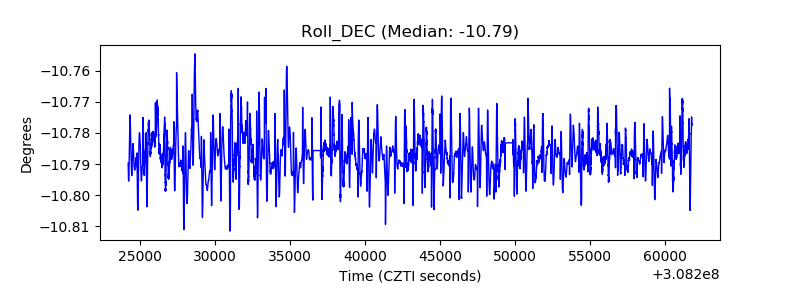 |
| _Roll_RA | 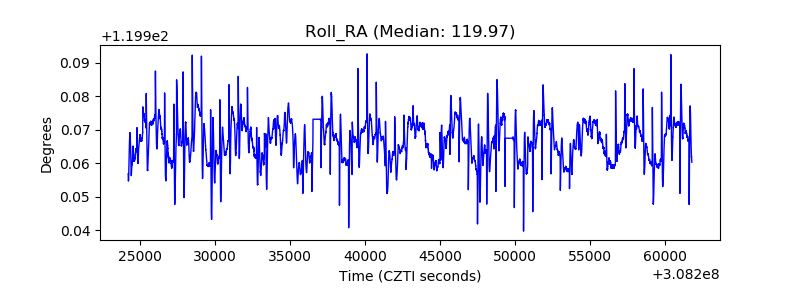 |
| Veto Counter | 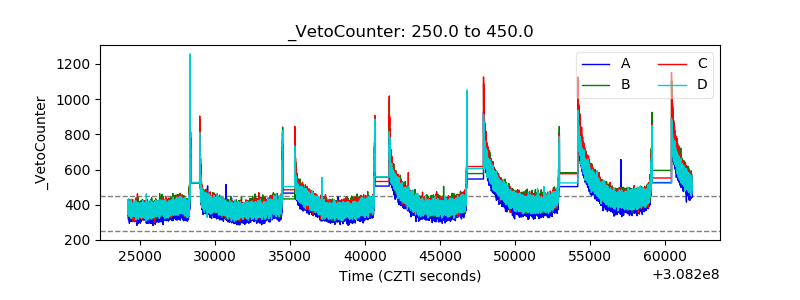 |