| Param | Original file | Final file |
|---|---|---|
| Filename | modeM0/AS1A07_005T01_9000003224_21784cztM0_level2.evt | modeM0/AS1A07_005T01_9000003224_21784cztM0_level2_quad_clean.evt |
| Size (bytes) | 226,071,360 | 20,908,800 |
| Size | 215.6 MB | 19.9 MB |
| Events in quadrant A | 1,039,637 | 132,938 |
| Events in quadrant B | 1,127,532 | 137,991 |
| Events in quadrant C | 1,041,708 | 126,835 |
| Events in quadrant D | 3,508,850 | 98,300 |
| Mode M0 | |||
|---|---|---|---|
| Quadrant | BADHDUFLAG | Total packets | Discarded packets |
| A | 0 | 4295 | 0 |
| B | 0 | 4627 | 0 |
| C | 0 | 4263 | 0 |
| D | 0 | 11681 | 0 |
| Mode SS | |||
|---|---|---|---|
| Quadrant | BADHDUFLAG | Total packets | Discarded packets |
| A | 0 | 38 | 0 |
| B | 0 | 38 | 0 |
| C | 0 | 38 | 0 |
| D | 0 | 38 | 0 |
| Quadrant | Total seconds | Saturated seconds | Saturation percentage |
|---|---|---|---|
| A | 1862 | 4 | 0.214823% |
| B | 1862 | 12 | 0.644468% |
| C | 1862 | 18 | 0.966702% |
| D | 1863 | 1230 | 66.022544% |
Noise dominated data is calculated using 1-second bins in cleaned event files. If a bin has >2000 counts, and if more than 50% of those come from <1% of pixels, then it is considered to be noise-dominated and hence unusable.
| Quadrant | # 1 sec bins | Bins with >0 counts | Bins with >2000 counts | High rate bins dominated by noise | Noise dominated (total time) | Noise dominated (detector-on time) | Marked lightcurve |
|---|---|---|---|---|---|---|---|
| A | 1862 | 1862 | 0 | 0 | 0.00% | 0.00% | 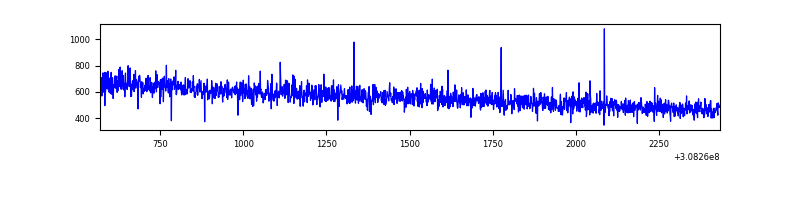 |
| B | 1862 | 1862 | 4 | 4 | 0.21% | 0.21% | 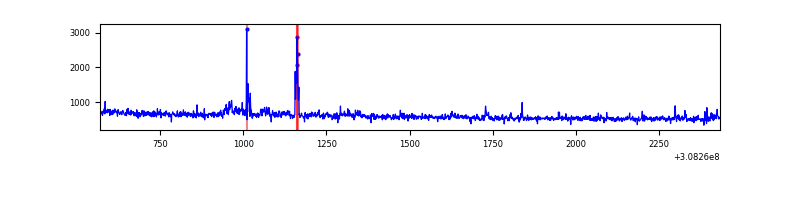 |
| C | 1862 | 1862 | 0 | 0 | 0.00% | 0.00% |  |
| D | 1863 | 1863 | 1153 | 1153 | 61.89% | 61.89% | 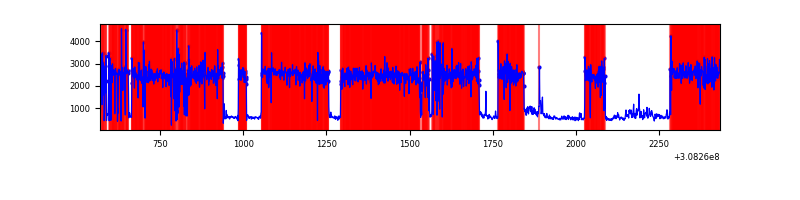 |
Top three noisy pixels from each quadrant. If the there are fewer than three noisy pixels in the level2.evt file, extra rows are filled as -1
| Pixel properties | Quadrant properties | ||||||
|---|---|---|---|---|---|---|---|
| Quadrant | DetID | PixID | Counts | Sigma | Mean | Median | Sigma |
| A | 13 | 254 | 3829 | 64.74 | 269 | 265 | 55.1 |
| A | 0 | 226 | 2424 | 39.22 | 269 | 265 | 55.1 |
| A | 12 | 194 | 1905 | 29.79 | 269 | 265 | 55.1 |
| B | 0 | 190 | 27532 | 533.08 | 271 | 266 | 51.1 |
| B | 3 | 64 | 16150 | 310.55 | 271 | 266 | 51.1 |
| B | 0 | 230 | 11467 | 218.99 | 271 | 266 | 51.1 |
| C | 14 | 238 | 41290 | 683.64 | 255 | 257 | 60.0 |
| C | 4 | 223 | 2826 | 42.8 | 255 | 257 | 60.0 |
| C | 13 | 61 | 1852 | 26.57 | 255 | 257 | 60.0 |
| D | 7 | 238 | 2705235 | 57532.74 | 187 | 181 | 47.0 |
| D | 1 | 52 | 49858 | 1056.56 | 187 | 181 | 47.0 |
| D | 7 | 223 | 15406 | 323.81 | 187 | 181 | 47.0 |
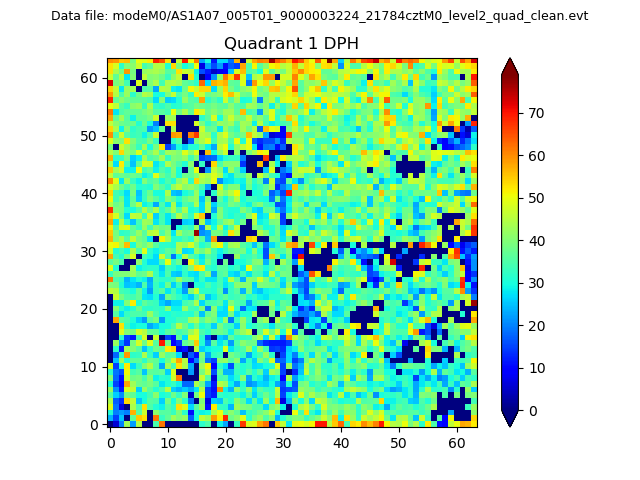
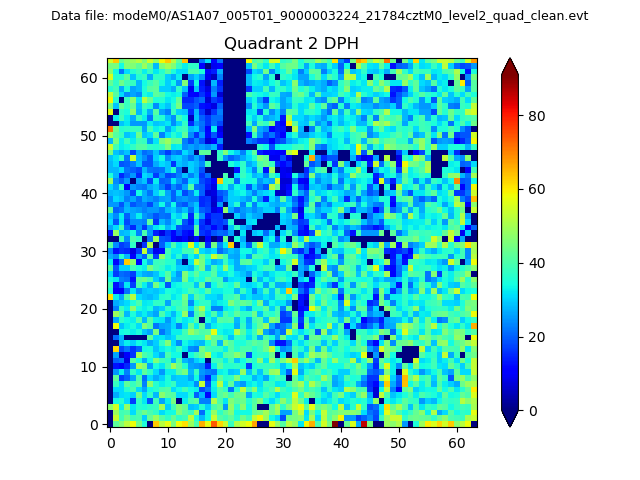
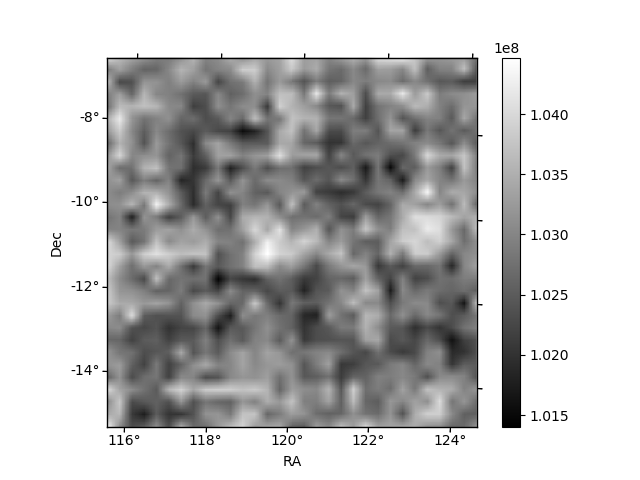
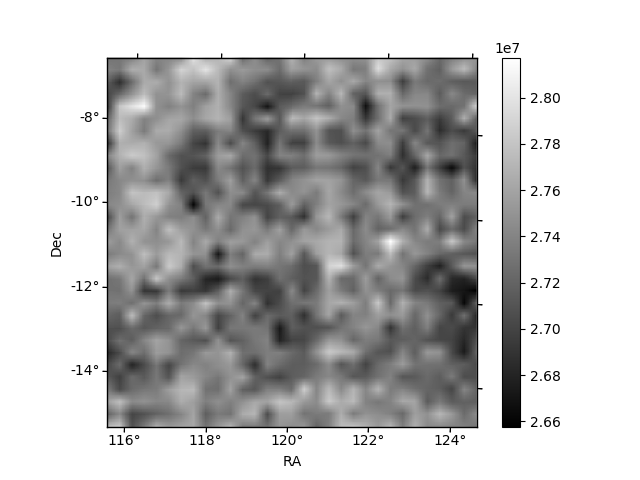
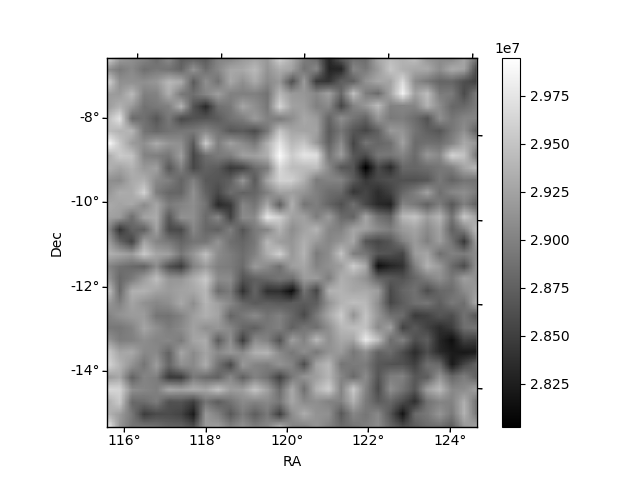
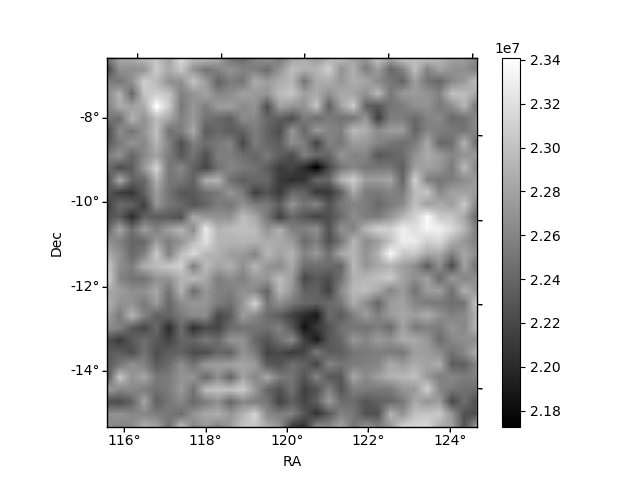
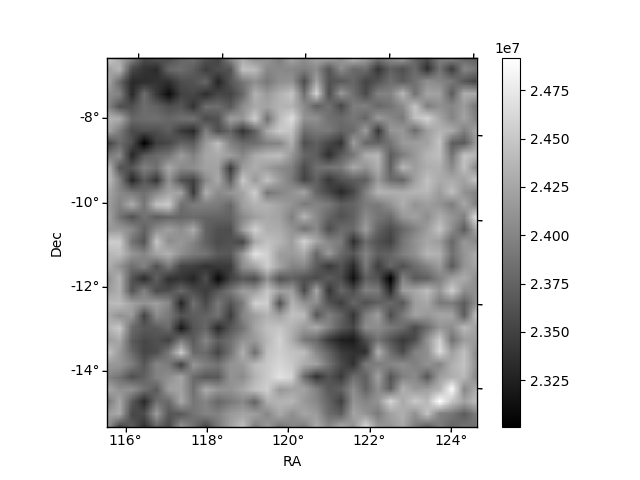
Histogram calculated using DETX and DETY for each event in the final _common_clean file
| Quadrant A | 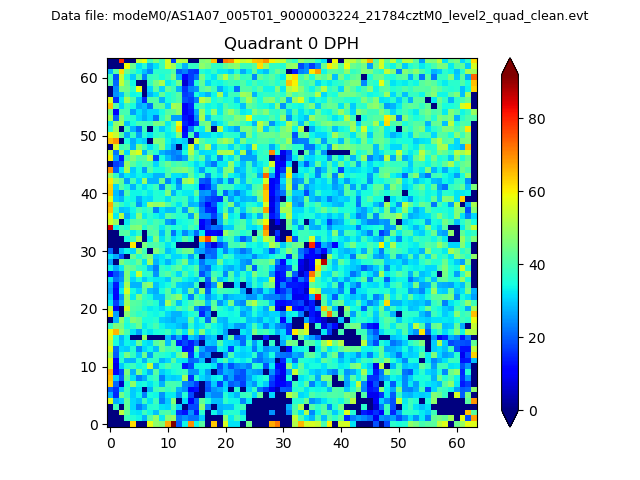 |
 |
Quadrant B |
|---|---|---|---|
| Quadrant D | 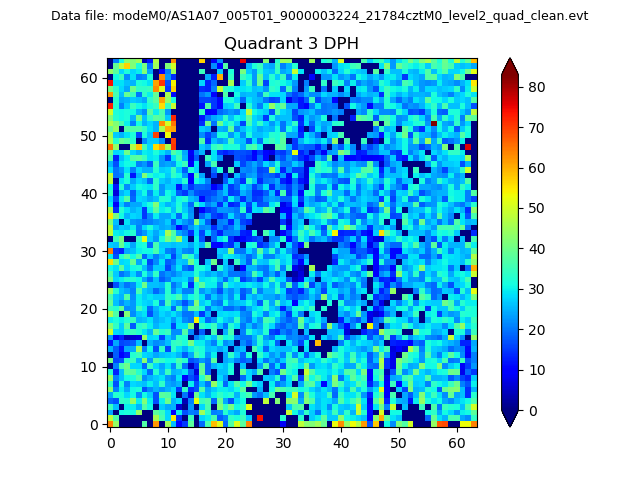 |
 |
Quadrant C |
| Plot type | Count rate plots | Images |
|---|---|---|
| Comparison with Poisson distribution Blue bars denote a histogram of data divided into 1 sec bins. Red curve is a Poisson curve with rate = median count rate of data. |
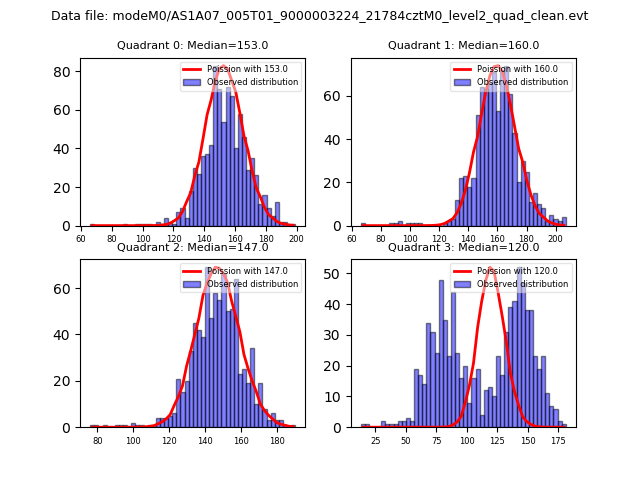 |
 |
| Quadrant-wise count rates Data is divided into 100 sec bins |
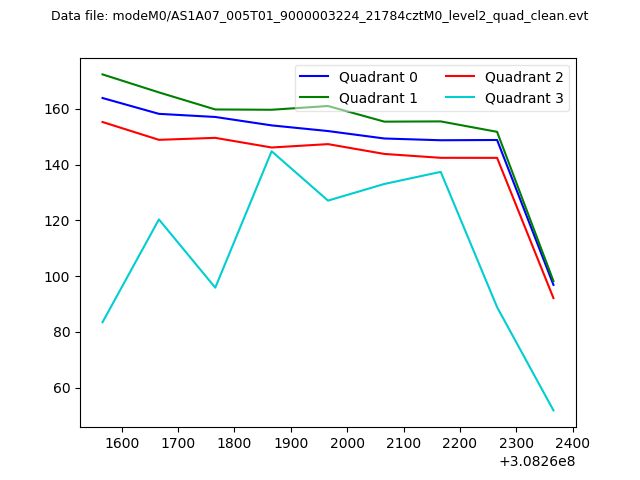 |
|
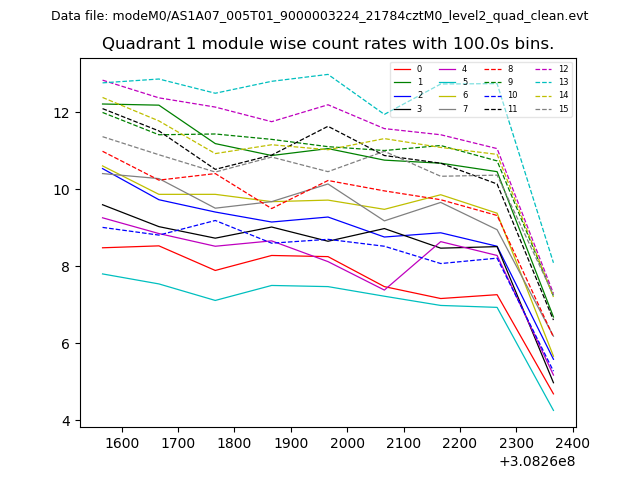
| Module-wise count rates for Quadrant A Data is divided into 100 sec bins |
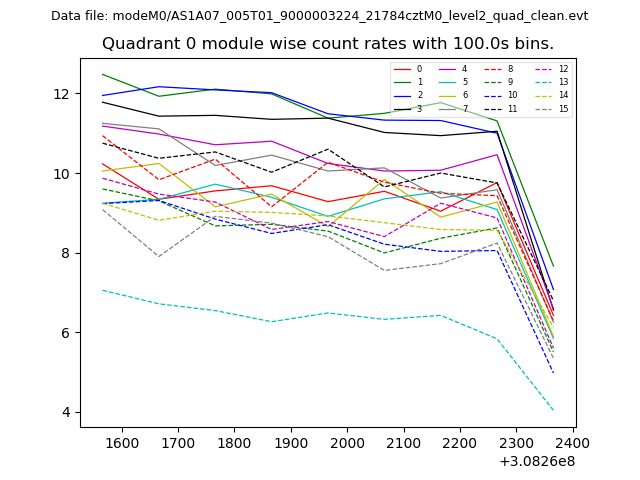 |
 |
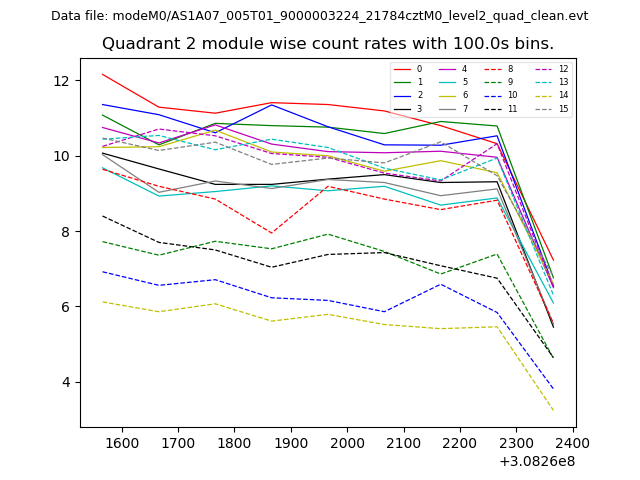
| Module-wise count rates for Quadrant B Data is divided into 100 sec bins |
 |
 |
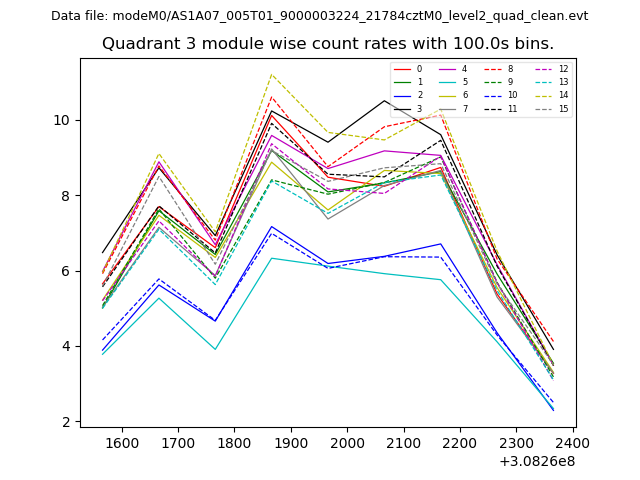
| Module-wise count rates for Quadrant C Data is divided into 100 sec bins |
 |
 |
| Module-wise count rates for Quadrant D Data is divided into 100 sec bins |
 |
 |
| Parameter | Plot |
|---|---|
| CZT HV Monitor |  |
| D_VDD | 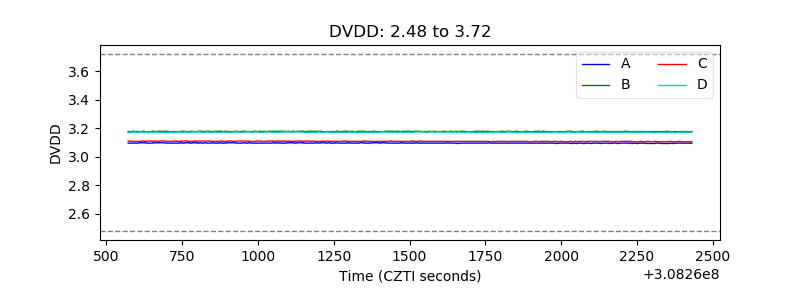 |
| Temperature 1 | 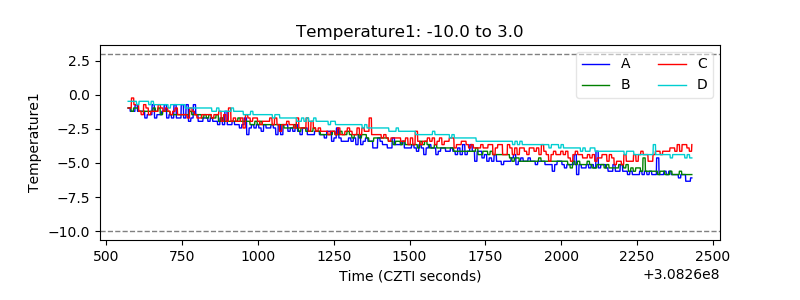 |
| Veto HV Monitor | 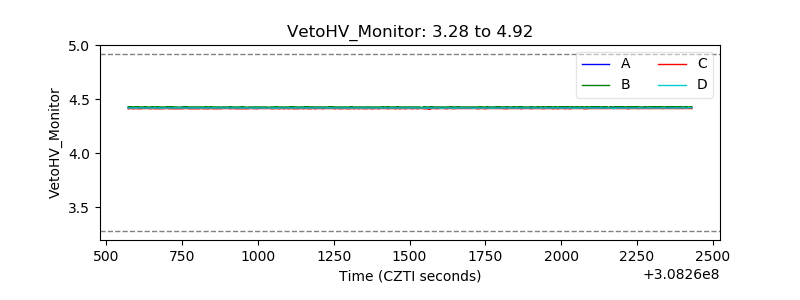 |
| Veto LLD | 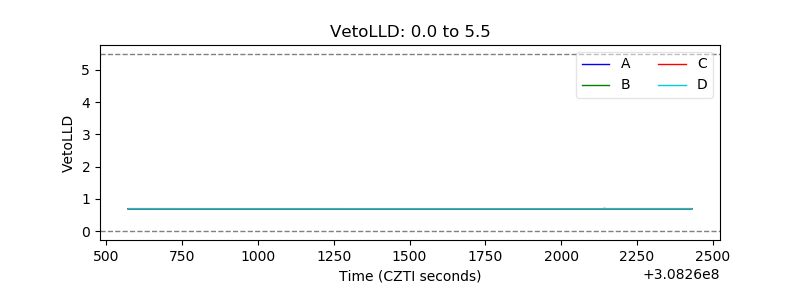 |
| Alpha Counter | 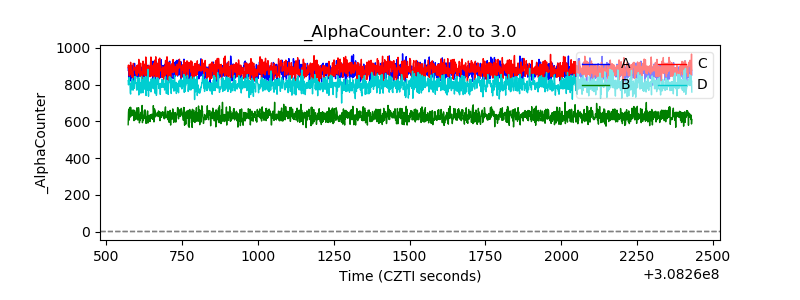 |
| _CPM_Rate | 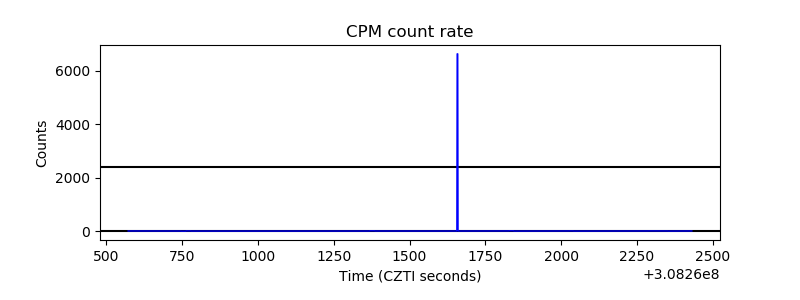 |
| CZT Counter | 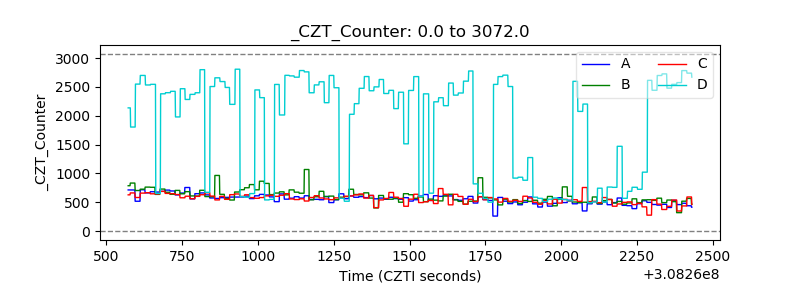 |
| +2.5 Volts monitor |  |
| +5 Volts monitor |  |
| _ROLL_ROT | 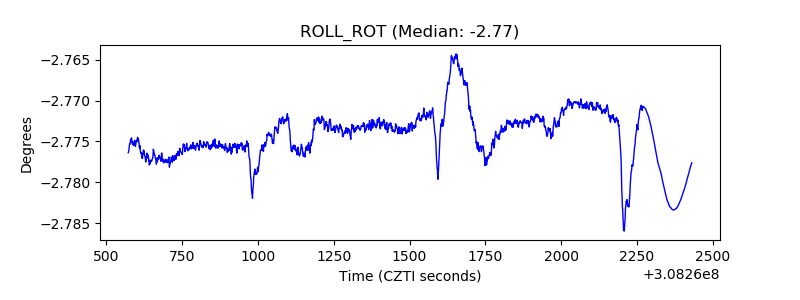 |
| _Roll_DEC | 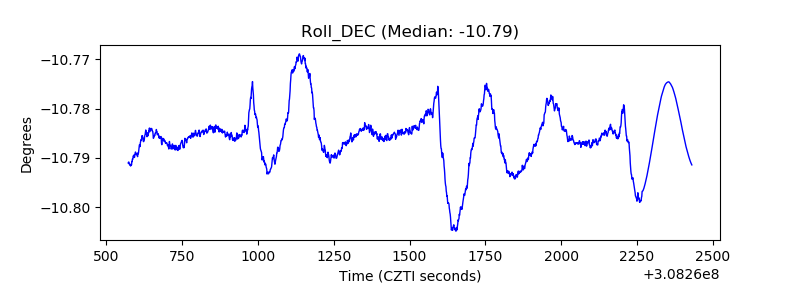 |
| _Roll_RA | 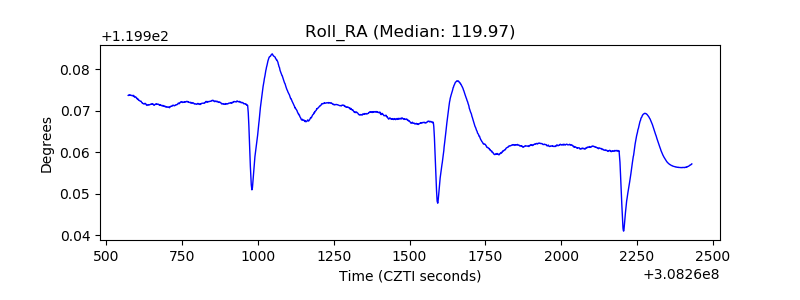 |
| Veto Counter | 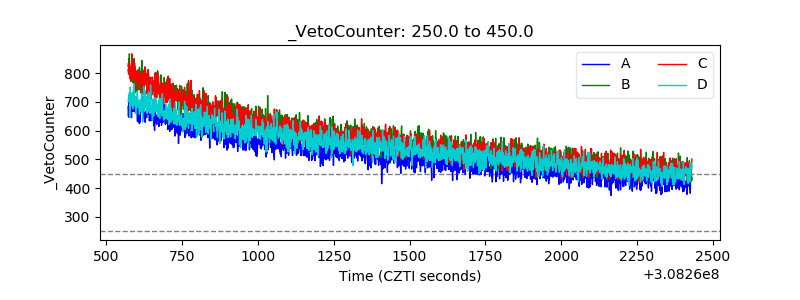 |