| Param | Original file | Final file |
|---|---|---|
| Filename | modeM0/AS1A07_027T16_9000003222cztM0_level2.fits | modeM0/AS1A07_027T16_9000003222cztM0_level2_quad_clean.evt |
| Size (bytes) | 102,821,760 | 82,627,200 |
| Size | 98.1 MB | 78.8 MB |
| Events in quadrant A | 605,526 | 450,233 |
| Events in quadrant B | 597,248 | 457,121 |
| Events in quadrant C | 612,200 | 440,811 |
| Events in quadrant D | 527,900 | 382,814 |
| Mode M9 | |||
|---|---|---|---|
| Quadrant | BADHDUFLAG | Total packets | Discarded packets |
| A | 0 | 5 | 0 |
| B | 0 | 5 | 0 |
| C | 0 | 5 | 0 |
| D | 0 | 5 | 0 |
| Mode SS | |||
|---|---|---|---|
| Quadrant | BADHDUFLAG | Total packets | Discarded packets |
| A | 0 | 226 | 0 |
| B | 0 | 226 | 0 |
| C | 0 | 226 | 0 |
| D | 0 | 226 | 0 |
| Mode M0 | |||
|---|---|---|---|
| Quadrant | BADHDUFLAG | Total packets | Discarded packets |
| A | 0 | 26548 | 0 |
| B | 0 | 24152 | 0 |
| C | 0 | 23102 | 0 |
| D | 0 | 28803 | 0 |
| Quadrant | Total seconds | Saturated seconds | Saturation percentage |
|---|---|---|---|
| A | 11134 | 828 | 7.436680% |
| B | 11134 | 356 | 3.197413% |
| C | 11134 | 339 | 3.044728% |
| D | 11134 | 644 | 5.784085% |
Noise dominated data is calculated using 1-second bins in cleaned event files. If a bin has >2000 counts, and if more than 50% of those come from <1% of pixels, then it is considered to be noise-dominated and hence unusable.
| Quadrant | # 1 sec bins | Bins with >0 counts | Bins with >2000 counts | High rate bins dominated by noise | Noise dominated (total time) | Noise dominated (detector-on time) | Marked lightcurve |
|---|---|---|---|---|---|---|---|
| A | 11664 | 11134 | 0 | 0 | 0.00% | 0.00% |  |
| B | 11664 | 11134 | 0 | 0 | 0.00% | 0.00% |  |
| C | 11664 | 11134 | 0 | 0 | 0.00% | 0.00% |  |
| D | 11664 | 11126 | 0 | 0 | 0.00% | 0.00% |  |
Top three noisy pixels from each quadrant. If the there are fewer than three noisy pixels in the level2.evt file, extra rows are filled as -1
| Pixel properties | Quadrant properties | ||||||
|---|---|---|---|---|---|---|---|
| Quadrant | DetID | PixID | Counts | Sigma | Mean | Median | Sigma |
| A | 0 | 29 | 568 | 10.04 | 157 | 147 | 41.9 |
| A | 7 | 110 | 496 | 8.32 | 157 | 147 | 41.9 |
| A | 0 | 30 | 443 | 7.06 | 157 | 147 | 41.9 |
| B | 2 | 9 | 463 | 9.2 | 157 | 149 | 34.1 |
| B | 5 | 225 | 422 | 8.0 | 157 | 149 | 34.1 |
| B | 5 | 128 | 405 | 7.5 | 157 | 149 | 34.1 |
| C | 12 | 241 | 465 | 7.22 | 161 | 150 | 43.6 |
| C | 7 | 111 | 445 | 6.76 | 161 | 150 | 43.6 |
| C | 2 | 191 | 442 | 6.69 | 161 | 150 | 43.6 |
| D | 1 | 19 | 371 | 5.6 | 150 | 137 | 41.8 |
| D | 6 | 231 | 370 | 5.58 | 150 | 137 | 41.8 |
| D | 3 | 14 | 369 | 5.56 | 150 | 137 | 41.8 |
Histogram calculated using DETX and DETY for each event in the final _common_clean file
| Quadrant A | 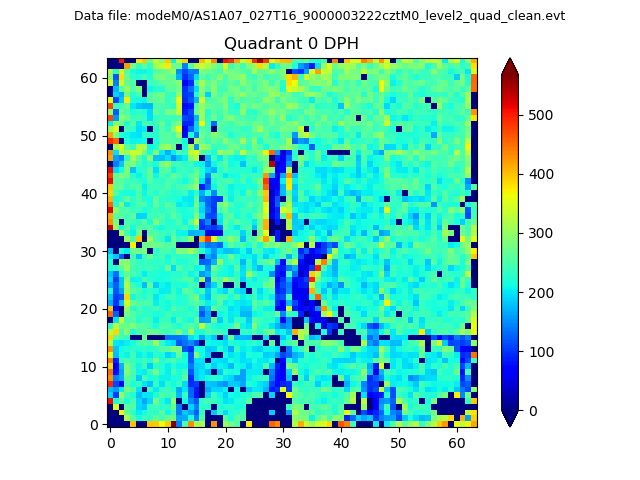 |
 |
Quadrant B |
|---|---|---|---|
| Quadrant D |  |
 |
Quadrant C |
| Plot type | Count rate plots | Images |
|---|---|---|
| Comparison with Poisson distribution Blue bars denote a histogram of data divided into 1 sec bins. Red curve is a Poisson curve with rate = median count rate of data. |
 |
 |
| Quadrant-wise count rates Data is divided into 100 sec bins |
 |
|
| Module-wise count rates for Quadrant A Data is divided into 100 sec bins |
 |
 |
| Module-wise count rates for Quadrant B Data is divided into 100 sec bins |
 |
 |
| Module-wise count rates for Quadrant C Data is divided into 100 sec bins |
 |
 |
| Module-wise count rates for Quadrant D Data is divided into 100 sec bins |
 |
 |
| Parameter | Plot |
|---|---|
| CZT HV Monitor |  |
| D_VDD |  |
| Temperature 1 |  |
| Veto HV Monitor |  |
| Veto LLD |  |
| Alpha Counter |  |
| _CPM_Rate |  |
| CZT Counter |  |
| +2.5 Volts monitor |  |
| +5 Volts monitor |  |
| _ROLL_ROT |  |
| _Roll_DEC |  |
| _Roll_RA |  |
| Veto Counter |  |